
PUBLISHER: Mordor Intelligence | PRODUCT CODE: 2066442

PUBLISHER: Mordor Intelligence | PRODUCT CODE: 2066442
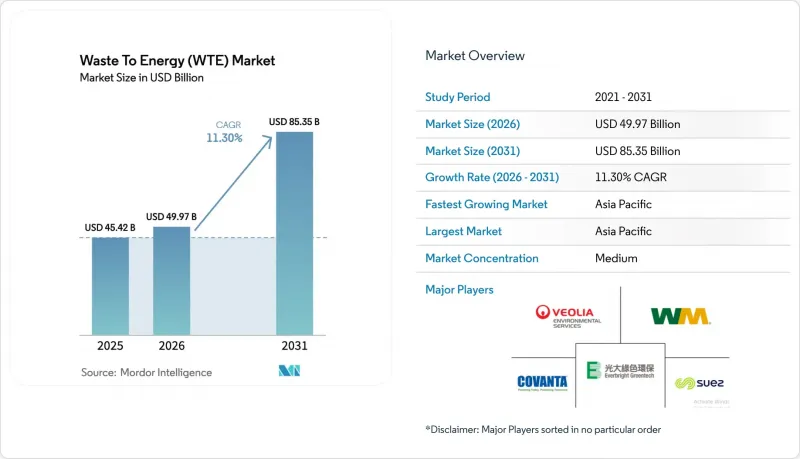
Waste To Energy (WTE) - Market Share Analysis, Industry Trends & Statistics, Growth Forecasts (2026 - 2031)
According to Mordor Intelligence, the waste to energy market is expected to grow from USD 45.42 billion in 2025 to USD 49.97 billion in 2026 and is forecasted to reach USD 85.35 billion by 2031 at 11.30% CAGR over 2026-2031.
This report is Segmented by Technology (Physical, Thermal, and Biological), Waste Type (Municipal Solid Waste, Industrial Waste, and More), Energy Output (Electricity, Heat, and More), End-Users (Utilities and IPPs, Industrial Captive Plants, District Heating Operators, and Transport Fuel Distributors), and Geography (North America, Europe, Asia-Pacific, South America, and Middle East and Africa).
Global Waste To Energy (WTE) Market Trends and Insights
Rapid Roll-Out of EfW Public-Private Partnership Pipelines in China's Greater Bay Area
Provincial authorities earmarked CNY 45 billion between 2024 and 2027 to create 120,000 tonnes per day of new capacity backed by 25-year revenue guarantees that de-risk private capital. Bottom-ash recycling revenues add 8%-12% to cash flow, while stricter source-segregation rules have lifted lower-heating values to 2,400 kcal/kg, increasing net generation per tonne by 22%. The template is expanding to the Yangtze River Delta and Chengdu-Chongqing Economic Circle, where fourteen additional concessions reached financial close in 2025. Volume certainty and feedstock quality are shortening debt-service coverage break-evens from seven to five years. International lenders view the standardized concession model as bankable, unlocking multi-currency financing that amplifies the waste to energy market deal flow.
EU Green Taxonomy Incentives Accelerating Retrofit of Legacy Incineration Fleets
Delegated Regulation 2024/1214 re-tagged high-efficiency retrofits as sustainable investments, opening EUR 2.8 billion of green-bond proceeds for forty-seven plants in 2025. Weighted average costs of capital dropped 120 basis points, pushing payback on flue-gas cleaning and heat-recovery upgrades below seven years. MVV Energie's EUR 300 million bond financed a condensing economizer that elevates thermal efficiency to 68%, delivering district heat to 45,000 households. Co-firing incentives for refuse-derived fuel in cement kilns reduce coal demand by 420,000 tonnes annually, widening the waste to energy market valorization pathways.
Stricter Dioxin-Emission Caps Postponing Permits for Grate-Furnace Refurbishments in Germany
Germany's July 2024 ordinance halved the dioxin limit to 0.05 ng/m3, obliging EUR 8-15 million retrofits per 100,000 tpy plant. Twenty-three facilities had permit renewals deferred in 2025, idling 1.2 million tpy and forcing exports to the Netherlands at GBP 35 per tonne. Mid-sized municipal utilities deferred upgrades, while large integrated operators such as Veolia absorbed contracts, capturing premium tipping fees. Austria signaled adoption of the stricter cap by 2027, front-loading EUR 110 million of planned capital expenditure, and constraining near-term growth in the waste to energy market.
Other drivers and restraints analyzed in the detailed report include:
- National Bans on Unsegregated Landfill Triggering MSW Diversion in India's Tier-2 Cities
- Soaring Carbon-Credit Prices Improving WTE Project IRRs in South Korea
- Limited Tipping-Fee Escalation Clauses Hurting Project Bankability in Indonesia
For complete list of drivers and restraints, kindly check the Table Of Contents.
Segment Analysis
Incineration anchored 65.1% of the waste to energy market in 2025, reflecting the lower capital intensity of USD 450,000-650,000 per tonne-per-day capacity. In contrast, plasma-arc gasification, with capex north of USD 850,000 per tonne-per-day, is scaling because municipalities prize 98% volume reduction and vitrified slag suitable for aggregates. Seoul's pilot plant demonstrated KRW 85,000-per-tonne landfill-avoidance savings, quickening payback for plasma retrofits. Retrofitting bottom-ash plasma torches at three U.S. facilities will recover 12% more ferrous metals and cut landfill costs by USD 18/tonne.
Gasification projects in Japan convert municipal solid waste to syngas, hitting electrical efficiencies up to 32% against 22% for grate incineration. Biological routes thrive in organic-rich geographies; India commissioned 3,200 tpd biomethanation in 2025 for compressed natural gas fleets. Mechanical-biological treatment (MBT) plants in the United Kingdom processed 4.8 million tonnes in 2025, raising calorific value for refuse-derived fuel exports by 14%. Technology selection now hinges on local emission caps, carbon-credit upside, and feedstock composition, collectively widening the Waste to Energy (WTE) market's technology palette.
Municipal solid waste comprised 70.2% of input volumes in 2025 in the waste to energy industry, yet agricultural residues will post a 14.4% CAGR through 2031 as Brazil's sugar-bagasse biogas mandates and Vietnam's rice-husk pelletization gain scale. Industrial waste delivers steady volumes in the waste-to-energy sector, especially from electronics and automotive plants seeking closed-loop plastics and metal recovery. Sewage sludge digestion accelerated in the waste-to-energy industry in Europe after the revised Urban Wastewater Directive, adding 112 digesters in 2025.
Construction-and-demolition streams are pre-treated to extract high-calorific fractions for MBT plants in the Netherlands, where 1.1 million tonnes of combustible material replaced coal in cement kilns. Hazardous-waste capacity rose in China to 680,000 tonnes in 2025, generating 420 GWh of electricity from medical and electronic residues. Feedstock logistics remain a brake; dispersed crop-residue collection costs of USD 25-40/tonne confine commercial radii to 50 km, driving consolidation around high-yield farm belts and influencing the waste to energy market spatial clustering.
Geography Analysis
Asia-Pacific's 45.1% share in 2025 crowns it the largest regional block of the waste to energy market; the region is tracking a robust 13.0% CAGR to 2031 as China's 800,000 t-per-day capacity targets and India's landfill-ban deadlines reach execution. China's Greater Bay Area concession model, boasting CNY 45 billion funding and 25-year feedstock guarantees, lowered debt-service risk and may migrate to ASEAN, where Vietnam and Thailand closed eleven concessions in 2025. India's Tier-2 cities added 14,500 t-per-day via viability-gap funding, with biomethanation replacing diesel in municipal fleets. Japan's approval of eight syngas-gasification projects and South Korea's KRW 28,000-per-tonne carbon allowance underscore the policy-tailwind narrative.
Europe's waste to energy market momentum pivots on retrofit economics. The EU Green Taxonomy spurred EUR 2.8 billion in green-bond activity, yet Germany's tighter dioxin cap idled 1.2 million t-per-year, curbing near-term throughput. Nordic corporate biogas PPAs totaled 1.8 TWh in 2025, boosting biomethane investment. The United Kingdom's QP-RDF calorific-value floor imposed GBP 78 million in sorting upgrades, raising export fuel quality and tightening domestic supply.
North America's build-out depends on U.S. D3 cellulosic credits that lifted project IRRs 12-15%, catalyzing six plants totaling 720,000 tpy. Canada's CAD 80-per-tonne carbon price made waste-to-energy competitive, yielding projects in Ontario and British Columbia. Latin America's traction centers on Brazil's biomethane purchase mandate, the first of its kind in the region, guaranteeing floor prices that improve feedstock contracts.
The Middle East and Africa are emerging but strategic; the 300,000 t-per-year Sharjah plant is the region's largest, while Saudi Arabia's 2,400 t-per-day concessions underpin Vision 2030 waste-diversion targets. South Africa's tariff of ZAR 1.80/kWh under REIPPP unlocked three urban plants, and Egypt's EUR 420 million MoU with the EBRD signals growing multilateral appetite.
- Veolia Environnement SA
- Suez SA
- Waste Management Inc.
- Covanta Holding Corp.
- Wheelabrator Technologies Inc.
- Mitsubishi Heavy Industries Ltd
- Hitachi Zosen Corp.
- Babcock & Wilcox Enterprises Inc.
- A2A SpA
- MVV Energie AG
- Martin GmbH fur Umwelt- und Energietechnik
- China Everbright Environment Group Ltd
- China Jinjiang Environment Holding Co.
- Xcel Energy Inc.
- Shenzhen Energy Group Co.
- Keppel Seghers
- Remondis SE & Co. KG
- FCC Servicios Medio Ambiente
- Enerkem Inc.
- Sembcorp Industries Ltd
- Green Conversion Systems LLC
- Fortum Oyj
Additional Benefits:
- The market estimate (ME) sheet in Excel format
- 3 months of analyst support
TABLE OF CONTENTS
1 Introduction
- 1.1 Study Assumptions & Market Definition
- 1.2 Scope of the Study
2 Research Methodology
3 Executive Summary
4 Market Landscape
- 4.1 Market Overview
- 4.2 Market Drivers
- 4.2.1 Rapid roll-out of EfW public-private partnership pipelines in China's Greater Bay Area
- 4.2.2 EU Green Taxonomy incentives accelerating retrofit of legacy incineration fleets
- 4.2.3 National bans on unsegregated landfill triggering MSW diversion in India's Tier-2 cities
- 4.2.4 Soaring carbon credit prices improving WTE project IRRs in South Korea
- 4.2.5 Circular-economy led corporate power-purchase agreements (CPPAs) for biogas in Nordics
- 4.2.6 Mandatory calorific value thresholds for RDF exports in the UK post-Brexit
- 4.3 Market Restraints
- 4.3.1 Stricter dioxin emission caps postponing permits for grate-furnace refurbishments in Germany
- 4.3.2 Limited tipping-fee escalation clauses hurting project bankability in Indonesia
- 4.3.3 Anaerobic-digestion feedstock price volatility undermining margins in Brazil
- 4.3.4 Community push-back against plasma-arc facilities in Australia's peri-urban regions
- 4.4 Supply-Chain Analysis
- 4.5 Technological Outlook
- 4.6 Regulatory Outlook
- 4.7 Porter's Five Forces
- 4.7.1 Bargaining Power of Suppliers
- 4.7.2 Bargaining Power of Consumers
- 4.7.3 Threat of New Entrants
- 4.7.4 Threat of Substitutes
- 4.7.5 Intensity of Competitive Rivalry
- 4.8 Investment Analysis
5 Market Size & Growth Forecasts
- 5.1 By Technology
- 5.1.1 Physical (Refuse-Derived Fuel, Mechanical Biological Treatment)
- 5.1.2 Thermal (Incineration/Combustion, Gasification, Pyrolysis and Plasma-Arc)
- 5.1.3 Biological (Anaerobic Digestion, Fermentation)
- 5.2 By Waste Type
- 5.2.1 Municipal Solid Waste
- 5.2.2 Industrial Waste
- 5.2.3 Agricultural and Agro-industrial Residues
- 5.2.4 Sewage Sludge
- 5.2.5 Others (Commercial, Construction, Hazardous)
- 5.3 By Energy Output
- 5.3.1 Electricity
- 5.3.2 Heat
- 5.3.3 Combined Heat and Power (CHP)
- 5.3.4 Transportation Fuels (Bio-SNG, Bio-LNG, Ethanol)
- 5.4 By End-user
- 5.4.1 Utilities and Independent Power Producers (IPPs)
- 5.4.2 Industrial Captive Plants
- 5.4.3 District Heating Operators
- 5.4.4 Transport Fuel Distributors
- 5.5 By Geography
- 5.5.1 North America
- 5.5.1.1 United States
- 5.5.1.2 Canada
- 5.5.1.3 Mexico
- 5.5.2 Europe
- 5.5.2.1 United Kingdom
- 5.5.2.2 Germany
- 5.5.2.3 France
- 5.5.2.4 Spain
- 5.5.2.5 Nordic Countries
- 5.5.2.6 Russia
- 5.5.2.7 Rest of Europe
- 5.5.3 Asia-Pacific
- 5.5.3.1 China
- 5.5.3.2 India
- 5.5.3.3 Japan
- 5.5.3.4 South Korea
- 5.5.3.5 ASEAN Countries
- 5.5.3.6 Rest of Asia-Pacific
- 5.5.4 South America
- 5.5.4.1 Brazil
- 5.5.4.2 Argentina
- 5.5.4.3 Colombia
- 5.5.4.4 Rest of South America
- 5.5.5 Middle East and Africa
- 5.5.5.1 United Arab Emirates
- 5.5.5.2 Saudi Arabia
- 5.5.5.3 South Africa
- 5.5.5.4 Egypt
- 5.5.5.5 Rest of Middle East and Africa
- 5.5.1 North America
6 Competitive Landscape
- 6.1 Market Concentration
- 6.2 Strategic Moves (M&A, Partnerships, PPAs)
- 6.3 Market Share Analysis (Market Rank/Share for key companies)
- 6.4 Company Profiles (includes Global level Overview, Market level overview, Core Segments, Financials as available, Strategic Information, Products & Services, and Recent Developments)
- 6.4.1 Veolia Environnement SA
- 6.4.2 Suez SA
- 6.4.3 Waste Management Inc.
- 6.4.4 Covanta Holding Corp.
- 6.4.5 Wheelabrator Technologies Inc.
- 6.4.6 Mitsubishi Heavy Industries Ltd
- 6.4.7 Hitachi Zosen Corp.
- 6.4.8 Babcock & Wilcox Enterprises Inc.
- 6.4.9 A2A SpA
- 6.4.10 MVV Energie AG
- 6.4.11 Martin GmbH fur Umwelt- und Energietechnik
- 6.4.12 China Everbright Environment Group Ltd
- 6.4.13 China Jinjiang Environment Holding Co.
- 6.4.14 Xcel Energy Inc.
- 6.4.15 Shenzhen Energy Group Co.
- 6.4.16 Keppel Seghers
- 6.4.17 Remondis SE & Co. KG
- 6.4.18 FCC Servicios Medio Ambiente
- 6.4.19 Enerkem Inc.
- 6.4.20 Sembcorp Industries Ltd
- 6.4.21 Green Conversion Systems LLC
- 6.4.22 Fortum Oyj
7 Market Opportunities & Future Outlook
- 7.1 White-space & unmet-need assessment

