
PUBLISHER: Mordor Intelligence | PRODUCT CODE: 2066470

PUBLISHER: Mordor Intelligence | PRODUCT CODE: 2066470
Agrochemicals - Market Share Analysis, Industry Trends & Statistics, Growth Forecasts (2026 - 2031)
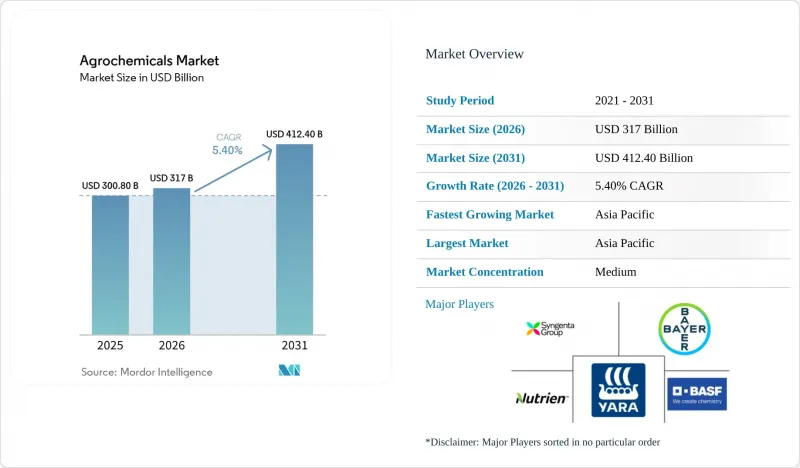
According to Mordor Intelligence, the agrochemicals market size is estimated to grow from USD 300.8 billion in 2025 to USD 317.0 billion in 2026, and is forecast to reach USD 412.4 billion by 2031, at a 5.4% CAGR over the forecast period.
This report is Segmented by Product Type (Fertilizers, Pesticides, and More), by Crop Type (Grains and Cereals, Pulses and Oilseeds, Fruits and Vegetables, and Commercial Crops, and More), and by Geography (North America, Europe, Asia-Pacific, South America, and More). The Market Forecasts are Provided in Terms of Value (USD).
Global Agrochemicals Market Trends and Insights
Rising Herbicide-Resistant Weeds and Resistant Pathogen Pressure
The agrochemicals market is seeing durable demand because weed resistance is no longer limited to isolated crop systems. The International Herbicide-Resistant Weed Database recorded 546 unique resistance cases involving 274 species across 76 countries as of May 2026, with the United States at 138 cases, Australia at 91, and Canada at 56. The problem is more severe in regions where glyphosate and ALS-inhibitor chemistries were used heavily across repeated crop rotations. Peer-reviewed work published in 2024 showed that cross-resistance within herbicide groups is becoming more complex, which means growers cannot rely on simple sequence changes to restore efficacy. This trend supports premium pricing for new modes-of-action herbicides, including Syngenta's VIRESTINA technology, FMC's Dodhylex active, and Bayer's Stryax dicamba for the 2026 season. The HRAC's 2025 guideline also moved AI-based site-specific weed management closer to routine practice, linking herbicide performance directly to digital scouting and variable-rate application tools.
Precision Agriculture and Variable-Rate Application Scaling
The agrochemicals market is also being supported by better application accuracy rather than by simple volume expansion. China's agricultural drone coverage reached 173 million hectares in 2024, rising to 178 million hectares in 2025, underscoring how quickly precision delivery is spreading across large farming systems. Variable-rate technology lets growers apply different doses based on field conditions, helping preserve efficacy where resistance pressure is uneven and supporting compliance as residue oversight becomes stricter. Yara's February 2026 launch of the YaraPlus digital platform in the United Kingdom, integrated with John Deere hardware, showed that major suppliers now treat digital agronomy as a commercial product rather than a support feature. Corteva's Q1 2026 net sales rose 11% year on year to USD 4.9 billion, which supports the view that premium chemistry paired with targeted application is outperforming the broader agrochemicals market. The practical outcome is that precision farming can reduce waste at the field level while still supporting higher revenue per litre or tonne for differentiated products.
Tightening Active-Ingredient Bans and Residue Limits
The agrochemicals market is facing increasing regulatory pressure in Europe, where policy actions are restricting the use of several commercially important active ingredients. Recent regulations, including Commission Implementing Regulation (EU) 2025/910, have withdrawn approval for flufenacet and mandated the phased withdrawal of related authorizations, while Delegated Regulation 2024/3199 added more than 30 substances to export notification or ban status. These measures are not limited to Europe alone, as exporters supplying the EU must also comply with stricter residue standards, reducing the range of usable agrochemical products even in markets where the same active ingredients remain approved. As a result, agrochemical companies are facing increasing challenges in portfolio planning and product continuity, particularly those relying on mature chemistries with limited replacement pipelines. The tightening regulatory environment is increasing compliance costs, extending product transition timelines, and creating uncertainty around long-term commercialization strategies, ultimately slowing innovation and raising operational complexity across the global agrochemicals market.
Other drivers and restraints analyzed in the detailed report include:
- Controlled-Release and Inhibitor-Coated Fertilizers Adoption
- Carbon-Linked Monetization for Nitrogen-Efficiency Inputs
- Re-Registration and Data-Package Costs Rising
For complete list of drivers and restraints, kindly check the Table Of Contents.
Segment Analysis
Fertilizers accounted for nearly 75% of the agrochemicals market share in 2025, with nitrogen-based products such as urea, ammonium nitrate, and UAN solutions remaining essential for cereal production across Asia-Pacific and North America. Meanwhile, plant growth regulators are projected to register the fastest growth at a CAGR of 13.0%, driven by rising demand for solutions that enhance flowering synchronization and extend the shelf life of fruits and vegetables. Herbicides continue to hold a significant share of the pesticide segment, particularly in regions with stringent zero-residue regulations, while adjuvants are gaining strategic importance due to their ability to reduce spray rates while maintaining efficacy. Reflecting this trend, Corteva Agriscience's ProGibb, a gibberellin-based regulator, recorded high revenue growth in 2025.
The increasing phase-out of toxic active ingredients and growing preference for coated formulations are encouraging companies to integrate fertilizer and crop protection solutions. Manufacturers that offer both nutrient efficiency and pest control capabilities are strengthening relationships with channel partners and expanding market share through cross-selling. These trends are supporting profitability despite volatility in commodity fertilizer cycles, while companies demonstrating environmental performance through third-party validation are increasingly securing premium pricing, signaling a shift toward sustainability- and value-driven competition in the agrochemicals market.
Geography Analysis
Asia-Pacific accounted for 53% of the agrochemicals market in 2025 and is anticipated to expand at a CAGR of 6.6% through 2031. China continues to undergo structural consolidation, with the top 10 technical producers achieving a CR10 of 53% in 2025, while drone-based crop protection applications covered 34% of the country's total spray area in 2024. India also remains a key growth engine for the agrochemicals market, supported by a 7.3% year-on-year increase in fertilizer sales in FY2025 and record food production of 332 million metric tons. In 2025, Sumitomo Chemical India Limited commenced commercial production of CTPR (Chlorantraniliprole) at its Tarapur facility and secured approvals for the Excalia Max and Lentigo fungicides in India. In addition, ICL inaugurated its specialty fertilizer plant in Maharashtra in April 2026, while Coromandel International reported record quarterly NPK (Nitrogen, Phosphorus, and Potassium) production of 1.0 million metric tons in FY2026.
Africa agrochemicals market is driven by low fertilizer penetration and significant yield-improvement potential. Reflecting the region's rising strategic importance, PhosAgro increased fertilizer exports to Africa by one-third during H1 2025 and plans to further scale operations over the next five years. In South America, Brazil's fertilizer distribution increased significantly, while special fertilizer revenues also saw strong growth. EuroChem launched its phosphate fertilizer complex in Serra do Salitre in March 2025, and OCP Nutricrops expanded its international footprint through new subsidiaries in France and India. Meanwhile, North America is anticipated to witness steady growth, supported by chemistry upgrades, precision-application technologies, and low-carbon nitrogen programs rather than agricultural acreage expansion.
In North America, the agrochemicals market growth continues to be influenced by mature farming acreage and litigation-related pressures, although advances in digital agriculture platforms and carbon-credit programs are creating new service-oriented revenue streams for agrochemical companies. Europe is projected to experience comparatively slower growth due to stringent Farm to Fork pesticide-reduction targets; however, the region is emerging as a leader in low-carbon fertilizer adoption, supported by regulatory initiatives such as the Carbon Border Adjustment Mechanism (CBAM). At the same time, the Middle East is leveraging its cost-competitive natural gas reserves to strengthen ammonia production for exports while investing in blue and green ammonia projects to support long-term sustainability objectives. Collectively, these regional trends indicate that while Asia-Pacific remains the dominant agrochemicals market by overall sales, high-growth opportunities in Africa and South America are increasingly influencing global expansion and investment strategies.
- Syngenta Group
- Bayer AG
- BASF SE
- Corteva Agriscience
- Nutrien Ltd.
- Yara International ASA
- Mosaic Company
- CF Industries Holdings Inc.
- UPL Ltd.
- FMC Corporation
- Sumitomo Chemical Co., Ltd.
- Nufarm Ltd.
- K+S Aktiengesellschaft
- ICL Group
- OCP Group
Additional Benefits:
- The market estimate (ME) sheet in Excel format
- 3 months of analyst support
TABLE OF CONTENTS
1 Introduction
- 1.1 Study Assumptions and Market Definition
- 1.2 Scope of the Study
2 Research Methodology
3 Executive Summary
4 Market Landscape
- 4.1 Market Overview
- 4.2 Market Drivers
- 4.2.1 Rising herbicide-resistant weeds and resistant pathogen pressure
- 4.2.2 Precision agriculture and variable-rate application scaling
- 4.2.3 Controlled-release and inhibitor-coated fertilizers adoption
- 4.2.4 Carbon-linked monetization for nitrogen-efficiency inputs
- 4.2.5 Expanding access to off-patent active ingredients
- 4.2.6 High-value horticulture intensity lifts specialty input demand
- 4.3 Market Restraints
- 4.3.1 Tightening active-ingredient bans and residue limits
- 4.3.2 Re-registration and data-package costs rising
- 4.3.3 Price volatility in glyphosate and key feedstocks
- 4.3.4 Litigation exposure around legacy chemistries
- 4.4 Regulatory Landscape
- 4.5 Technological Outlook
- 4.6 Porter's Five Forces Analysis
- 4.6.1 Bargaining Power of Suppliers
- 4.6.2 Bargaining Power of Buyers
- 4.6.3 Threat of New Entrants
- 4.6.4 Threat of Substitutes
- 4.6.5 Intensity of Competitive Rivalry
5 Market Size and Growth Forecasts (Value, USD)
- 5.1 By Product Type
- 5.1.1 Fertilizers
- 5.1.1.1 Nitrogenous
- 5.1.1.2 Phosphatic
- 5.1.1.3 Potassic
- 5.1.1.4 Other Fertilizers
- 5.1.2 Pesticides
- 5.1.2.1 Herbicides
- 5.1.2.2 Insecticides
- 5.1.2.3 Fungicides
- 5.1.2.4 Other Pesticides
- 5.1.3 Adjuvants
- 5.1.4 Plant Growth Regulators
- 5.1.1 Fertilizers
- 5.2 By Crop Type
- 5.2.1 Grains and Cereals
- 5.2.2 Pulses and Oilseeds
- 5.2.3 Fruits and Vegetables
- 5.2.4 Commercial Crops
- 5.2.5 Turf and Ornamental
- 5.3 By Geography
- 5.3.1 North America
- 5.3.1.1 United States
- 5.3.1.2 Canada
- 5.3.1.3 Mexico
- 5.3.1.4 Rest of North America
- 5.3.2 Europe
- 5.3.2.1 Germany
- 5.3.2.2 France
- 5.3.2.3 United Kingdom
- 5.3.2.4 Italy
- 5.3.2.5 Spain
- 5.3.2.6 Russia
- 5.3.2.7 Rest of Europe
- 5.3.3 Asia-Pacific
- 5.3.3.1 China
- 5.3.3.2 India
- 5.3.3.3 Japan
- 5.3.3.4 Australia
- 5.3.3.5 Rest of Asia-Pacific
- 5.3.4 South America
- 5.3.4.1 Brazil
- 5.3.4.2 Argentina
- 5.3.4.3 Rest of South America
- 5.3.5 Middle East
- 5.3.5.1 Saudi Arabia
- 5.3.5.2 United Arab Emirates
- 5.3.5.3 Rest of Middle East
- 5.3.6 Africa
- 5.3.6.1 South Africa
- 5.3.6.2 Egypt
- 5.3.6.3 Rest of Africa
- 5.3.1 North America
6 Competitive Landscape
- 6.1 Market Concentration
- 6.2 Strategic Moves
- 6.3 Market Share Analysis
- 6.4 Company Profiles (Includes Global Level Overview, Market Level Overview, Core Segments, Financials as Available, Strategic Information, Market Rank/Share for Key Companies, Products and Services, and Recent Developments)
- 6.4.1 Syngenta Group
- 6.4.2 Bayer AG
- 6.4.3 BASF SE
- 6.4.4 Corteva Agriscience
- 6.4.5 Nutrien Ltd.
- 6.4.6 Yara International ASA
- 6.4.7 Mosaic Company
- 6.4.8 CF Industries Holdings Inc.
- 6.4.9 UPL Ltd.
- 6.4.10 FMC Corporation
- 6.4.11 Sumitomo Chemical Co., Ltd.
- 6.4.12 Nufarm Ltd.
- 6.4.13 K+S Aktiengesellschaft
- 6.4.14 ICL Group
- 6.4.15 OCP Group
7 Market Opportunities and Future Outlook

