
PUBLISHER: Mordor Intelligence | PRODUCT CODE: 2066476

PUBLISHER: Mordor Intelligence | PRODUCT CODE: 2066476
Fraud Detection and Prevention (FDP) - Market Share Analysis, Industry Trends & Statistics, Growth Forecasts (2026 - 2031)
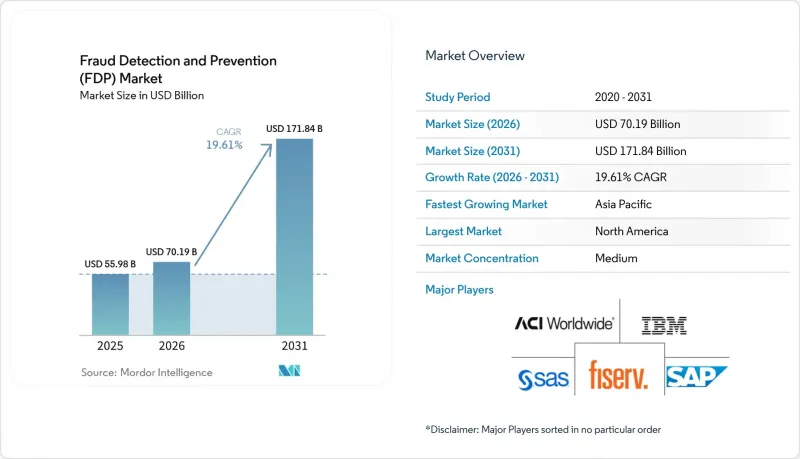
According to Mordor Intelligence, the fraud detection and prevention market size is expected to increase from USD 55.98 billion in 2025 to USD 70.19 billion in 2026 and reach USD 171.84 billion by 2031, growing at a CAGR of 19.61% over 2026-2031.
This report is Segmented by Component (Solutions, and Services), Deployment Mode (Cloud, and On-Premises), Organization Size (Small and Medium Enterprises, and Large Enterprises), End-User Industry (BFSI, Retail and E-Commerce, Healthcare, and More), and by Geography. The Market Forecasts are Provided in Terms of Value (USD).
Global Fraud Detection and Prevention (FDP) Market Trends and Insights
Rising Digital Payments And E-Commerce Transaction Volumes
Card-not-present transactions account for the majority of global fraud losses as consumers shift to online channels where physical security features are absent. The European Central Bank reported that card-not-present fraud accounted for 79% of total card fraud in 2024. India's Unified Payments Interface processed 16.73 billion transactions in December 2025 alone, a 45% year-over-year increase that strained batch-oriented legacy systems. Cross-border e-commerce complicates detection because region-specific risk patterns rarely generalize, compelling vendors to maintain localized models. Merchants are adopting passive biometrics to balance fraud control and customer friction, and payment facilitators aggregate network intelligence so even small sellers benefit from consortium-wide signals.
Stringent Regulatory Compliance For AML And PSD2 SCA
Successive rulemakings are mandating multi-factor authentication, continuous monitoring, and auditable workflows. The European Banking Authority's tightened Strong Customer Authentication exemptions in 2024 narrowed frictionless-payment thresholds, prompting issuers to deploy risk-based engines. Proposed Payment Services Directive 3, which is circulating in 2025, would extend liability for authorized push-payment fraud to sending banks, shifting detection to the initiation layer. In the United States, FinCEN's beneficial-ownership rule requires verification of control structures, driving interest in graph-database analytics. Multinational institutions must reconcile divergent data-residency obligations, leading to federated learning approaches that keep training data within national borders while sharing model weights.
High False-Positive Rates Undermining Customer Experience
Legacy rules still misclassify legitimate orders at double-digit rates, generating operational cost and lifetime-value erosion that sometimes exceed direct fraud losses. Manual reviews can cost USD 10-15 per flagged transaction, burdening merchants with thin margins. Behavioral biometrics that capture keystroke cadence and device-tilt angles promise to cut false positives below 3%, yet deployment lags because many consent frameworks treat continuous behavior capture as sensitive personal data. Cross-border orders suffer most, since unfamiliar IP geographies trip velocity checks, leading to cart abandonment and reputational damage.
Other drivers and restraints analyzed in the detailed report include:
- AI And Machine Learning Models Increasing Real-Time Detection Accuracy
- Tokenization And EMV 3-D Secure 2.3 Adoption Reducing Card-Not-Present Fraud
- Integration Complexity With Fragmented Legacy Core Systems
For complete list of drivers and restraints, kindly check the Table Of Contents.
Segment Analysis
The fraud detection and prevention market size for solutions reached its highest level in 2025, capturing 66.26% of platforms, authentication gateways, and reporting dashboards delivered rapid ROI. Yet services, including managed detection, model validation, and regulatory advisory, are expanding faster than packaged software. Institutions are learning that adaptive fraud defense is an ongoing process requiring weekly model refreshes and ever-evolving compliance mapping. Specialist consultancies now bundle data-science talent with SaaS dashboards so banks can outsource feature engineering without ceding strategic oversight. Reporting and visualization modules that once sat on the sidelines are gaining board-level attention because real-time exposure metrics influence capital-allocation decisions. Consolidation of fraud detection with identity verification blurs component boundaries, enabling unified risk scoring across the customer lifecycle.
Longer term, commoditization pressures solutions vendors to differentiate through proprietary data networks and low-latency inference. IBM's 2025 expansion of consumption-priced fraud detection as a service illustrates how pay-as-you-go models align costs with actual transaction risk. Workflow orchestration that prioritizes alerts based on financial risk and regulatory severity is becoming table stakes. Institutions now allocate 30-40% of their fraud-prevention budget to external services, reinforcing the shift from capex technology purchases to opex partnerships focused on measurable loss-reduction outcomes.
Cloud captured 63.82% of 2025 revenue, growing around 19.95% through 2031, as elastic compute lets fraud teams spin up GPU clusters for graph neural network training on demand. Real-time scaling means weekly model redeployments are complete without downtime, and security certifications from major hyperscalers satisfy most supervisory expectations. On-premises installations persist where data-sovereignty statutes prohibit cross-border transfer or where recent datacenter investments remain on depreciation schedules. Hybrid architectures, which score high-risk transactions locally while pooling de-identified aggregates in cloud data lakes, reconcile residency rules with machine-learning efficiency. The European Banking Authority clarified in 2024 that cloud outsourcing does not transfer accountability, giving risk committees confidence to migrate critical workloads.
Multi-cloud strategies gain traction among global banks keen to avoid single-vendor lock-in and to distribute compute across regions for resilience. Still, divergent toolchains complicate data synchronization, and model version drift can lead to inconsistent decisions across channels. Google Cloud's virtual-private-cloud deployment pattern, adopted by several mid-tier U.S. banks in late 2025, shows regulators can be convinced when customers retain encryption-key control.
Geography Analysis
North America generated 31.87% of global revenue in 2025 as high digital-payment penetration and robust compliance frameworks kept spending elevated. The U.S. Federal Trade Commission logged USD 10 billion in consumer fraud losses in 2023, reinforcing board-level urgency for improved controls. Real-time rails such as the Real-Time Rail in Canada and FedNow in the United States are shortening settlement windows, forcing banks to reduce model-scoring latency to sub-second levels. Regulatory scrutiny intensifies around third-party service providers, compelling financial institutions to audit vendor models for explainability and bias.
Asia-Pacific is the fastest-growing region, projected to post a 20.43% CAGR as India, China, Australia, and Japan modernize payments infrastructure. India's UPI handled 16.73 billion transactions in December 2025, catalyzing Reserve Bank mandates for additional authentication on high-ticket transfers RBI.ORG.IN. China's digital-yuan pilots expand cashless ecosystems to rural counties, adding novel fraud vectors such as identity spoofing in offline wallets. Japan's revised AML guidelines emphasize continuous monitoring over rule-based checks, stimulating demand for AI platforms such as. Australia's New Payments Platform processed 1.2 billion instant transfers in 2024, exposing gaps in fraud-analytics stacks built for batch ACH files.
Europe maintains significant share on the strength of PSD2 Strong Customer Authentication mandates, yet card-not-present losses still reached EUR 4.2 billion (USD 4.5 billion) in 2024. Fragmented interpretations across 27 member states complicate multinational rollouts, prompting banks to deploy configurable policy engines capable of local overrides. South America gains momentum as Brazil's Pix clocked 42 billion transactions in 2024, leading the Central Bank to impose transaction caps and nightly cooling-off periods. The Middle East and Africa regions accelerate adoption of mobile-money fraud analytics to protect unbanked populations joining digital ecosystems.
- SAP SE
- IBM Corporation
- SAS Institute Inc.
- ACI Worldwide Inc.
- Fiserv Inc.
- Experian PLC
- DXC Technology Company
- BAE Systems PLC
- RSA Security LLC (Dell Technologies)
- Oracle Corporation
- NICE Ltd
- Equifax Inc.
- LexisNexis Risk Solutions
- Fair Isaac Corporation (FICO)
- Cybersource Corporation (Visa)
- Global Payments Inc.
- Feedzai SA
- Signifyd Inc.
- Riskified Ltd.
- Kount Inc.
Additional Benefits:
- The market estimate (ME) sheet in Excel format
- 3 months of analyst support
TABLE OF CONTENTS
1 INTRODUCTION
- 1.1 Study Assumptions and Market Definition
- 1.2 Scope of the Study
2 RESEARCH METHODOLOGY
3 EXECUTIVE SUMMARY
4 MARKET LANDSCAPE
- 4.1 Market Overview
- 4.2 Market Drivers
- 4.2.1 Rising Digital Payments and E-Commerce Transaction Volumes
- 4.2.2 Stringent Regulatory Compliance for AML and PSD2 SCA
- 4.2.3 AI and Machine Learning Models Increasing Real-Time Detection Accuracy
- 4.2.4 Tokenization and EMV 3-D Secure 2.3 Adoption Reducing Card-Not-Present Fraud
- 4.2.5 Proliferation of Open Banking and Instant-Payment Rails Creating New Fraud Vectors
- 4.2.6 Generative AI Deepfake and Synthetic Identity Attacks Pushing Adaptive FDP Investments
- 4.3 Market Restraints
- 4.3.1 High False-Positive Rates Undermining Customer Experience
- 4.3.2 Integration Complexity with Fragmented Legacy Core Systems
- 4.3.3 Scarcity of Labeled Fraud Datasets for Advanced ML Training
- 4.3.4 Data-Sharing Constraints Imposed by GDPR and CCPA
- 4.4 Industry Value Chain Analysis
- 4.5 Regulatory Landscape
- 4.6 Technological Outlook
- 4.7 Porter's Five Forces Analysis
- 4.7.1 Bargaining Power of Suppliers
- 4.7.2 Bargaining Power of Buyers
- 4.7.3 Threat of New Entrants
- 4.7.4 Threat of Substitutes
- 4.7.5 Intensity of Competitive Rivalry
- 4.8 Impact of Macroeconomic Factors on the Market
5 MARKET SIZE AND GROWTH FORECASTS (VALUE)
- 5.1 By Component
- 5.1.1 Solutions
- 5.1.1.1 Fraud Analytics
- 5.1.1.2 Authentication
- 5.1.1.3 Reporting
- 5.1.1.4 Visualization
- 5.1.1.5 Other Components
- 5.1.2 Services
- 5.1.1 Solutions
- 5.2 By Deployment Mode
- 5.2.1 Cloud
- 5.2.2 On-premises
- 5.3 By Organization Size
- 5.3.1 Small and Medium Enterprises
- 5.3.2 Large Enterprises
- 5.4 By End-user Industry
- 5.4.1 BFSI
- 5.4.2 Retail and E-Commerce
- 5.4.3 IT and Telecom
- 5.4.4 Healthcare
- 5.4.5 Energy and Utilities
- 5.4.6 Manufacturing
- 5.4.7 Government and Public Sector
- 5.4.8 Other End-user Industries
- 5.5 By Geography
- 5.5.1 North America
- 5.5.1.1 United States
- 5.5.1.2 Canada
- 5.5.1.3 Mexico
- 5.5.2 South America
- 5.5.2.1 Brazil
- 5.5.2.2 Argentina
- 5.5.2.3 Rest of South America
- 5.5.3 Europe
- 5.5.3.1 United Kingdom
- 5.5.3.2 Germany
- 5.5.3.3 France
- 5.5.3.4 Italy
- 5.5.3.5 Spain
- 5.5.3.6 Rest of Europe
- 5.5.4 Asia-Pacific
- 5.5.4.1 China
- 5.5.4.2 Japan
- 5.5.4.3 South Korea
- 5.5.4.4 India
- 5.5.4.5 Australia
- 5.5.4.6 Rest of Asia-Pacific
- 5.5.5 Middle East
- 5.5.5.1 Saudi Arabia
- 5.5.5.2 United Arab Emirates
- 5.5.5.3 Turkey
- 5.5.5.4 Rest of Middle East
- 5.5.6 Africa
- 5.5.6.1 South Africa
- 5.5.6.2 Nigeria
- 5.5.6.3 Egypt
- 5.5.6.4 Rest of Africa
- 5.5.1 North America
6 COMPETITIVE LANDSCAPE
- 6.1 Market Concentration
- 6.2 Strategic Moves
- 6.3 Market Share Analysis
- 6.4 Company Profiles (includes Global Level Overview, Market Level Overview, Core Segments, Financials as available, Strategic Information, Market Rank/Share, Products and Services, Recent Developments)
- 6.4.1 SAP SE
- 6.4.2 IBM Corporation
- 6.4.3 SAS Institute Inc.
- 6.4.4 ACI Worldwide Inc.
- 6.4.5 Fiserv Inc.
- 6.4.6 Experian PLC
- 6.4.7 DXC Technology Company
- 6.4.8 BAE Systems PLC
- 6.4.9 RSA Security LLC (Dell Technologies)
- 6.4.10 Oracle Corporation
- 6.4.11 NICE Ltd
- 6.4.12 Equifax Inc.
- 6.4.13 LexisNexis Risk Solutions
- 6.4.14 Fair Isaac Corporation (FICO)
- 6.4.15 Cybersource Corporation (Visa)
- 6.4.16 Global Payments Inc.
- 6.4.17 Feedzai SA
- 6.4.18 Signifyd Inc.
- 6.4.19 Riskified Ltd.
- 6.4.20 Kount Inc.
7 MARKET OPPORTUNITIES AND FUTURE OUTLOOK
- 7.1 White-Space and Unmet-Need Assessment

