
PUBLISHER: Mordor Intelligence | PRODUCT CODE: 2066546

PUBLISHER: Mordor Intelligence | PRODUCT CODE: 2066546
Urban Air Mobility (UAM) - Market Share Analysis, Industry Trends & Statistics, Growth Forecasts (2026 - 2040)
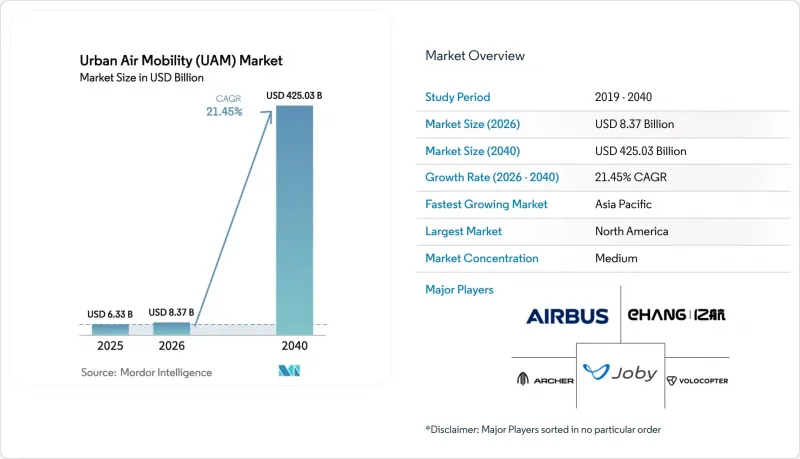
According to Mordor Intelligence, the urban air mobility (UAM) market size is expected to grow from USD 6.33 billion in 2025 to USD 8.37 billion in 2026, and is forecast to reach USD 425.03 billion by 2040 at a projected CAGR of 119.34%.
This report is Segmented by Vehicle Type (Piloted and Autonomous), Range (Intracity and Intercity), Propulsion Type (Fully Electric, Hybrid Electric, and Gasoline), Application (Passenger Air Taxi, Intra-City Shuttle, and More), End User (Ride-Sharing Operators, and More), and Geography (North America, Europe, Asia-Pacific, and More). The Market Forecasts are Provided in Terms of Value (USD).
Global Urban Air Mobility (UAM) Market Trends and Insights
Rapid Battery-Energy-Density Gains Push eVTOL Range Beyond 150 km
Solid-state and lithium-metal cells exceeded 400 Wh/kg in 2024, lifting eVTOL cruise range past 150 km with a 20% reserve that satisfies diversion rules.[1] Joby Aviation flight-tested 161 km with four passengers in 2025, validating intercity links such as Los Angeles-San Diego and Tokyo-Osaka. Higher energy density also reduces the weight of cooling hardware, allowing designers to add redundant controls that expedite certification. Toyota now builds high-precision modules for Joby, holding cell variance below 2%. As densities approach 500 Wh/kg by 2028, island-hopping and offshore-platform logistics become viable, widening the urban air mobility (UAM) market beyond dense urban cores.
Automotive-Grade Supply Chains Drive Down eVTOL Unit Costs
Automotive tier-1 suppliers achieve 1-minute takt times, automated resin-transfer molding, and just-in-time logistics, which slash production costs by 30-40%. Archer's Stellantis partnership aims to achieve a USD 2 million price per aircraft by 2026, down from USD 3.5 million for hand-built prototypes. Bosch and ZF are adapting EV inverters for aviation qualification, earning multi-year volume commitments that stabilize tooling outlays. Cycle times for composite fuselages have decreased from 72 hours to 8 hours, resulting in scrap trimming below 3%. By 2027, 60% of component value is expected to come from auto-sector suppliers, transforming procurement strategies across the urban air mobility (UAM) market.
Slow Vertiport Permitting in Tier-1 Cities
Municipal processes can add 18-36 months to construction as zoning boards weigh heritage site lines, helicopter operator objections, and environmental reviews. New York's Downtown vertiport required 14 public hearings before a 2026 opening. London rejected a Thames-side proposal in 2025 over visual-impact concerns. Los Angeles restricts sites within 1,500 ft of residences, pushing vertiports to industrial land that undermines door-to-door time savings. Tokyo mandates noise-easement agreements with adjacent owners, often taking more than two years. By contrast, Dubai and NEOM fast-tracked approvals in under six months, highlighting a competitive divergence that could shift early urban air mobility (UAM) market revenue away from traditional megacities.
Other drivers and restraints analyzed in the detailed report include:
- Vertiport PPP Financing Models Unlock Infrastructure Rollout
- Regulatory "Sandbox" Corridors Accelerate Certification Timelines
- Public-Acceptance Headwinds on Noise and Visual Pollution
For complete list of drivers and restraints, kindly check the Table Of Contents.
Segment Analysis
Autonomous designs are projected to grow at a 112.25% CAGR, whereas piloted configurations held 62.56% of the 2026 urban air mobility (UAM) market share. Wisk's Generation 6 became the first autonomous passenger aircraft to enter FAA type-certification review in 2025, backed by 10,000 hours of simulation data. EHang's EH216-S secured a production certificate in China, completing 40,000 incident-free flights by 2025.
Regulatory convergence remains the swing factor. FAA draft guidance requires triple-redundant controls, adding 12-18 months compared to piloted variants, yet achieving lower direct operating costs, roughly 40% below those of piloted fleets, keeping autonomy central to long-term profitability in the urban air mobility (UAM) market. Public confidence programs, including voluntary safety reporting portals and the sharing of transparent flight data, aim to accelerate the acceptance of these measures.
Intracity missions under 100 km captured 59.71% of 2026 demand, supported by batteries designed for 25- to 35-minute blocks with 20% reserves. Archer's Midnight optimizes for 32 km airport shuttles, delivering 12-minute trips that replace 45-minute drives. Tokyo's plan to embed vertiports in rail hubs will support 10-minute headways, thereby amortizing fixed costs.
Intercity growth hinges on hybrid powertrains and solid-state cells. Eve targets a 150 km range using a turbine range-extender, enabling Sao Paulo-Campinas corridors where ground travel exceeds two hours. Regulatory work on low-altitude IFR lanes will further open intercity opportunities in the urban air mobility (UAM) market.
Geography Analysis
North America led with 49.78% of the 2026 market value. The FAA's Advanced Air Mobility Implementation Plan created test corridors across eight states, allowing Joby to secure a Part 135 certificate in 2024. Private developers have earmarked USD 1.2 billion for vertiports in Dallas, Miami, and San Francisco. At the same time, Transport Canada has approved Eve's Ontario factory, which will supply the regional urban air mobility (UAM) market.
The Asia-Pacific region is projected to grow at a 93.57% CAGR from 2026 to 2040, driven by China's USD 14 billion low-altitude economy fund and Japan's demonstration flights for the 2025 Osaka Expo. South Korea's USD 384 million Grand Challenge invests in Seoul's vertiports, and India's draft regulations outline tourism routes between Delhi and Agra.
Europe benefits from EASA's harmonized SC-VTOL rule set; however, community concerns have postponed commercial service in Paris and Munich until 2027. The Middle East accelerates through sovereign-fund backing, as Dubai granted a 25-year concession to Skyports and NEOM ordered 100 Volocopters. Latin American growth centers on Brazil, where Embraer's partnership with Eve amassed 2,900 orders awaiting ANAC clearance. These regional dynamics collectively shape demand distribution in the urban air mobility (UAM) market.
- Airbus SE
- Joby Aviation, Inc.
- Eve Holding, Inc.
- Volocopter GmbH (Diamond Aircraft Industries GmbH)
- Vertical Aerospace
- Archer Aviation Inc.
- BETA Technologies, Inc.
- Wisk Aero LLC
- Guangzhou EHang Intelligent Technology Co., Ltd.
- Supernal, LLC
- Textron, Inc.
- Jaunt Air Mobility LLC
- Pivotal Aero, LLC.
- Ascendance Flight Technologies S.A.S
- AutoFlight Co. Ltd.
- SkyDrive Inc.
Additional Benefits:
- The market estimate (ME) sheet in Excel format
- 3 months of analyst support
TABLE OF CONTENTS
1 INTRODUCTION
- 1.1 Study Assumptions and Market Definition
- 1.2 Scope of the Study
2 RESEARCH METHODOLOGY
3 EXECUTIVE SUMMARY
4 MARKET LANDSCAPE
- 4.1 Market Overview
- 4.2 Market Drivers
- 4.2.1 Rapid battery-energy-density gains push eVTOL range beyond 150 km
- 4.2.2 Automotive-grade supply chains drive down eVTOL unit costs
- 4.2.3 Vertiport PPP financing models unlock infrastructure rollout
- 4.2.4 Regulatory "sandbox" corridors accelerate certification timelines
- 4.2.5 Premium airport-shuttle demand from mega-hub expansions
- 4.2.6 AI-enabled UTM platforms de-risk high-density airspace operations
- 4.3 Market Restraints
- 4.3.1 Slow vertiport permitting in tier-1 cities
- 4.3.2 Public-acceptance headwinds on noise and visual pollution
- 4.3.3 Battery raw-material price volatility
- 4.3.4 Pilot-shortage bottleneck before full autonomy
- 4.4 Value Chain Analysis
- 4.5 Regulatory Outlook
- 4.6 Technological Outlook
- 4.7 Porter's Five Forces Analysis
- 4.7.1 Bargaining Power of Buyers
- 4.7.2 Bargaining Power of Suppliers
- 4.7.3 Threat of New Entrants
- 4.7.4 Threat of Substitutes
- 4.7.5 Intensity of Competitive Rivalry
5 MARKET SIZE AND GROWTH FORECASTS (VALUE)
- 5.1 By Vehicle Type
- 5.1.1 Piloted
- 5.1.2 Autonomous
- 5.2 By Range
- 5.2.1 Intracity (Less than 100 km)
- 5.2.2 Intercity (Greater than 100 km)
- 5.3 By Propulsion Type
- 5.3.1 Fully Electric
- 5.3.2 Hybrid Electric
- 5.3.3 Gasoline
- 5.4 By Application
- 5.4.1 Passenger Air Taxi
- 5.4.2 Intra-city Shuttle
- 5.4.3 Emergency Medical Services (EMS)
- 5.4.4 Cargo and Logistics
- 5.5 By End User
- 5.5.1 Ride-Sharing Operators
- 5.5.2 Corporate and VIP Clients
- 5.5.3 E-commerce and Logistics Firms
- 5.5.4 Healthcare Providers
- 5.5.5 Military and Government Agencies
- 5.6 By Geography
- 5.6.1 North America
- 5.6.1.1 United States
- 5.6.1.2 Canada
- 5.6.1.3 Mexico
- 5.6.2 Europe
- 5.6.2.1 United Kingdom
- 5.6.2.2 France
- 5.6.2.3 Germany
- 5.6.2.4 Italy
- 5.6.2.5 Spain
- 5.6.2.6 Rest of Europe
- 5.6.3 Asia-Pacific
- 5.6.3.1 China
- 5.6.3.2 India
- 5.6.3.3 Japan
- 5.6.3.4 South Korea
- 5.6.3.5 Australia
- 5.6.3.6 Rest of Asia-Pacific
- 5.6.4 South America
- 5.6.4.1 Brazil
- 5.6.4.2 Rest of South America
- 5.6.5 Middle East and Africa
- 5.6.5.1 Middle East
- 5.6.5.1.1 United Arab Emirates
- 5.6.5.1.2 Saudi Arabia
- 5.6.5.1.3 Turkey
- 5.6.5.1.4 Rest of Middle East
- 5.6.5.2 Africa
- 5.6.5.2.1 South Africa
- 5.6.5.2.2 Rest of Africa
- 5.6.5.1 Middle East
- 5.6.1 North America
6 COMPETITIVE LANDSCAPE
- 6.1 Market Concentration
- 6.2 Strategic Moves
- 6.3 Market Share Analysis
- 6.4 Company Profiles (includes Global-level Overview, Market-level Overview, Core Segments, Financials, Strategic Information, Market Rank/Share, Products and Services, Recent Developments)
- 6.4.1 Airbus SE
- 6.4.2 Joby Aviation, Inc.
- 6.4.3 Eve Holding, Inc.
- 6.4.4 Volocopter GmbH (Diamond Aircraft Industries GmbH)
- 6.4.5 Vertical Aerospace
- 6.4.6 Archer Aviation Inc.
- 6.4.7 BETA Technologies, Inc.
- 6.4.8 Wisk Aero LLC
- 6.4.9 Guangzhou EHang Intelligent Technology Co., Ltd.
- 6.4.10 Supernal, LLC
- 6.4.11 Textron, Inc.
- 6.4.12 Jaunt Air Mobility LLC
- 6.4.13 Pivotal Aero, LLC.
- 6.4.14 Ascendance Flight Technologies S.A.S
- 6.4.15 AutoFlight Co. Ltd.
- 6.4.16 SkyDrive Inc.
7 MARKET OPPORTUNITIES AND FUTURE OUTLOOK
- 7.1 White-Space and Unmet-Need Assessment

