
PUBLISHER: Roots Analysis | PRODUCT CODE: 2015367

PUBLISHER: Roots Analysis | PRODUCT CODE: 2015367
Urban Air Mobility Market, Till 2040: Industry Trends and Global Forecasts
Urban Air Mobility Market Outlook
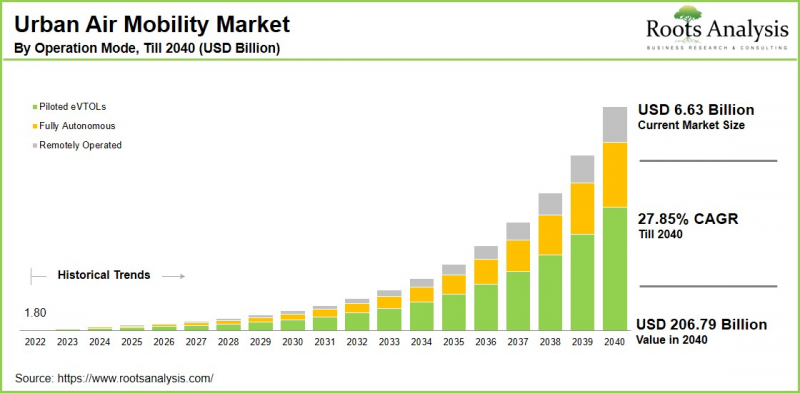
As per Roots Analysis, the global urban air mobility market size is estimated to grow from USD 6.63 billion in current year to USD 206.79 billion by 2040, at a CAGR of 27.85% during the forecast period, till 2040.
Urban Air Mobility (UAM) refers to a next-generation transportation framework that enables on-demand and highly automated aerial transport of passengers and cargo within densely populated environments. This concept primarily relies on electric vertical takeoff and landing (eVTOL) aircraft, which are designed to operate safely above conventional ground infrastructure. By leveraging vertical airspace as an additional mobility layer, UAM aims to complement existing transportation systems, thereby facilitating efficient, city-scale aerial travel.
The potential applications of UAM are diverse, ranging from passenger commuting through air taxis to reduce urban congestion, to rapid cargo delivery for time-sensitive logistics. Additional use cases include emergency medical evacuations, organ transport, public safety monitoring, and disaster response operations. The growth of the UAM ecosystem is being driven by accelerating urbanization and rising traffic congestion, alongside technological advancements such as autonomous flight systems, intelligent air traffic management, and improved battery performance. In addition, ongoing regulatory developments and innovations in energy storage are expected to further support the scalable integration of UAM within future urban mobility ecosystems.
Strategic Insights for Senior Leaders
Key Drivers Propelling Growth of Urban Air Mobility Market
The growth of the urban air mobility market is being driven by increasing urban congestion and the rising demand for faster and more efficient transportation solutions. Rapid urbanization and persistent traffic bottlenecks in major cities have accelerated interest in electric vertical takeoff and landing (eVTOL) aircraft. This enables direct aerial routes for swift intra-city and short-haul travel while bypassing limitations associated with ground-based infrastructure. At the same time, technological advancements in electric propulsion systems, high-energy-density batteries, and artificial intelligence-driven autonomous flight capabilities are significantly improving the feasibility, and cost-effectiveness of eVTOL platforms.
In addition, strong investments from private investors and government bodies have further accelerated research and development activities, vertiport infrastructure deployment, and pilot programs across key regions. Collectively, these factors are contributing to the rapid evolution and commercialization of the urban air mobility ecosystem.
Urban Air Mobility Market: Competitive Landscape of Companies in this Industry
The urban air mobility (UAM) market is characterized by the presence of several innovative companies that are actively advancing eVTOL technologies and supporting the commercialization of aerial mobility solutions. Joby Aviation has emerged as a leading player with its advanced aircraft designs and strategic partnerships aimed at securing regulatory approvals and establishing scalable urban air taxi networks.
Volocopter is focused on autonomous multicopter technology designed for seamless integration into urban environments, with particular emphasis on low-noise operations and the development of supporting vertiport and skyport infrastructure. Meanwhile, Archer Aviation is strengthening its competitive position through rapid prototyping and collaborations with major airlines. Collectively, these companies are shaping the competitive UAM landscape through continuous technological innovation, strategic collaborations, and proactive engagement to accelerate large-scale commercial deployment.
Regulatory Frameworks for Safe Urban Air Mobility Deployment
The development of urban air mobility (UAM) services is being supported by evolving regulatory frameworks and advanced airspace management initiatives led by global aviation authorities. The European Union Aviation Safety Agency (EASA) has introduced the U-Space regulatory package to enable high-density drone and eVTOL operations through digital services.
In the United States, the Federal Aviation Administration (FAA) has outlined a UAM Concept of Operations that supports safe integration of aerial mobility services into the National Airspace System. Meanwhile, AI-driven urban traffic management systems are being developed to coordinate low-altitude airspace using real-time data on weather, traffic, and restricted zones to optimize routes and avoid conflicts. At the international level, the International Civil Aviation Organization (ICAO) is promoting standardized frameworks to ensure regulatory harmonization and interoperability across regions. In addition, regulatory efforts focus on vertiport infrastructure and performance-based standards addressing safety, noise mitigation, cybersecurity, and scalability to support large-scale UAM deployment in urban environments.
Regional Analysis: North America Lead the Urban Air Mobility Market
According to our analysis, in the current year, the urban air mobility market in North America captures the largest share. This can be attributed to a well-established aerospace ecosystem supported by prominent manufacturers such as Boeing and Joby Aviation, along with substantial research and development investments driven by public-private partnerships. In addition, proactive regulatory engagement by the Federal Aviation Administration has accelerated certification processes and pilot programs for emerging aerial mobility technologies. The region also benefits from significant urban congestion in major metropolitan areas, which is increasing the demand for alternative transportation solutions such as air taxis.
Key Challenges in Urban Air Mobility Market
The widespread adoption of urban air mobility (UAM) services is influenced by several operational, regulatory, and market-related challenges. Public acceptance remains a critical factor, particularly concerning safety challenges associated with flights over densely populated urban areas. Issues related to noise pollution, privacy, and apprehension toward autonomous flight technologies can limit public confidence. This highlights the need for transparent communication, robust safety standards, and clearly defined regulatory frameworks to build trust among communities.
In addition, the development of essential ground infrastructure, such as vertiports, presents significant challenges in densely populated cities due to limited land availability, strict zoning regulations, and the requirement to mitigate environmental and noise impacts. Ensuring seamless integration of vertiports with existing transportation networks is also essential to enable efficient multimodal connectivity and enhance user convenience.
Urban Air Mobility Market: Key Market Segmentation
Market Share by Component
- Hardware
- Services
- Software
Market Share by Vehicle Type
- Air Ambulance & Medical Emergency Vehicles
- Air Metro
- Air Shuttle
- Air Taxis
- Cargo Air Vehicles
- Last-mile Delivery Vehicles
- Personal Air Vehicles
Market Share by Platform Architecture
- Fixed Wing
- Hybrid
- Rotory Wing
Market Share by Operation Mode
- Fully Autonomous
- Piloted eVTOLs
- Remotely Operated
Market Share by Propulsion Type
- Electric
- Hybrid-Electric
- Hydrogen Fuel Cell
- Others
Market Share by Maximum Take-off Weight
- <100 kg
- 100-300 kg
- >300 kg
Market Share by Range
- Intercity (50-200 km)
- Intracity (<50 km)
- Long Range (>200 km)
Market Share by Infrastructure
- Air Traffic Control System
- Charging Stations
- Maintenance
- Repair & Overhaul
- Vertiports
- Others
Market Share by End User
- E-Commerce Companies
- Hospitals
- Ridesharing Companies
- Medical Agencies
- Private Operators
- Scheduled Operators
Market Share by Geographical Regions
- North America
- US
- Canada
- Mexico
- Rest of North America
- Europe
- Austria
- Belgium
- Denmark
- France
- Germany
- Ireland
- Italy
- Netherlands
- Norway
- Russia
- Spain
- Sweden
- Switzerland
- UK
- Rest of Europe
- Asia-Pacific
- Australia
- China
- India
- Japan
- New-Zealand
- Singapore
- South Korea
- Rest of Asia-Pacific
- Latin America
- Brazil
- Chile
- Colombia
- Venezuela
- Rest of Latin America
- Middle East and Africa (MEA)
- Egypt
- Iran
- Iraq
- Israel
- Kuwait
- Saudi Arabia
- UAE
- Rest of MEA
Example Players in Urban Air Mobility Market
- Airbus
- Archer Aviation
- BETA Technologies
- Ehang Holdings
- Elroy Air
- Eve Air Mobility
- Joby Aviation
- Lilium
- Pipistrel
- Vertical Aerospace
- Volocopter
- Wisk Aero
Urban Air Mobility Market: Report Coverage
The report on the urban air mobility market features insights on various sections, including:
- Market Sizing and Opportunity Analysis: An in-depth analysis of the urban air mobility market, focusing on key market segments, including [A] component, [B] vehicle type, [C] platform architecture, [D] operation mode, [E] propulsion type, [F] maximum take-off weight, [G] range, [H] infrastructure, [I] end user, [J] geographical regions, and [K] key players.
- Competitive Landscape: A comprehensive analysis of the companies engaged in the urban air mobility market, based on several relevant parameters, such as [A] year of establishment, [B] company size, [C] location of headquarters and [D] ownership structure.
- Company Profiles: Elaborate profiles of prominent players engaged in the urban air mobility market, providing details on [A] location of headquarters, [B] company size, [C] company mission, [D] company footprint, [E] management team, [F] contact details, [G] financial information, [H] operating business segments, [I] product / technology portfolio, [J] recent developments, and an informed future outlook.
- Megatrends: An evaluation of ongoing megatrends in the urban air mobility industry.
- Patent Analysis: An insightful analysis of patents filed / granted in the urban air mobility domain, based on relevant parameters, including [A] type of patent, [B] patent publication year, [C] patent age and [D] leading players.
- Recent Developments: An overview of the recent developments made in the urban air mobility market, along with analysis based on relevant parameters, including [A] year of initiative, [B] type of initiative, [C] geographical distribution and [D] most active players.
- Porter's Five Forces Analysis: An analysis of five competitive forces prevailing in the urban air mobility market, including threats of new entrants, bargaining power of buyers, bargaining power of suppliers, threats of substitute products and rivalry among existing competitors.
- SWOT Analysis: An insightful SWOT framework, highlighting the strengths, weaknesses, opportunities and threats in the domain. Additionally, it provides Harvey ball analysis, highlighting the relative impact of each SWOT parameter.
Key Questions Answered in this Report
- What is the current and future market size?
- Who are the leading companies in this market?
- What are the growth drivers that are likely to influence the evolution of this market?
- What are the key partnership and funding trends shaping this industry?
- Which region is likely to grow at higher CAGR till 2040?
- How is the current and future market opportunity likely to be distributed across key market segments?
Reasons to Buy this Report
- Detailed Market Analysis: The report provides a comprehensive market analysis, offering detailed revenue projections of the overall market and its specific sub-segments. This information is valuable to both established market leaders and emerging entrants.
- In-depth Analysis of Trends: Stakeholders can leverage the report to gain a deeper understanding of the competitive dynamics within the market. Each report maps ecosystem activity across partnerships, funding, and patent landscapes to reveal growth hotspots and white spaces in the industry.
- Opinion of Industry Experts: The report features extensive interviews and surveys with key opinion leaders and industry experts to validate market trends mentioned in the report.
- Decision-ready Deliverables: The report offers stakeholders with strategic frameworks (Porter's Five Forces, value chain, SWOT), and complimentary Excel / slide packs with customization support.
Additional Benefits
- Complimentary Dynamic Excel Dashboards for Analytical Modules
- Exclusive 15% Free Content Customization
- Personalized Interactive Report Walkthrough with Our Expert Research Team
- Free Report Updates for Versions Older than 6-12 Months
TABLE OF CONTENTS
1. PROJECT OVERVIEW
- 1.1. Context
- 1.2. Project Objectives
2. RESEARCH METHODOLOGY
- 2.1. Chapter Overview
- 2.2. Research Assumptions
- 2.3. Database Building
- 2.3.1. Data Collection
- 2.3.2. Data Validation
- 2.3.3. Data Analysis
- 2.4. Project Methodology
- 2.4.1. Secondary Research
- 2.4.1.1. Annual Reports
- 2.4.1.2. Academic Research Papers
- 2.4.1.3. Company Websites
- 2.4.1.4. Investor Presentations
- 2.4.1.5. Regulatory Filings
- 2.4.1.6. White Papers
- 2.4.1.7. Industry Publications
- 2.4.1.8. Conferences and Seminars
- 2.4.1.9. Government Portals
- 2.4.1.10. Media and Press Releases
- 2.4.1.11. Newsletters
- 2.4.1.12. Industry Databases
- 2.4.1.13. Roots Proprietary Databases
- 2.4.1.14. Paid Databases and Sources
- 2.4.1.15. Social Media Portals
- 2.4.1.16. Other Secondary Sources
- 2.4.2. Primary Research
- 2.4.2.1. Introduction
- 2.4.2.2. Types
- 2.4.2.2.1. Qualitative
- 2.4.2.2.2. Quantitative
- 2.4.2.3. Advantages
- 2.4.2.4. Techniques
- 2.4.2.4.1. Interviews
- 2.4.2.4.2. Surveys
- 2.4.2.4.3. Focus Groups
- 2.4.2.4.4. Observational Research
- 2.4.2.4.5. Social Media Interactions
- 2.4.2.5. Stakeholders
- 2.4.2.5.1. Company Executives (CXOs)
- 2.4.2.5.2. Board of Directors
- 2.4.2.5.3. Company Presidents and Vice Presidents
- 2.4.2.5.4. Key Opinion Leaders
- 2.4.2.5.5. Research and Development Heads
- 2.4.2.5.6. Technical Experts
- 2.4.2.5.7. Subject Matter Experts
- 2.4.2.5.8. Scientists
- 2.4.2.5.9. Doctors and Other Healthcare Providers
- 2.4.2.6. Ethics and Integrity
- 2.4.2.6.1. Research Ethics
- 2.4.2.6.2. Data Integrity
- 2.4.3. Analytical Tools and Databases
- 2.4.1. Secondary Research
3. MARKET DYNAMICS
- 3.1. Forecast Methodology
- 3.1.1. Top-Down Approach
- 3.1.2. Bottom-Up Approach
- 3.1.3. Hybrid Approach
- 3.2. Market Assessment Framework
- 3.2.1. Total Addressable Market (TAM)
- 3.2.2. Serviceable Addressable Market (SAM)
- 3.2.3. Serviceable Obtainable Market (SOM)
- 3.2.4. Currently Acquired Market (CAM)
- 3.3. Forecasting Tools and Techniques
- 3.3.1. Qualitative Forecasting
- 3.3.2. Correlation
- 3.3.3. Regression
- 3.3.4. Time Series Analysis
- 3.3.5. Extrapolation
- 3.3.6. Convergence
- 3.3.7. Forecast Error Analysis
- 3.3.8. Data Visualization
- 3.3.9. Scenario Planning
- 3.3.10. Sensitivity Analysis
- 3.4. Key Considerations
- 3.4.1. Demographics
- 3.4.2. Market Access
- 3.4.3. Reimbursement Scenarios
- 3.4.4. Industry Consolidation
- 3.5. Robust Quality Control
- 3.6. Key Market Segmentations
- 3.7. Limitations
4. MACRO-ECONOMIC INDICATORS
- 4.1. Chapter Overview
- 4.2. Market Dynamics
- 4.2.1. Time Period
- 4.2.1.1. Historical Trends
- 4.2.1.2. Current and Forecasted Estimates
- 4.2.2. Currency Coverage
- 4.2.2.1. Overview of Major Currencies Affecting the Market
- 4.2.2.2. Impact of Currency Fluctuations on the Industry
- 4.2.3. Foreign Exchange Impact
- 4.2.3.1. Evaluation of Foreign Exchange Rates and Their Impact on Market
- 4.2.3.2. Strategies for Mitigating Foreign Exchange Risk
- 4.2.4. Recession
- 4.2.4.1. Historical Analysis of Past Recessions and Lessons Learnt
- 4.2.4.2. Assessment of Current Economic Conditions and Potential Impact on the Market
- 4.2.5. Inflation
- 4.2.5.1. Measurement and Analysis of Inflationary Pressures in the Economy
- 4.2.5.2. Potential Impact of Inflation on the Market Evolution
- 4.2.6. Interest Rates
- 4.2.6.1. Overview of Interest Rates and Their Impact on the Market
- 4.2.6.2. Strategies for Managing Interest Rate Risk
- 4.2.7. Commodity Flow Analysis
- 4.2.7.1. Type of Commodity
- 4.2.7.2. Origins and Destinations
- 4.2.7.3. Values and Weights
- 4.2.7.4. Modes of Transportation
- 4.2.8. Global Trade Dynamics
- 4.2.8.1. Import Scenario
- 4.2.8.2. Export Scenario
- 4.2.9. War Impact Analysis
- 4.2.9.1. Russian-Ukraine War
- 4.2.9.2. Israel-Hamas War
- 4.2.10. COVID Impact / Related Factors
- 4.2.10.1. Global Economic Impact
- 4.2.10.2. Industry-specific Impact
- 4.2.10.3. Government Response and Stimulus Measures
- 4.2.10.4. Future Outlook and Adaptation Strategies
- 4.2.11. Other Indicators
- 4.2.11.1. Fiscal Policy
- 4.2.11.2. Consumer Spending
- 4.2.11.3. Gross Domestic Product (GDP)
- 4.2.11.4. Employment
- 4.2.11.5. Taxes
- 4.2.11.6. R&D Innovation
- 4.2.11.7. Stock Market Performance
- 4.2.11.8. Supply Chain
- 4.2.11.9. Cross-Border Dynamics
- 4.2.1. Time Period
- 4.3. Concluding Remarks
5. EXECUTIVE SUMMARY
6. INTRODUCTION
- 6.1. Overview of Urban Air Mobility
- 6.2. Technology of Urban Air Mobility
- 6.3. Advantages of Urban Air Mobility
- 6.4. Challenges Associated with Urban Air Mobility
- 6.5. Future Perspective
7. REGULATORY SCENARIO
8. COMPREHENSIVE DATABASE OF LEADING PLAYERS
9. COMPETITIVE LANDSCAPE
- 9.1. Chapter Overview
- 9.2. Urban Air Mobility Market: Overall Landscape
- 9.2.1. Analysis by Year of Establishment
- 9.2.2. Analysis by Company Size
- 9.2.3. Analysis by Location of Headquarters
- 9.2.4. Analysis by Type of Company
- 9.2.5. Analysis by Type of Interface
- 9.2.6. Analysis by Technology Stack
- 9.3. Key Findings
10. WHITE SPACE ANALYSIS
11. COMPANY COMPETITIVENESS ANALYSIS
12. STARTUP ECOSYSTEM ANALYSIS
- 12.1. Urban Air Mobility Market: Startup Ecosystem Analysis
- 12.1.1. Analysis by Year of Establishment
- 12.1.2. Analysis by Company Size
- 12.1.3. Analysis by Location of Headquarters
- 12.1.4. Analysis by Ownership Type
- 12.1.5. Analysis by Type of Interface
- 12.1.6. Analysis by Technology Stack
- 12.2. Key Findings
13. COMPANY PROFILES
- 13.1. Chapter Overview
- 13.2. Airbus*
- 13.2.1. Company Overview
- 13.2.2. Company Mission
- 13.2.3. Company Footprint
- 13.2.4. Management Team
- 13.2.5. Contact Details
- 13.2.6. Financial Performance
- 13.2.7. Operating Business Segments
- 13.2.8. Service / Product Portfolio (project specific)
- 13.2.9. MOAT Analysis
- 13.2.10. Recent Developments and Future Outlook
- Similar details are presented for other companies (listed below), based on information in the public domain
- 13.3. Archer Aviation
- 13.4. BETA Technologies
- 13.5. Ehang Holdings
- 13.6. Elroy Air
- 13.7. Eve Air Mobility
- 13.8. Joby Aviation
- 13.9. Lilium
- 13.10. Pipistrel
- 13.11. Vertical Aerospace
- 13.12. Volocopter
- 13.13. Wisk Aero
14. MEGA TRENDS ANALYSIS
15. UNMET NEED ANALYSIS
16. PATENT ANALYSIS
17. RECENT DEVELOPMENTS
- 17.1. Chapter Overview
- 17.2. Recent Funding
- 17.3. Recent Partnerships
- 17.4. Other Recent Initiatives
18. GLOBAL URBAN AIR MOBILITY MARKET
- 18.1. Chapter Overview
- 18.2. Key Assumptions and Methodology
- 18.3. Trends Disruption Impacting Market
- 18.4. Demand Side Trends
- 18.5. Supply Side Trends
- 18.6. Global Urban Air Mobility Market: Historical Trends (Since 2022) and Forecasted Estimates (Till 2040)
- 18.7. Multivariate Scenario Analysis
- 18.7.1. Conservative Scenario
- 18.7.2. Optimistic Scenario
- 18.8. Investment Feasibility Index
- 18.9. Key Market Segmentations
19. MARKET OPPORTUNITIES BASED ON COMPONENT
- 19.1. Chapter Overview
- 19.2. Key Assumptions and Methodology
- 19.3. Revenue Shift Analysis
- 19.4. Market Movement Analysis
- 19.5. Penetration-Growth (P-G) Matrix
- 19.6. Urban Air Mobility Market for Hardware: Historical Trends (Since 2022) and Forecasted Estimates (Till 2040)
- 19.7. Urban Air Mobility Market for Services: Historical Trends (Since 2022) and Forecasted Estimates (Till 2040)
- 19.8. Urban Air Mobility Market for Software: Historical Trends (Since 2022) and Forecasted Estimates (Till 2040)
- 19.9. Data Triangulation and Validation
- 19.9.1. Secondary Sources
- 19.9.2. Primary Sources
- 19.9.3. Statistical Modeling
20. MARKET OPPORTUNITIES BASED ON VEHICLE TYPE
- 20.1. Chapter Overview
- 20.2. Key Assumptions and Methodology
- 20.3. Revenue Shift Analysis
- 20.4. Market Movement Analysis
- 20.5. Penetration-Growth (P-G) Matrix
- 20.6. Urban Air Mobility Market for Air Ambulance & Medical Emergency Vehicles: Historical Trends (Since 2022) and Forecasted Estimates (Till 2040)
- 20.7. Urban Air Mobility Market for Air Metro: Historical Trends (Since 2022) and Forecasted Estimates (Till 2040)
- 20.8. Urban Air Mobility Market for Air Shuttle: Historical Trends (Since 2022) and Forecasted Estimates (Till 2040)
- 20.9. Urban Air Mobility Market for Air Taxis: Historical Trends (Since 2022) and Forecasted Estimates (Till 2040)
- 20.10. Urban Air Mobility Market for Cargo Air Vehicles: Historical Trends (Since 2022) and Forecasted Estimates (Till 2040)
- 20.11. Urban Air Mobility Market for Last-mile Delivery Vehicles: Historical Trends (Since 2022) and Forecasted Estimates (Till 2040)
- 20.12. Urban Air Mobility Market for Personal Air Vehicles: Historical Trends (Since 2022) and Forecasted Estimates (Till 2040)
- 20.13. Data Triangulation and Validation
- 20.13.1. Secondary Sources
- 20.13.2. Primary Sources
- 20.13.3. Statistical Modeling
21. MARKET OPPORTUNITIES BASED ON PLATFORM ARCHITECTURE
- 21.1. Chapter Overview
- 21.2. Key Assumptions and Methodology
- 21.3. Revenue Shift Analysis
- 21.4. Market Movement Analysis
- 21.5. Penetration-Growth (P-G) Matrix
- 21.6. Urban Air Mobility Market for Fixed Wing: Historical Trends (Since 2022) and Forecasted Estimates (Till 2040)
- 21.7. Urban Air Mobility Market for Hybrid: Historical Trends (Since 2022) and Forecasted Estimates (Till 2040)
- 21.8. Urban Air Mobility Market for Rotory Wing: Historical Trends (Since 2022) and Forecasted Estimates (Till 2040)
- 21.9. Data Triangulation and Validation
- 21.9.1. Secondary Sources
- 21.9.2. Primary Sources
- 21.9.3. Statistical Modeling
22. MARKET OPPORTUNITIES BASED ON OPERATION MODE
- 22.1. Chapter Overview
- 22.2. Key Assumptions and Methodology
- 22.3. Revenue Shift Analysis
- 22.4. Market Movement Analysis
- 22.5. Penetration-Growth (P-G) Matrix
- 22.6. Urban Air Mobility Market for Fully Autonomous: Historical Trends (Since 2022) and Forecasted Estimates (Till 2040)
- 22.7. Urban Air Mobility Market for Piloted eVTOLs: Historical Trends (Since 2022) and Forecasted Estimates (Till 2040)
- 22.8. Urban Air Mobility Market for Remotely Operated: Historical Trends (Since 2022) and Forecasted Estimates (Till 2040)
- 22.9. Data Triangulation and Validation
- 22.9.1. Secondary Sources
- 22.9.2. Primary Sources
- 22.9.3. Statistical Modeling
23. MARKET OPPORTUNITIES BASED ON PROPULSION TYPE
- 23.1. Chapter Overview
- 23.2. Key Assumptions and Methodology
- 23.3. Revenue Shift Analysis
- 23.4. Market Movement Analysis
- 23.5. Penetration-Growth (P-G) Matrix
- 23.6. Urban Air Mobility Market for Electric: Historical Trends (Since 2022) and Forecasted Estimates (Till 2040)
- 23.7. Urban Air Mobility Market for Hybrid-Electric: Historical Trends (Since 2022) and Forecasted Estimates (Till 2040)
- 23.8. Urban Air Mobility Market for Hydrogen Fuel Cell: Historical Trends (Since 2022) and Forecasted Estimates (Till 2040)
- 23.9. Urban Air Mobility Market for Others: Historical Trends (Since 2022) and Forecasted Estimates (Till 2040)
- 23.10. Data Triangulation and Validation
- 23.10.1. Secondary Sources
- 23.10.2. Primary Sources
- 23.10.3. Statistical Modeling
24. MARKET OPPORTUNITIES BASED ON MAXIMUM TAKE-OFF WEIGHT
- 24.1. Chapter Overview
- 24.2. Key Assumptions and Methodology
- 24.3. Revenue Shift Analysis
- 24.4. Market Movement Analysis
- 24.5. Penetration-Growth (P-G) Matrix
- 24.6. Urban Air Mobility Market for <100 kg: Historical Trends (Since 2022) and Forecasted Estimates (Till 2040)
- 24.7. Urban Air Mobility Market for 100-300 kg: Historical Trends (Since 2022) and Forecasted Estimates (Till 2040)
- 24.8. Urban Air Mobility Market for >300 kg: Historical Trends (Since 2022) and Forecasted Estimates (Till 2040)
- 24.9. Data Triangulation and Validation
- 24.9.1. Secondary Sources
- 24.9.2. Primary Sources
- 24.9.3. Statistical Modeling
25. MARKET OPPORTUNITIES BASED ON RANGE
- 25.1. Chapter Overview
- 25.2. Key Assumptions and Methodology
- 25.3. Revenue Shift Analysis
- 25.4. Market Movement Analysis
- 25.5. Penetration-Growth (P-G) Matrix
- 25.6. Urban Air Mobility Market for Intercity (50-200 km): Historical Trends (Since 2022) and Forecasted Estimates (Till 2040)
- 25.7. Urban Air Mobility Market for Intracity (<50 km): Historical Trends (Since 2022) and Forecasted Estimates (Till 2040)
- 25.8. Urban Air Mobility Market for Long Range (>200 km): Historical Trends (Since 2022) and Forecasted Estimates (Till 2040)
- 25.9. Data Triangulation and Validation
- 25.9.1. Secondary Sources
- 25.9.2. Primary Sources
- 25.9.3. Statistical Modeling
26. MARKET OPPORTUNITIES BASED ON INFRASTRUCTURE
- 26.1. Chapter Overview
- 26.2. Key Assumptions and Methodology
- 26.3. Revenue Shift Analysis
- 26.4. Market Movement Analysis
- 26.5. Penetration-Growth (P-G) Matrix
- 26.6. Urban Air Mobility Market for Air Traffic Control System: Historical Trends (Since 2022) and Forecasted Estimates (Till 2040)
- 26.7. Urban Air Mobility Market for Charging Stations: Historical Trends (Since 2022) and Forecasted Estimates (Till 2040)
- 26.8. Urban Air Mobility Market for Maintenance: Historical Trends (Since 2022) and Forecasted Estimates (Till 2040)
- 26.9. Urban Air Mobility Market for Repair & Overhaul: Historical Trends (Since 2022) and Forecasted Estimates (Till 2040)
- 26.10. Urban Air Mobility Market for Vertiports: Historical Trends (Since 2022) and Forecasted Estimates (Till 2040)
- 26.11. Urban Air Mobility Market for Others: Historical Trends (Since 2022) and Forecasted Estimates (Till 2040)
- 26.12. Data Triangulation and Validation
- 26.12.1. Secondary Sources
- 26.12.2. Primary Sources
- 26.12.3. Statistical Modeling
27. MARKET OPPORTUNITIES BASED ON END USER
- 27.1. Chapter Overview
- 27.2. Key Assumptions and Methodology
- 27.3. Revenue Shift Analysis
- 27.4. Market Movement Analysis
- 27.5. Penetration-Growth (P-G) Matrix
- 27.6. Urban Air Mobility Market for E-Commerce Companies: Historical Trends (Since 2022) and Forecasted Estimates (Till 2040)
- 27.7. Urban Air Mobility Market for Hospitals: Historical Trends (Since 2022) and Forecasted Estimates (Till 2040)
- 27.8. Urban Air Mobility Market for Ridesharing Companies: Historical Trends (Since 2022) and Forecasted Estimates (Till 2040)
- 27.9. Urban Air Mobility Market for Medical Agencies: Historical Trends (Since 2022) and Forecasted Estimates (Till 2040)
- 27.10. Urban Air Mobility Market for Private Operators: Historical Trends (Since 2022) and Forecasted Estimates (Till 2040)
- 27.11. Urban Air Mobility Market for Scheduled Operators: Historical Trends (Since 2022) and Forecasted Estimates (Till 2040)
- 27.12. Data Triangulation and Validation
- 27.12.1. Secondary Sources
- 27.12.2. Primary Sources
- 27.12.3. Statistical Modeling
28. MARKET OPPORTUNITIES FOR URBAN AIR MOBILITY IN NORTH AMERICA
- 28.1. Chapter Overview
- 28.2. Key Assumptions and Methodology
- 28.3. Revenue Shift Analysis
- 28.4. Market Movement Analysis
- 28.5. Penetration-Growth (P-G) Matrix
- 28.6. Urban Air Mobility Market in North America: Historical Trends (Since 2022) and Forecasted Estimates (Till 2040)
- 28.6.1. Urban Air Mobility Market in the US: Historical Trends (Since 2022) and Forecasted Estimates (Till 2040)
- 28.6.2. Urban Air Mobility Market in Canada: Historical Trends (Since 2022) and Forecasted Estimates (Till 2040)
- 28.6.3. Urban Air Mobility Market in Mexico: Historical Trends (Since 2022) and Forecasted Estimates (Till 2040)
- 28.6.4. Urban Air Mobility Market in Rest of North America: Historical Trends (Since 2022) and Forecasted Estimates (Till 2040)
- 28.7. Data Triangulation and Validation
29. MARKET OPPORTUNITIES FOR URBAN AIR MOBILITY IN EUROPE
- 29.1. Chapter Overview
- 29.2. Key Assumptions and Methodology
- 29.3. Revenue Shift Analysis
- 29.4. Market Movement Analysis
- 29.5. Penetration-Growth (P-G) Matrix
- 29.6. Urban Air Mobility Market in Europe: Historical Trends (Since 2022) and Forecasted Estimates (Till 2040)
- 29.6.1. Urban Air Mobility Market in Austria: Historical Trends (Since 2022) and Forecasted Estimates (Till 2040)
- 29.6.2. Urban Air Mobility Market in Belgium: Historical Trends (Since 2022) and Forecasted Estimates (Till 2040)
- 29.6.3. Urban Air Mobility Market in Denmark: Historical Trends (Since 2022) and Forecasted Estimates (Till 2040)
- 29.6.4. Urban Air Mobility Market in France: Historical Trends (Since 2022) and Forecasted Estimates (Till 2040)
- 29.6.5. Urban Air Mobility Market in Germany: Historical Trends (Since 2022) and Forecasted Estimates (Till 2040)
- 29.6.6. Urban Air Mobility Market in Ireland: Historical Trends (Since 2022) and Forecasted Estimates (Till 2040)
- 29.6.7. Urban Air Mobility Market in Italy: Historical Trends (Since 2022) and Forecasted Estimates (Till 2040)
- 29.6.8. Urban Air Mobility Market in the Netherlands: Historical Trends (Since 2022) and Forecasted Estimates (Till 2040)
- 29.6.9. Urban Air Mobility Market in Norway: Historical Trends (Since 2022) and Forecasted Estimates (Till 2040)
- 29.6.10. Urban Air Mobility Market in Russia: Historical Trends (Since 2022) and Forecasted Estimates (Till 2040)
- 29.6.11. Urban Air Mobility Market in Spain: Historical Trends (Since 2022) and Forecasted Estimates (Till 2040)
- 29.6.12. Urban Air Mobility Market in Sweden: Historical Trends (Since 2022) and Forecasted Estimates (Till 2040)
- 29.6.13. Urban Air Mobility Market in Switzerland: Historical Trends (Since 2022) and Forecasted Estimates (Till 2040)
- 29.6.14. Urban Air Mobility Market in the UK: Historical Trends (Since 2022) and Forecasted Estimates (Till 2040)
- 29.6.15. Urban Air Mobility Market in Rest of Europe: Historical Trends (Since 2022) and Forecasted Estimates (Till 2040)
- 29.7. Data Triangulation and Validation
30. MARKET OPPORTUNITIES FOR URBAN AIR MOBILITY IN ASIA-PACIFIC
- 30.1. Chapter Overview
- 30.2. Key Assumptions and Methodology
- 30.3. Revenue Shift Analysis
- 30.4. Market Movement Analysis
- 30.5. Penetration-Growth (P-G) Matrix
- 30.6. Urban Air Mobility Market in Asia-Pacific: Historical Trends (Since 2022) and Forecasted Estimates (Till 2040)
- 30.6.1. Urban Air Mobility Market in China: Historical Trends (Since 2022) and Forecasted Estimates (Till 2040)
- 30.6.2. Urban Air Mobility Market in India: Historical Trends (Since 2022) and Forecasted Estimates (Till 2040)
- 30.6.3. Urban Air Mobility Market in Japan: Historical Trends (Since 2022) and Forecasted Estimates (Till 2040)
- 30.6.4. Urban Air Mobility Market in Singapore: Historical Trends (Since 2022) and Forecasted Estimates (Till 2040)
- 30.6.5. Urban Air Mobility Market in South Korea: Historical Trends (Since 2022) and Forecasted Estimates (Till 2040)
- 30.6.6. Urban Air Mobility Market in Rest of Asia-Pacific: Historical Trends (Since 2022) and Forecasted Estimates (Till 2040)
- 30.7. Data Triangulation and Validation
31. MARKET OPPORTUNITIES FOR URBAN AIR MOBILITY IN LATIN AMERICA
- 31.1. Chapter Overview
- 31.2. Key Assumptions and Methodology
- 31.3. Revenue Shift Analysis
- 31.4. Market Movement Analysis
- 31.5. Penetration-Growth (P-G) Matrix
- 31.6. Urban Air Mobility Market in Latin America: Historical Trends (Since 2022) and Forecasted Estimates (Till 2040)
- 31.6.1. Urban Air Mobility Market in Argentina: Historical Trends (Since 2022) and Forecasted Estimates (Till 2040)
- 31.6.2. Urban Air Mobility Market in Brazil: Historical Trends (Since 2022) and Forecasted Estimates (Till 2040)
- 31.6.3. Urban Air Mobility Market in Chile: Historical Trends (Since 2022) and Forecasted Estimates (Till 2040)
- 31.6.4. Urban Air Mobility Market in Colombia Historical Trends (Since 2022) and Forecasted Estimates (Till 2040)
- 31.6.5. Urban Air Mobility Market in Venezuela: Historical Trends (Since 2022) and Forecasted Estimates (Till 2040)
- 31.6.6. Urban Air Mobility Market in Rest of Latin America: Historical Trends (Since 2022) and Forecasted Estimates (Till 2040)
- 31.7. Data Triangulation and Validation
32. MARKET OPPORTUNITIES FOR URBAN AIR MOBILITY IN MIDDLE EAST AND AFRICA (MEA)
- 32.1. Chapter Overview
- 32.2. Key Assumptions and Methodology
- 32.3. Revenue Shift Analysis
- 32.4. Market Movement Analysis
- 32.5. Penetration-Growth (P-G) Matrix
- 32.6. Urban Air Mobility Market in Middle East and Africa (MEA): Historical Trends (Since 2022) and Forecasted Estimates (Till 2040)
- 32.6.1. Urban Air Mobility Market in Egypt: Forecasted Estimates (Till 205)
- 32.6.2. Urban Air Mobility Market in Iran: Historical Trends (Since 2022) and Forecasted Estimates (Till 2040)
- 32.6.3. Urban Air Mobility Market in Iraq: Historical Trends (Since 2022) and Forecasted Estimates (Till 2040)
- 32.6.4. Urban Air Mobility Market in Israel: Historical Trends (Since 2022) and Forecasted Estimates (Till 2040)
- 32.6.5. Urban Air Mobility Market in Kuwait: Historical Trends (Since 2022) and Forecasted Estimates (Till 2040)
- 32.6.6. Urban Air Mobility Market in Saudi Arabia: Historical Trends (Since 2022) and Forecasted Estimates (Till 2040)
- 32.6.7. Urban Air Mobility Market in United Arab Emirates (UAE): Historical Trends (Since 2022) and Forecasted Estimates (Till 2040)
- 32.6.8. Urban Air Mobility Market in Rest of MEA: Historical Trends (Since 2022) and Forecasted Estimates (Till 2040)
- 32.7. Data Triangulation and Validation
33. MARKET CONCENTRATION ANALYSIS: DISTRIBUTION BY LEADING PLAYERS
34. ADJACENT MARKET ANALYSIS
35. KEY WINNING STRATEGIES
36. PORTER'S FIVE FORCES ANALYSIS
37. SWOT ANALYSIS
38. VALUE CHAIN ANALYSIS
39. ROOTS STRATEGIC RECOMMENDATIONS
- 39.1. Chapter Overview
- 39.2. Key Business-related Strategies
- 39.2.1. Research & Development
- 39.2.2. Product Manufacturing
- 39.2.3. Commercialization / Go-to-Market
- 39.2.4. Sales and Marketing
- 39.3. Key Operations-related Strategies
- 39.3.1. Risk Management
- 39.3.2. Workforce
- 39.3.3. Finance
- 39.3.4. Others
40. INSIGHTS FROM PRIMARY RESEARCH
41. REPORT CONCLUSION
42. TABULATED DATA
43. LIST OF COMPANIES AND ORGANIZATIONS

