
PUBLISHER: Mordor Intelligence | PRODUCT CODE: 2073579

PUBLISHER: Mordor Intelligence | PRODUCT CODE: 2073579
Asia Pacific LED Lighting - Market Share Analysis, Industry Trends & Statistics, Growth Forecasts (2026 - 2031)
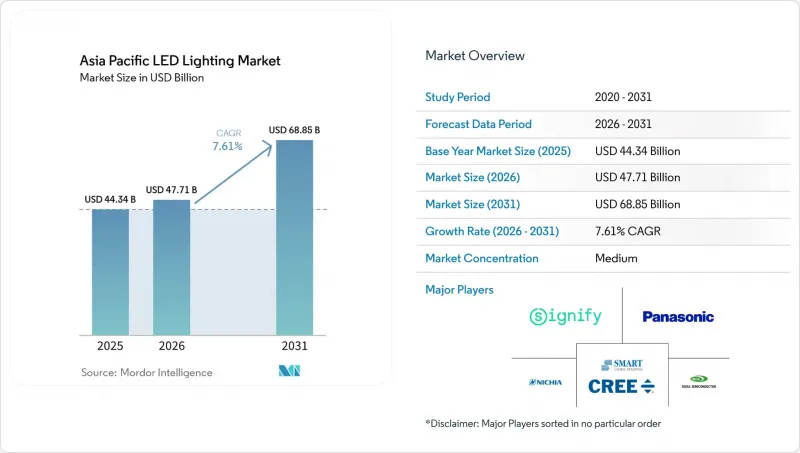
According to Mordor Intelligence, asia pacific LED lighting market size in 2026 is estimated at USD 47.71 billion, growing from 2025 value of USD 44.34 billion with 2031 projections showing USD 68.85 billion, growing at 7.61% CAGR over 2026-2031.
This report is Segmented by Product Type (Lamps, and Luminaires/Fixtures), Distribution Channel (Direct Sales, Wholesale/Retail, and More), Installation Type (New Installation, and Retrofit Installation), Application (Commercial Offices, Retail Stores, and More), End User (Indoor, Outdoor, and More), and Country (United Kingdom, and More). The Market Forecasts are Provided in Terms of Value (USD).
Asia Pacific LED Lighting Market Trends and Insights
Government Energy-Efficiency Mandates and Subsidy Programs Drive Market Acceleration
Fluorescent lamp phase-outs, building code revisions, and subsidy pools across the Asia Pacific continue to turbo-charge demand. Japan's 2027 production ban on fluorescent lamps already triggered a local rebate program worth JPY 30 million (USD 0.2 million) in Iwata City, targeting a 1,268,000 kWh annual cut in power use. Vietnam's energy ministry positions LEDs as a fast-track pathway toward achieving national carbon-neutrality goals, providing procurement certainty that enables manufacturers to invest in local assembly lines. Complementary Indian LED lighting production-linked incentives lower component costs, shorten supply chains, and reinforce domestic self-reliance. Overall, well-timed policy support shortens payback cycles and accelerates the uptake of LED lighting in the Asia Pacific market.
Rapid Urbanization and Infrastructure Build-Out Reshape Demand Patterns
The region adds millions of new urban residents each year, pushing municipalities to integrate energy-saving luminaires into rail hubs, airports, and arterial roads. Ho Chi Minh City's Tan Sơn Nhất Terminal 3 installation spans 112,500 square meters and utilizes bio-centric LED standards to accommodate 20 million annual passengers. China's fleet electrification, which includes over 16,000 e-buses, couples charging infrastructure with LED streetlighting to manage nighttime safety and energy budgets. New-build projects, therefore, sidestep legacy technologies, bolstering forward orders for the Asia Pacific LED lighting market.
High Upfront Cost of Advanced Fixtures and Controls Limits Adoption Velocity
Network-ready luminaires can cost two to four times more than conventional alternatives, slowing uptake among small enterprises. A World Bank review of city-led lighting schemes indicates that streetlighting may absorb up to 20% of a smaller municipality's total budget when unsubsidized. Even in Vietnam's export-oriented industrial parks, Signify's smart retrofits require four to five years to break even. Financing mechanisms, such as ESCO contracts, ease barriers but require contractual sophistication that many local users still lack, restraining near-term expansion in the Asia Pacific LED lighting market.
Other drivers and restraints analyzed in the detailed report include:
- Declining LED Prices With Higher Efficacy Expand Market Accessibility
- Surge in Smart and Connected Lighting Adoption Creates Premium Segments
- Margin Squeeze From Intense Price Competition Pressures Industry Profitability
For complete list of drivers and restraints, kindly check the Table Of Contents.
Segment Analysis
Luminaires accounted for 62.05% of the revenue in 2025 within the Asia Pacific LED lighting market, owing to higher average selling prices and tighter integration requirements. Their dominance stems from the holistic energy management needs in commercial projects, where comprehensive systems often outweigh the need for component replacements. Lamps, despite a lower base, are projected to record a 9.35% CAGR to 2031, buoyed by residential replacements and secondary upgrades.
Lamp growth benefits from standardization that lowers switching costs, while Japan's impending fluorescent ban boosts demand for drop-in LED tubes. As the installed base widens, volume shifts progressively from new fixture installations to lamp replacements, reshaping the revenue mix across the Asia Pacific LED lighting market.
Wholesale retail contributed 53.88% of the turnover in 2025 within the Asia Pacific LED lighting market, supported by contractor relationships and credit facilities essential for bulk projects. However, e-commerce is advancing at an 7.86% CAGR, capitalizing on transparent pricing and doorstep delivery for small firms and homeowners.
Digital players now embed product configurators and after-sales networks to close historical service gaps. Over the forecast horizon, commodity SKUs may increasingly migrate online, leaving wholesalers to focus on design-build services and financing, which should gradually dilute their share but sustain value density in the Asia Pacific LED lighting market.
Complete Report Scope:
- By Product Type
- Lamps
- Luminaires/ Fixtures
- By Distribution Channel
- Direct Sales
- Wholesale Retail
- E-commerce
- By Installation Type
- New Installation
- Retrofit Installation
- By Application
- Commercial Offices
- Retail Stores
- Hospitality
- Industrial
- Highway and Roadway
- Architectural
- Public Places
- Hospitals
- Horticulture Gardens
- Residential
- Automotive
- Others(Chemicals, Oil and gas, agriculture)
- By End User
- Indoor
- Outdoor
- Automotive
- By Country
- China
- Japan
- India
- South Korea
- Southeast Asia
- Rest of Asia-Pacific
List of Companies Covered in this Report:
- Signify N.V.
- Nichia Corporation
- Seoul Semiconductor Co., Ltd.
- Everlight Electronics Co., Ltd.
- Opple Lighting Co., Ltd.
- Foshan Electrical and Lighting Co., Ltd.
- Yankon Group Co., Ltd.
- MLS Co., Ltd. (Forest Lighting)
- Zhejiang NVC Lighting Technology Co., Ltd.
- Wipro Enterprises (P) Ltd. (Wipro Lighting)
- Havells India Ltd.
- Syska LED Lights Pvt Ltd.
- Panasonic Corporation (Lighting)
- Toshiba Lighting and Technology Corp.
- Sharp Corporation (LED)
- Honglitronic Co., Ltd.
- Lite-On Technology Corp.
- Cree LED (Smart Global Holdings)
- Lextar Electronics Corp.
- Stanley Electric Co., Ltd.
- Lumileds Holding B.V.
- Sanan Optoelectronics Co., Ltd.
- Nationstar Optoelectronics Co., Ltd.
- Leedarson Lighting Co., Ltd.
- Unilumin Group Co., Ltd.
Additional Benefits:
- The market estimate (ME) sheet in Excel format
- 3 months of analyst support
TABLE OF CONTENTS
1 INTRODUCTION
- 1.1 Study Assumptions and Market Definition
- 1.2 Scope of the Study
2 RESEARCH METHODOLOGY
3 EXECUTIVE SUMMARY
4 MARKET LANDSCAPE
- 4.1 Market Overview
- 4.2 Market Drivers
- 4.2.1 Government energy-efficiency mandates and subsidy programs
- 4.2.2 Rapid urbanization and infrastructure build-out
- 4.2.3 Declining LED prices with higher efficacy
- 4.2.4 Surge in smart and connected lighting adoption
- 4.2.5 Secondary replacement wave of first-gen LEDs
- 4.2.6 Growing demand for human-centric/circadian lighting
- 4.3 Market Restraints
- 4.3.1 High upfront cost of advanced fixtures and controls
- 4.3.2 Margin squeeze from intense price competition
- 4.3.3 Fragmented after-sales/retrofit service networks
- 4.3.4 IC supply-chain volatility and tariff exposure
- 4.4 Industry Value Chain Analysis
- 4.5 Impact of Macroeconomic Factors
- 4.6 Regulatory Landscape
- 4.7 Technological Outlook
- 4.8 Porter's Five Forces Analysis
- 4.8.1 Threat of New Entrants
- 4.8.2 Bargaining Power of Suppliers
- 4.8.3 Bargaining Power of Buyers
- 4.8.4 Threat of Substitute Products
- 4.8.5 Intensity of Competitive Rivalry
5 MARKET SIZE AND GROWTH FORECASTS (VALUE)
- 5.1 By Product Type
- 5.1.1 Lamps
- 5.1.2 Luminaires/ Fixtures
- 5.2 By Distribution Channel
- 5.2.1 Direct Sales
- 5.2.2 Wholesale Retail
- 5.2.3 E-commerce
- 5.3 By Installation Type
- 5.3.1 New Installation
- 5.3.2 Retrofit Installation
- 5.4 By Application
- 5.4.1 Commercial Offices
- 5.4.2 Retail Stores
- 5.4.3 Hospitality
- 5.4.4 Industrial
- 5.4.5 Highway and Roadway
- 5.4.6 Architectural
- 5.4.7 Public Places
- 5.4.8 Hospitals
- 5.4.9 Horticulture Gardens
- 5.4.10 Residential
- 5.4.11 Automotive
- 5.4.12 Others(Chemicals, Oil and gas, agriculture)
- 5.5 By End User
- 5.5.1 Indoor
- 5.5.2 Outdoor
- 5.5.3 Automotive
- 5.6 By Country
- 5.6.1 China
- 5.6.2 Japan
- 5.6.3 India
- 5.6.4 South Korea
- 5.6.5 Southeast Asia
- 5.6.6 Rest of Asia-Pacific
6 COMPETITIVE LANDSCAPE
- 6.1 Market Concentration
- 6.2 Strategic Moves
- 6.3 Market Share Analysis
- 6.4 Company Profiles (includes Global level Overview, Market level overview, Core Segments, Financials as available, Strategic Information, Market Rank/Share for key companies, Products and Services, and Recent Developments)
- 6.4.1 Signify N.V.
- 6.4.2 Nichia Corporation
- 6.4.3 Seoul Semiconductor Co., Ltd.
- 6.4.4 Everlight Electronics Co., Ltd.
- 6.4.5 Opple Lighting Co., Ltd.
- 6.4.6 Foshan Electrical and Lighting Co., Ltd.
- 6.4.7 Yankon Group Co., Ltd.
- 6.4.8 MLS Co., Ltd. (Forest Lighting)
- 6.4.9 Zhejiang NVC Lighting Technology Co., Ltd.
- 6.4.10 Wipro Enterprises (P) Ltd. (Wipro Lighting)
- 6.4.11 Havells India Ltd.
- 6.4.12 Syska LED Lights Pvt Ltd.
- 6.4.13 Panasonic Corporation (Lighting)
- 6.4.14 Toshiba Lighting and Technology Corp.
- 6.4.15 Sharp Corporation (LED)
- 6.4.16 Honglitronic Co., Ltd.
- 6.4.17 Lite-On Technology Corp.
- 6.4.18 Cree LED (Smart Global Holdings)
- 6.4.19 Lextar Electronics Corp.
- 6.4.20 Stanley Electric Co., Ltd.
- 6.4.21 Lumileds Holding B.V.
- 6.4.22 Sanan Optoelectronics Co., Ltd.
- 6.4.23 Nationstar Optoelectronics Co., Ltd.
- 6.4.24 Leedarson Lighting Co., Ltd.
- 6.4.25 Unilumin Group Co., Ltd.
7 MARKET OPPORTUNITIES AND FUTURE OUTLOOK
- 7.1 White-space and Unmet-need Assessment

