PUBLISHER: Mordor Intelligence | PRODUCT CODE: 2100664

PUBLISHER: Mordor Intelligence | PRODUCT CODE: 2100664
Women's Non-athletic Footwear - Market Share Analysis, Industry Trends & Statistics, Growth Forecasts (2026 - 2031)
According to Mordor Intelligence, the women non athletic footwear market size is expected to grow from USD 137.72 billion in 2025 to USD 139.28 billion in 2026 and reach USD 166.72 billion by 2031, growing at a CAGR of 3.66% over 2026-2031.
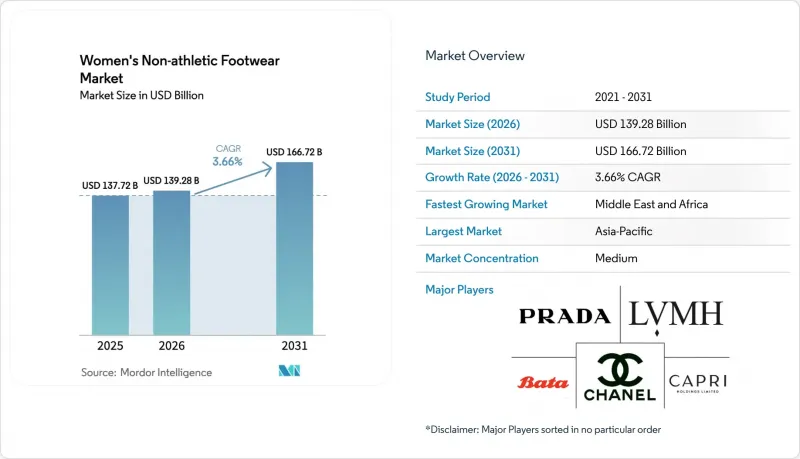
This report is Segmented by Type (Boots and Shoes, Heels and Pumps, Flats, Sandals, Other Types), Category (Mass, Premium), Material (Leather, Synthetic, Textile, Other Materials), Distribution Channel (Online Retail Stores, Offline Retail Stores), and Geography (North America, Europe, Asia-Pacific, South America, Middle East and Africa). The Market Forecasts are Provided in Terms of Value (USD).
Global Women's Non-athletic Footwear Market Trends and Insights
Rapid Fast-Fashion SKU Refresh Cycles
In 2025, Inditex reduced its footwear design-to-shelf cycle to 21 days, an improvement from 35 days in 2023. This faster cycle enables Zara stores to refresh their heel and flat assortments 17 times annually, significantly exceeding the industry average of 6-8 turns. This agility allows brands to test micro-trends, such as kitten-heel mules or square-toe loafers, across 200-store clusters before scaling to full production, cutting markdown risk by 40%. H&M's footwear division adopted a comparable approach in late 2024, collaborating with Vietnamese contract manufacturers to achieve 4-week lead times for synthetic uppers. This strategy challenges mid-tier department-store brands, which operate on 16-week planning cycles, forcing them to lose market share to more agile competitors. Additionally, the rapid SKU refresh has driven demand for modular last designs and digital pattern-cutting technologies. Clarks and Deichmann piloted these innovations in 2025, successfully reducing sample-room waste by half. Although regulatory influence remains limited, ISO 20345 safety standards for occupational footwear require a 6-month certification process, which restricts refresh speeds in industrial segments.
AI-Powered Direct-To-Consumer Sizing Precision
By the end of 2025, Volumental's 3D foot-scanning kiosks, set to be in 3,200 retail locations, achieved a 28% reduction in return rates for women's boots. This was accomplished by mapping 11 biomechanical dimensions and suggesting brand-specific size adjustments. In the UK, startup Laws of Motion embedded gait-analysis sensors into trial shoes. These sensors captured pronation and arch-flex data, leading to comfort score predictions with 91% accuracy. In 2025, the system handled 480,000 fittings, successfully converting 34% of users into buyers within 48 hours. SafeSize's smartphone app, leveraging camera-based photogrammetry, saw 2.1 million downloads in North America in 2025. This allowed direct-to-consumer brands to entirely eliminate the need for physical try-ons, as reported by TechCrunch. Such advancements in technology are reshaping the competitive landscape, favoring data-centric platforms. Brands boasting over 50,000 scans can refine proprietary algorithms, achieving a 15-20 percentage point edge over generic size charts in fit satisfaction. Meanwhile, traditional retailers, like Nine West, highlighted the challenges of lacking a digital infrastructure. In their 2025 Q3 earnings call, they pointed to heightened return rates as a significant drag on their gross margin.
Fluctuating And Volatile Leather Prices
In 2024, prolonged droughts in the Mato Grosso and Goias states caused a 6.2% contraction in Brazilian cattle herds. Consequently, wet-blue leather prices rose to USD 2.80 per square foot in Q1 2025, reflecting a 22% year-over-year increase. This price volatility reduced gross margins for mid-tier brands by 3-5 percentage points. To address this, Clarks increased wholesale prices by 8% in March 2025, but retailer resistance delayed spring shipments. Simultaneously, Indian leather exports, the world's second-largest source, declined by 11% in volume during 2024-2025. This drop resulted from domestic tanneries facing water-use restrictions under revised Central Pollution Control Board guidelines, tightening global supply, as reported by the Indian Leather Industry Association. Synthetic alternatives gained traction, with PU upper adoption increasing by 4 percentage points in 2025 as brands sought cost stability. However, in European markets, consumer perception of synthetic durability remains 18% lower than that of leather. Despite the volatility, hedging instruments in the industry remain underutilized. A 2025 survey indicated that only 12% of footwear brands employed commodity futures to mitigate leather-price risks, leaving most exposed to spot-market fluctuations.
Other drivers and restraints analyzed in the detailed report include:
- Recovery In Post-Pandemic Occasion Wear Demand
- Affordable And Competitive Vegan Leather Alternatives
- Stringent EU Extended Producer Responsibility Regulations
For complete list of drivers and restraints, kindly check the Table Of Contents.
Segment Analysis
In 2025, boots and shoes led the market with a 44.26% share, driven by year-round versatility and strong cold-weather demand in Northern Europe and North America. Heels are projected to grow at the fastest rate, with a 5.61% CAGR through 2031. The post-pandemic recovery of occasion-wear, marked by an 18% year-over-year rise in U.S. weddings to 2.4 million in 2025, revived pump and stiletto sales after declines during the remote-work period. Flats, popular for comfort and benefiting from the athleisure trend, hold significant volume but show slower growth at 3.2% as the segment matures. Sandals, while holding a notable share, face seasonal demand risks but are gaining traction in Middle Eastern markets, supported by year-round warm weather. UAE sandal imports rose 14% in 2025.
Innovations in heel construction are transforming the segment. Jimmy Choo's spring 2025 collection, featuring 3.5-inch block heels with gel cushioning, sold out in six weeks across Asia-Pacific flagship stores, highlighting demand for comfort-engineered luxury. In Q3 2025, Steve Madden introduced 3D-printed heel cores, cutting component weight by 22% without reducing load capacity, potentially lowering material costs by USD 1.80 per pair at scale. Boots and shoes, though slower-growing, benefit from hybrid designs. Ankle boots with sneaker-like soles captured 8% of the segment in 2025, appealing to consumers seeking formal looks with athletic comfort, as reported by the Financial Times. Other styles, such as mules and espadrilles, remain niche with a combined share under 8% but serve as platforms for testing materials like cork composites and recycled ocean plastics.
In 2025, mass-market offerings accounted for 85.52% of the volume, driven by price sensitivity in Asia-Pacific and Latin America, where annual per-capita footwear spending remains under USD 45. Meanwhile, premium lines grew at a 5.48% CAGR, supported by resale platforms legitimizing pre-owned luxury and aspirational consumers trading up. TheRealReal reported a 34% year-over-year increase in women's footwear consignment, with Gucci loafers and Prada pumps retaining 68% of their original retail price, offering accessible entry points into premium tiers. Vestiaire Collective's footwear gross merchandise value rose 41%, driven by Gen-Z buyers viewing pre-owned luxury as sustainable and financially practical, as noted by the Financial Times. This trend challenges mid-tier brands as consumers increasingly favor mass-market value or authenticated premium resale over the USD 80-150 price range.
Premium brands are using material innovation to justify higher prices. Allbirds launched bacterial cellulose flats at USD 145, achieving a 38% carbon-footprint reduction compared to synthetic alternatives, appealing to eco-conscious buyers willing to pay 20-25% more for verified sustainability. Rothy's scaled its 3D-knit uppers to 1.2 million pairs in 2025, eliminating cut-and-sew waste and enabling customization, with retail prices at USD 165. Mass-market players counter with cost efficiencies. Bata automated its Bangladeshi facilities in 2025, cutting per-unit labor costs by USD 0.90 and offering retail prices below USD 30 while maintaining 18% gross margins. Deichmann's private-label strategy, which made up 62% of its 2025 footwear sales, used vertical integration to undercut branded mass competitors by 15-20% on similar styles. The bifurcation forces mid-tier brands to either scale down to compete on cost or enhance product storytelling to justify premium positioning.
Complete Report Scope:
- By Type
- Boots and Shoes
- Heels and Pumps
- Flats
- Sandals
- Other Types
- By Category
- Mass
- Premium
- By Material
- Leather
- Synthetic
- Textile
- Other Materials
- By Distribution Channel
- Online Retail Stores
- Offline Retail Stores
- Boots and Shoes
- By Geography
- North America
- United States
- Canada
- Mexico
- Rest of North America
- Europe
- United Kingdom
- Germany
- Spain
- France
- Italy
- Sweden
- Poland
- Netherlands
- Russia
- Rest of Europe
- Asia-Pacific
- China
- India
- Japan
- Australia
- Indonesia
- Thailand
- Vietnam
- Malaysia
- Rest of Asia-Pacific
- South America
- Brazil
- Argentina
- Chile
- Peru
- Colombia
- Rest of South America
- Middle East and Africa
- Saudi Arabia
- South Africa
- United Arab Emirates
- Egypt
- Morocco
- Rest of Middle East and Africa
- North America
Geography Analysis
In 2025, the Asia-Pacific region held a 48.18% market share, driven by China's 1.4 billion population and India's rapid urbanization. This dominance is expected to continue, supported by increasing female workforce participation and middle-class growth, sustaining footwear demand. India added 8.3 million women to formal employment in 2024-2025, raising workforce participation from 24.8% to 27.1%, which contributed to a 12-15% annual rise in non-athletic footwear purchases among these workers. China's premiumization trend saw a 19% year-over-year increase in footwear priced above CNY 800 (USD 110) in 2025, reflecting higher disposable incomes in tier-2 cities like Chengdu and Hangzhou. Southeast Asia, including Vietnam, Thailand, Indonesia, and Malaysia, accounted for 18% of regional volume in 2025, driven by manufacturing growth and e-commerce, which made up 38% of urban footwear sales. Japan's market grew modestly at 1.8% in 2025, while luxury resale platforms like Vestiaire Collective saw a 41% GMV increase, indicating rising interest in circular-economy models.
Middle East and Africa recorded the fastest growth at a 5.02% CAGR, supported by Saudi Arabia's Vision 2030 retail investments and the UAE's free-zone expansions, which added 14 new footwear distribution centers in 2025. Saudi Arabia's female workforce participation rose from 33% in 2023 to 37% in 2025, driven by public-sector hiring and relaxed guardianship laws, creating 1.2 million new footwear consumers, according to the World Bank. South Africa's formal retail sector grew 7% in 2025, with Johannesburg and Cape Town contributing 62% of premium footwear sales as the middle class expanded faster than inflation. Egypt's footwear imports increased 22% in volume during 2024-2025, but currency devaluation limited value growth to 9%, highlighting price sensitivity, as noted by the Egyptian Ministry of Trade. Morocco's free-trade agreements with the EU positioned it as a nearshoring hub, with footwear exports to Europe rising 16% in 2025, signaling supply-chain shifts.
Europe accounted for a significantthe revenue, with Germany, France, and the UK representing 58% of regional volume. Growth slowed to 2.1% due to athleisure substitution and economic challenges. Germany's July 2025 EPR scheme, requiring 25% post-consumer recycled content by 2028, led to investments in reverse logistics, benefiting large players like Inditex and H&M while straining smaller brands, according to the German Federal Environment Agency. The Netherlands' September 2025 digital product passport mandate required brands to disclose material sourcing and carbon intensity for each SKU, creating challenges for smaller brands, as reported by Reuters. North America grew 3.4%, driven by a post-pandemic recovery in occasion-wear. U.S. wedding attendance reached 2.4 million ceremonies in 2025, up 18% year-over-year, boosting demand for heels and pumps. In South America, Brazil and Argentina led growth, but currency volatility and import tariffs raised retail prices 12-18% above Asia-Pacific levels.
- LVMH Moet Hennessy Louis Vuitton SE
- Kering SA
- Capri Holdings
- Tapestry Inc.
- VF Corporation
- Chanel SA
- Prada SpA
- Skechers USA
- Steve Madden
- Deichmann SE
- Clarks PLC
- Nine West Holdings
- The ALDO Group
- Rothy's Inc.
- Allbirds Inc.
- DSW (Designer Brands Inc.)
- LIR SRL
- Bata Corp.
- Hand M Group
- Inditex (Zara)
Additional Benefits:
- The market estimate (ME) sheet in Excel format
- 3 months of analyst support
TABLE OF CONTENTS
1 INTRODUCTION
- 1.1 Study Assumptions and Market Definition
- 1.2 Scope of the Study
2 RESEARCH METHODOLOGY
3 EXECUTIVE SUMMARY
4 MARKET LANDSCAPE
- 4.1 Market Overview
- 4.2 Market Drivers
- 4.2.1 Rapid Fast-Fashion SKU Refresh Cycles
- 4.2.2 AI-Powered Direct-To-Consumer Sizing Precision
- 4.2.3 Recovery In Post-Pandemic Occasion Wear Demand
- 4.2.4 Affordable And Competitive Vegan Leather Alternatives
- 4.2.5 Expansion Of Luxury Resale And Pre-Owned Channels
- 4.2.6 Rising Female Workforce Participation In Emerging Markets
- 4.3 Market Restraints
- 4.3.1 Fluctuating And Volatile Leather Pricesimage.jpg
- 4.3.2 Proliferation Of Counterfeits In Cross-Border E-Commerce
- 4.3.3 Stringent EU Extended Producer Responsibility Regulations
- 4.3.4 Athleisure Comfort Trends Eroding Formal Footwear Demand
- 4.4 Consumer Behavior Analysis
- 4.5 Regulatory Landscape
- 4.6 Technological Outlook
- 4.7 Porter's Five Forces
- 4.7.1 Threat of New Entrants
- 4.7.2 Bargaining Power of Buyers
- 4.7.3 Bargaining Power of Suppliers
- 4.7.4 Threat of Substitutes
- 4.7.5 Competitive Rivalry
5 MARKET SIZE AND GROWTH FORECASTS
- 5.1 By Type
- 5.1.1 Boots and Shoes
- 5.1.1.1 Heels and Pumps
- 5.1.1.2 Flats
- 5.1.1.3 Sandals
- 5.1.1.4 Other Types
- 5.1.2 By Category
- 5.1.2.1 Mass
- 5.1.2.2 Premium
- 5.1.3 By Material
- 5.1.3.1 Leather
- 5.1.3.2 Synthetic
- 5.1.3.3 Textile
- 5.1.3.4 Other Materials
- 5.1.4 By Distribution Channel
- 5.1.4.1 Online Retail Stores
- 5.1.4.2 Offline Retail Stores
- 5.1.1 Boots and Shoes
- 5.2 By Geography
- 5.2.1 North America
- 5.2.1.1 United States
- 5.2.1.2 Canada
- 5.2.1.3 Mexico
- 5.2.1.4 Rest of North America
- 5.2.2 Europe
- 5.2.2.1 United Kingdom
- 5.2.2.2 Germany
- 5.2.2.3 Spain
- 5.2.2.4 France
- 5.2.2.5 Italy
- 5.2.2.6 Sweden
- 5.2.2.7 Poland
- 5.2.2.8 Netherlands
- 5.2.2.9 Russia
- 5.2.2.10 Rest of Europe
- 5.2.3 Asia-Pacific
- 5.2.3.1 China
- 5.2.3.2 India
- 5.2.3.3 Japan
- 5.2.3.4 Australia
- 5.2.3.5 Indonesia
- 5.2.3.6 Thailand
- 5.2.3.7 Vietnam
- 5.2.3.8 Malaysia
- 5.2.3.9 Rest of Asia-Pacific
- 5.2.4 South America
- 5.2.4.1 Brazil
- 5.2.4.2 Argentina
- 5.2.4.3 Chile
- 5.2.4.4 Peru
- 5.2.4.5 Colombia
- 5.2.4.6 Rest of South America
- 5.2.5 Middle East and Africa
- 5.2.5.1 Saudi Arabia
- 5.2.5.2 South Africa
- 5.2.5.3 United Arab Emirates
- 5.2.5.4 Egypt
- 5.2.5.5 Morocco
- 5.2.5.6 Rest of Middle East and Africa
- 5.2.1 North America
6 COMPETITIVE LANDSCAPE
- 6.1 Market Concentration
- 6.2 Strategic Moves
- 6.3 Market Positioning Analysis
- 6.4 Company Profiles (includes Global level Overview, Market level overview, Core Segments, Financials as available, Strategic Information, Market Rank/Share for key companies, Products and Services, and Recent Developments)
- 6.4.1 LVMH Moet Hennessy Louis Vuitton SE
- 6.4.2 Kering SA
- 6.4.3 Capri Holdings
- 6.4.4 Tapestry Inc.
- 6.4.5 VF Corporation
- 6.4.6 Chanel SA
- 6.4.7 Prada SpA
- 6.4.8 Skechers USA
- 6.4.9 Steve Madden
- 6.4.10 Deichmann SE
- 6.4.11 Clarks PLC
- 6.4.12 Nine West Holdings
- 6.4.13 The ALDO Group
- 6.4.14 Rothy's Inc.
- 6.4.15 Allbirds Inc.
- 6.4.16 DSW (Designer Brands Inc.)
- 6.4.17 LIR SRL
- 6.4.18 Bata Corp.
- 6.4.19 Hand M Group
- 6.4.20 Inditex (Zara)
7 MARKET OPPORTUNITIES AND FUTURE OUTLOOK

