PUBLISHER: Mordor Intelligence | PRODUCT CODE: 2113306

PUBLISHER: Mordor Intelligence | PRODUCT CODE: 2113306
Captive Power Plant - Market Share Analysis, Industry Trends & Statistics, Growth Forecasts (2026 - 2031)
According to Mordor Intelligence, captive power plant market size in 2026 is estimated at USD 241.6 billion, growing from 2025 value of USD 227.85 billion with 2031 projections showing USD 323.74 billion, growing at 6.03% CAGR over 2026-2031.
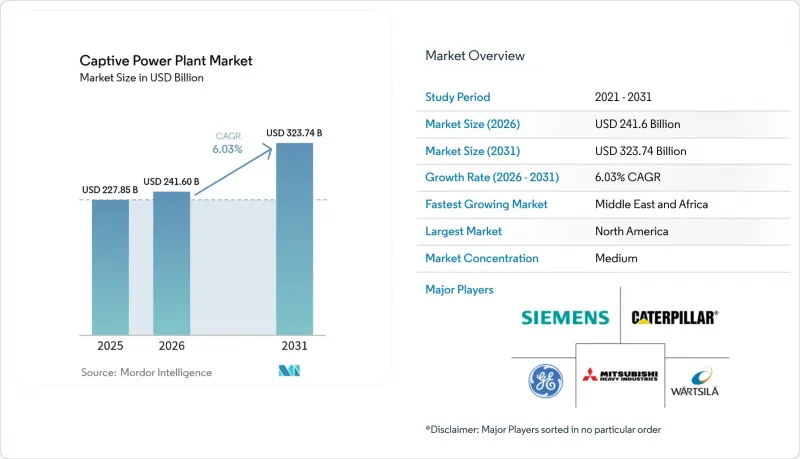
This report is Segmented by Fuel Source (Coal, Natural Gas, Diesel/HFO, Renewable, and Hybrid and Others), Capacity Range ( Up To 10 MW, 10 To 50 MW, 51 To 150 MW, and Above 150 MW), Technology (Reciprocating Engine, Combined Heat and Power, Renewable Microgrid, Fuel Cells/Hydrogen, and More), Industry (Metals and Minerals, Data Centre, and More), and Geography (North America, Asia-Pacific, and More).
Global Captive Power Plant Market Trends and Insights
Growing Industrial Electricity Demand & Unreliable Grids
Manufacturing reshoring, AI deployment, and process electrification are increasing industrial loads faster than utilities can build new transmission lines. CSIS projects that U.S. winter-peak demand will climb by 78 GW within a decade, eroding grid reserves and raising the probability of curtailments. Similar supply gaps emerge in Sub-Saharan Africa, where Nigeria generated a record 6,003 MW in 2024 but could dispatch only 5,700 MW on average due to network constraints. Industrial operators, therefore, install on-site plants to avoid lost production and to arbitrage tariffs; in India, captive units deliver power at rates below INR 5/kWh, compared to grid rates of nearly INR 8/kWh. This economic spread, coupled with reliability premiums, reinforces adoption across the captive power plant market.
Carbon-Reduction Push Toward Gas & Renewables
Corporate net-zero pledges are accelerating the shift away from coal and diesel toward natural gas and renewable energy configurations. The U.S. EPA's pending performance standards require large combustion turbines to meet a 3 ppm NOx limit on gas, effectively forcing the use of selective catalytic reduction for new projects. Equipment vendors responded with hydrogen-compatible machines; GE Vernova validated 100% H2 firing on its B- and E-class frames, achieving 4%-7% efficiency gains compared to legacy systems. Field pilots, such as Chevron's 60% hydrogen blend test in California, prove the pathway's technical feasibility. These developments lower long-term compliance risks and make low-carbon project financing more accessible, giving further momentum to the captive power plant market.
High CAPEX & OPEX Requirements
Combined-cycle and CHP projects can range from USD 5 million to USD 200 million, and balance-sheet constraints deter small firms despite the attractive long-term savings. Battery storage, vital for renewable microgrids, will only see 18%-52% capital-cost relief by 2035, limiting near-term ROI for many sites. Lease and third-party ownership models exist but add contractual complexity, so penetration remains skewed toward large conglomerates with investment-grade ratings. This financial hurdle curbs the captive power plant market in capital-scarce regions.
Other drivers and restraints analyzed in the detailed report include:
- Favourable Open-Access & Wheeling Regulations
- Data-Center Boom Demanding Mission-Critical Power
- Tightening Emission Norms on Fossil CPPs
For complete list of drivers and restraints, kindly check the Table Of Contents.
Segment Analysis
Diesel and heavy fuel oil retained 37.15% of the captive power plant market share in 2025, as legacy generators continue to backstop operations in remote areas where fuel logistics outweigh environmental costs. Renewable options, however, are scaling fastest at a projected 12.05% CAGR, propelled by falling solar-PV prices and corporate decarbonization mandates. Diesel units deliver tried-and-tested reliability and rapid ramping, yet their high operating cost and emissions expose users to carbon penalties, prompting a pivot toward gas and hybrid solar-battery architectures.
Natural-gas plants serve as a transitional technology, bridging the gap between reliability and emission objectives until hydrogen blends become more commonplace. Coal-based captive assets are moving toward strategic retirement, especially in markets with carbon pricing. Hybrid solar-storage projects reach parity with diesel on a levelized-cost basis in island and mining jurisdictions, accelerating fuel switching. These dynamics keep the captive power plant market diversified yet clearly trending toward renewables.
Units above 150 MW captured 33.75% of the captive power plant market size in 2025, thanks to economies of scale that suit steel, aluminum, and petrochemical clusters. Multi-shaft combined-cycle configurations utilize exhaust heat to generate process steam, thereby increasing overall efficiencies to above 60%.
Installations under 10 MW, although smaller, will clock the fastest 10.86% CAGR as standardized, containerized sets shorten lead times and reduce engineering costs. These micro-plants pair well with rooftop solar and energy-management systems, providing factories with tariff hedges without requiring grid expansion. As distributed energy resource rules evolve, numerous small projects collectively expand the captive power plant market.
Complete Report Scope:
- By Fuel Source
- Coal
- Natural Gas
- Diesel/HFO
- Renewable (Solar, Wind, Biomass, WHR)
- Hybrid and Others
- By Capacity Range
- Up to 10 MW
- 10 to 50 MW
- 51 to 150 MW
- Above 150 MW
- By Technology
- Gas Turbine
- Reciprocating Engine
- Combined Heat and Power (CHP)
- Renewable Microgrid (PV/Wind + BESS)
- Fuel Cells/Hydrogen
- By Industry
- Cement
- Metals and Minerals (incl Steel)
- Petrochemicals
- Data Centres
- Pulp and Paper
- Others
- By Geography
- North America
- United States
- Canada
- Mexico
- Europe
- Germany
- United Kingdom
- France
- Italy
- Russia
- Rest of Europe
- Asia-Pacific
- China
- India
- Japan
- South Korea
- ASEAN Countries
- Rest of Asia-Pacific
- South America
- Brazil
- Argentina
- Rest of South America
- Middle East and Africa
- Saudi Arabia
- United Arab Emirates
- South Africa
- Egypt
- Rest of Middle East and Africa
- North America
Geography Analysis
North America's 36.25% share is based on abundant shale gas, sophisticated project finance, and robust demand from data center hubs. U.S. electricity growth of 16% by 2029, confirmed by pipeline interconnection queues, underlines why factory and server-farm operators turn to on-site plants. High turbine backlogs favor early movers with equipment reservations, while Canada and Mexico contribute via mining and automotive investments in regions with constrained transmission.
Europe ranks second, characterized by stringent emission caps and generous incentives for cogeneration. Hydrogen-ready gas turbines gain prominence as Brussels targets industrial decarbonization, and combined-heat-and-power rules support integrated sites. Market participation mechanisms allow surplus power sales, further monetizing projects.
The Middle East & Africa region heads global growth at a 10.25% CAGR, fueled by industrial diversification and isolated resource projects. Governments deploy captive solar-plus-storage systems at mining camps and industrial zones, while natural-gas-rich Gulf states invest in hydrogen-ready turbines to meet load growth without derailing climate goals. Asia-Pacific's momentum rests on China and India, where captive generation supplies 14% of total industrial consumption and often beats utility tariffs by a wide margin. As grids strain, self-generation fills the gap, enlarging the captive power plant market.
- General Electric Company
- Siemens AG
- Wartsila Oyj Abp
- Caterpillar Inc.
- Mitsubishi Heavy Industries Ltd.
- Bharat Heavy Electricals Ltd.
- Kohler Co.
- Cummins Inc.
- ABB Ltd.
- Schneider Electric SE
- INNIO (GE Jenbacher)
- Capstone Green Energy Corp.
- Tata Power Renewable Energy
- AMP Solar Group Inc.
- JSW Energy Ltd.
- Vedanta Ltd.
- Jindal Steel & Power Ltd.
- ArcelorMittal SA
- Adani Power Ltd.
- Capital Power Corp.
- Rolls-Royce Holdings plc (mtu)
- Clarke Energy
- APR Energy
- MAN Energy Solutions SE
Additional Benefits:
- The market estimate (ME) sheet in Excel format
- 3 months of analyst support
TABLE OF CONTENTS
1 Introduction
- 1.1 Study Assumptions & Market Definition
- 1.2 Scope of the Study
2 Research Methodology
3 Executive Summary
4 Market Landscape
- 4.1 Market Overview
- 4.2 Market Drivers
- 4.2.1 Growing industrial electricity demand & unreliable grids
- 4.2.2 Carbon-reduction push toward gas & renewables
- 4.2.3 Favourable open-access & wheeling regulations
- 4.2.4 Data-centre boom demanding mission-critical power
- 4.2.5 Hydrogen-ready gas engines cut future compliance risk
- 4.2.6 AI-enabled predictive maintenance slashes OPEX
- 4.3 Market Restraints
- 4.3.1 High CAPEX & OPEX requirements
- 4.3.2 Tightening emission norms on fossil CPPs
- 4.3.3 Rise of off-site corporate PPAs reduces captive need
- 4.3.4 Turbine/BESS supply-chain bottlenecks lengthen lead-times
- 4.4 Supply-Chain Analysis
- 4.5 Regulatory Landscape
- 4.6 Technological Outlook
- 4.7 Porter's Five Forces
- 4.7.1 Bargaining Power of Suppliers
- 4.7.2 Bargaining Power of Buyers
- 4.7.3 Threat of New Entrants
- 4.7.4 Threat of Substitutes
- 4.7.5 Competitive Rivalry
5 Market Size & Growth Forecasts
- 5.1 By Fuel Source
- 5.1.1 Coal
- 5.1.2 Natural Gas
- 5.1.3 Diesel/HFO
- 5.1.4 Renewable (Solar, Wind, Biomass, WHR)
- 5.1.5 Hybrid and Others
- 5.2 By Capacity Range
- 5.2.1 Up to 10 MW
- 5.2.2 10 to 50 MW
- 5.2.3 51 to 150 MW
- 5.2.4 Above 150 MW
- 5.3 By Technology
- 5.3.1 Gas Turbine
- 5.3.2 Reciprocating Engine
- 5.3.3 Combined Heat and Power (CHP)
- 5.3.4 Renewable Microgrid (PV/Wind + BESS)
- 5.3.5 Fuel Cells/Hydrogen
- 5.4 By Industry
- 5.4.1 Cement
- 5.4.2 Metals and Minerals (incl Steel)
- 5.4.3 Petrochemicals
- 5.4.4 Data Centres
- 5.4.5 Pulp and Paper
- 5.4.6 Others
- 5.5 By Geography
- 5.5.1 North America
- 5.5.1.1 United States
- 5.5.1.2 Canada
- 5.5.1.3 Mexico
- 5.5.2 Europe
- 5.5.2.1 Germany
- 5.5.2.2 United Kingdom
- 5.5.2.3 France
- 5.5.2.4 Italy
- 5.5.2.5 Russia
- 5.5.2.6 Rest of Europe
- 5.5.3 Asia-Pacific
- 5.5.3.1 China
- 5.5.3.2 India
- 5.5.3.3 Japan
- 5.5.3.4 South Korea
- 5.5.3.5 ASEAN Countries
- 5.5.3.6 Rest of Asia-Pacific
- 5.5.4 South America
- 5.5.4.1 Brazil
- 5.5.4.2 Argentina
- 5.5.4.3 Rest of South America
- 5.5.5 Middle East and Africa
- 5.5.5.1 Saudi Arabia
- 5.5.5.2 United Arab Emirates
- 5.5.5.3 South Africa
- 5.5.5.4 Egypt
- 5.5.5.5 Rest of Middle East and Africa
- 5.5.1 North America
6 Competitive Landscape
- 6.1 Market Concentration
- 6.2 Strategic Moves (M&A, Partnerships, PPAs)
- 6.3 Market Share Analysis (Market Rank/Share for key companies)
- 6.4 Company Profiles (includes Global level Overview, Market level overview, Core Segments, Financials as available, Strategic Information, Products & Services, and Recent Developments)
- 6.4.1 General Electric Company
- 6.4.2 Siemens AG
- 6.4.3 Wartsila Oyj Abp
- 6.4.4 Caterpillar Inc.
- 6.4.5 Mitsubishi Heavy Industries Ltd.
- 6.4.6 Bharat Heavy Electricals Ltd.
- 6.4.7 Kohler Co.
- 6.4.8 Cummins Inc.
- 6.4.9 ABB Ltd.
- 6.4.10 Schneider Electric SE
- 6.4.11 INNIO (GE Jenbacher)
- 6.4.12 Capstone Green Energy Corp.
- 6.4.13 Tata Power Renewable Energy
- 6.4.14 AMP Solar Group Inc.
- 6.4.15 JSW Energy Ltd.
- 6.4.16 Vedanta Ltd.
- 6.4.17 Jindal Steel & Power Ltd.
- 6.4.18 ArcelorMittal SA
- 6.4.19 Adani Power Ltd.
- 6.4.20 Capital Power Corp.
- 6.4.21 Rolls-Royce Holdings plc (mtu)
- 6.4.22 Clarke Energy
- 6.4.23 APR Energy
- 6.4.24 MAN Energy Solutions SE
7 Market Opportunities & Future Outlook
- 7.1 White-Space & Unmet-Need Assessment

