PUBLISHER: Mordor Intelligence | PRODUCT CODE: 2113465

PUBLISHER: Mordor Intelligence | PRODUCT CODE: 2113465
North America Orange - Market Share Analysis, Industry Trends & Statistics, Growth Forecasts (2026 - 2031)
According to Mordor Intelligence, the North America orange market size is projected to increase from USD 10.44 billion in 2025 to USD 10.82 billion in 2026 and reach USD 13.51 billion by 2031, growing at a CAGR of 4.54% over 2026-2031.
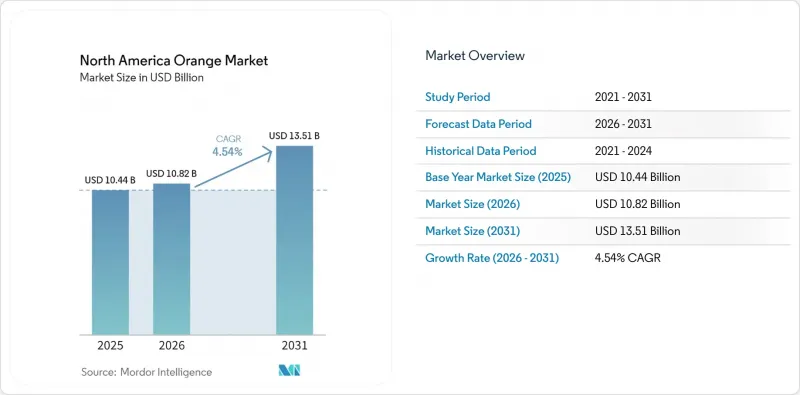
This report is Segmented by Geography (United States and More). The Report Includes Production Analysis (Volume), Consumption Analysis (Value and Volume), Export Analysis (Value and Volume), Import Analysis (Value and Volume), Wholesale Price Trend Analysis, and More. The Market Forecasts are Provided in Terms of Value (USD) and Volume (Metric Tons).
North America Orange Market Trends and Insights
Climate-Resilient Cultivar Adoption
Growers across Florida, Texas, Veracruz, and Tamaulipas are grafting Sugar Belle, Tango, and other tolerant varieties that retain soluble solids content even at higher ambient temperatures. In April 2025, the University of Florida Institute of Food and Agricultural Sciences released six HLB-tolerant varieties including sweet orange selections OLL-DC-3-40 and OLL-DC-3-36 and mandarin hybrids C4-10-42 and RBA 13-18, developed specifically to restore Brix and soluble solids in not-from-concentrate processor blends, with The United States Department of Agriculture Agricultural Research Service (USDA ARS) separately advancing Brixy, an HLB-tolerant selection averaging approximately 12.3 Brix across replicated Florida trials. Mexican producers replanted with Valencia on Swingle citrumelo rootstock after a 55.5% production jump in early 2025, signaling confidence in longer-term yield stability. Adoption remains uneven because Florida's older growers face a three- to five-year payback and fear additional disease flare-ups. The transition nevertheless underpins Mexico's outperformance as newer orchards enter peak production just as legacy Florida groves reach removal age.
Surge in Not-From-Concentrate (NFC) Juice Contracts
Processors are increasingly negotiating multi-year supply agreements that guarantee fresh-fruit volumes and establish floor prices indexed to wholesale fresh-fruit benchmarks, helping insulate growers from frozen-concentrate price volatility. Investments in cold-storage capacity and premium product portfolios are strengthening supply chain resilience and supporting the production of higher-value juice products. Mexico benefits from shorter transit times to major processing hubs in the United States, preserving fruit quality during transportation. In Canada, a duty-free trade environment improves the competitiveness of not-from-concentrate (NFC) juice by enabling retailers to offer competitively priced products despite refrigeration costs. By linking grower revenues to NFC premiums, these developments improve farm-gate returns and encourage continued investment in orchard rehabilitation and productivity improvements.
Labor Shortages During Harvest Peaks
California's reliance on guest workers faltered in 2025 when H-2A approvals slipped eight weeks behind schedule, forcing growers to hire spot crews at 20% wage premiums. Florida's farm labor pool eroded as groves were abandoned due to huanglongbing, leaving pickers to compete for jobs in other crops offering steadier year-round jobs. Mexico traditionally relied on an abundant seasonal workforce, yet manufacturing expansion in Tamaulipas and Nuevo Leon is now pulling labor away from agriculture, lifting orchard day rates. With peak harvest compressed into November-to-March windows, every lost day converts to lower juice-solids yields, reducing processor throughput and inflating input costs.
Other drivers and restraints analyzed in the detailed report include:
- Integrated Pest-Management Diffusion
- Government Re-Planting Subsidies
- Water-Use Regulations Tightening
For complete list of drivers and restraints, kindly check the Table Of Contents.
Complete Report Scope:
- By Geography
- North America
- United States
- Production Analysis (Area Harvested, Yield, and Production Volume)
- Consumption Analysis (Consumption Value and Volume)
- Import Market Analysis (Import Value, Volume, and Key Supplying Markets)
- Export Market Analysis (Export Value, Volume, and Key Destination Markets)
- Wholesale Price Trend Analysis and Forecast
- Regulatory Framework
- List of Key Players
- Logistics and Infrastructure
- Seasonality Analysis
- Mexico
- Production Analysis (Area Harvested, Yield, and Production Volume)
- Consumption Analysis (Consumption Value and Volume)
- Import Market Analysis (Import Value, Volume, and Key Supplying Markets)
- Export Market Analysis (Export Value, Volume, and Key Destination Markets)
- Wholesale Price Trend Analysis and Forecast
- Regulatory Framework
- List of Key Players
- Logistics and Infrastructure
- Seasonality Analysis
- Canada
- Production Analysis (Area Harvested, Yield, and Production Volume)
- Consumption Analysis (Consumption Value and Volume)
- Import Market Analysis (Import Value, Volume, and Key Supplying Markets)
- Export Market Analysis (Export Value, Volume, and Key Destination Markets)
- Wholesale Price Trend Analysis and Forecast
- Regulatory Framework
- List of Key Players
- Logistics and Infrastructure
- Seasonality Analysis
- United States
- North America
Additional Benefits:
- The market estimate (ME) sheet in Excel format
- 3 months of analyst support
TABLE OF CONTENTS
1 INTRODUCTION
- 1.1 Study Assumptions and Market Definition
- 1.2 Scope of the Study
2 RESEARCH METHODOLOGY
3 EXECUTIVE SUMMARY
4 MARKET LANDSCAPE
- 4.1 Market Overview
- 4.2 Market Drivers
- 4.2.1 Climate-resilient cultivar adoption
- 4.2.2 Surge in not-from-concentrate (NFC) juice contracts
- 4.2.3 Integrated pest-management diffusion
- 4.2.4 Orchard automation and robotics uptake
- 4.2.5 Government re-planting subsidies
- 4.2.6 Rising health-driven per-capita juice intake
- 4.3 Market Restraints
- 4.3.1 Labor shortages during harvest peaks
- 4.3.2 Water-use regulations tightening
- 4.3.3 Price volatility in frozen concentrated orange juice (FCOJ) futures
- 4.3.4 Rising plant-based beverage substitutes
- 4.4 Opportunities
- 4.5 Challenges
- 4.6 Value Chain Analysis
- 4.7 Technologies and usage of AI in the Industry
- 4.8 Input Market Analysis
- 4.8.1 Seeds/Saplings
- 4.8.2 Fertilizers
- 4.8.3 Crop Protection Chemicals
- 4.9 Distribution Channel Analysis
- 4.10 Market Sentiment Analysis
- 4.11 PESTLE Analysis
5 MARKET SIZE AND GROWTH FORECASTS (VALUE AND VOLUME)
- 5.1 By Geography
- 5.1.1 North America
- 5.1.1.1 United States
- 5.1.1.1.1 Production Analysis (Area Harvested, Yield, and Production Volume)
- 5.1.1.1.2 Consumption Analysis (Consumption Value and Volume)
- 5.1.1.1.3 Import Market Analysis (Import Value, Volume, and Key Supplying Markets)
- 5.1.1.1.4 Export Market Analysis (Export Value, Volume, and Key Destination Markets)
- 5.1.1.1.5 Wholesale Price Trend Analysis and Forecast
- 5.1.1.1.6 Regulatory Framework
- 5.1.1.1.7 List of Key Players
- 5.1.1.1.8 Logistics and Infrastructure
- 5.1.1.1.9 Seasonality Analysis
- 5.1.1.2 Mexico
- 5.1.1.2.1 Production Analysis (Area Harvested, Yield, and Production Volume)
- 5.1.1.2.2 Consumption Analysis (Consumption Value and Volume)
- 5.1.1.2.3 Import Market Analysis (Import Value, Volume, and Key Supplying Markets)
- 5.1.1.2.4 Export Market Analysis (Export Value, Volume, and Key Destination Markets)
- 5.1.1.2.5 Wholesale Price Trend Analysis and Forecast
- 5.1.1.2.6 Regulatory Framework
- 5.1.1.2.7 List of Key Players
- 5.1.1.2.8 Logistics and Infrastructure
- 5.1.1.2.9 Seasonality Analysis
- 5.1.1.3 Canada
- 5.1.1.3.1 Production Analysis (Area Harvested, Yield, and Production Volume)
- 5.1.1.3.2 Consumption Analysis (Consumption Value and Volume)
- 5.1.1.3.3 Import Market Analysis (Import Value, Volume, and Key Supplying Markets)
- 5.1.1.3.4 Export Market Analysis (Export Value, Volume, and Key Destination Markets)
- 5.1.1.3.5 Wholesale Price Trend Analysis and Forecast
- 5.1.1.3.6 Regulatory Framework
- 5.1.1.3.7 List of Key Players
- 5.1.1.3.8 Logistics and Infrastructure
- 5.1.1.3.9 Seasonality Analysis
- 5.1.1.1 United States
- 5.1.1 North America
6 END USE APPLICATIONS AND INDUSTRIES
- 6.1 Primary Applications and Emerging Applications
- 6.2 Consumption Breakdown by Industries
7 COMPETITIVE LANDSCAPE
- 7.1 Overview of the Competition
- 7.2 Recent Developments
- 7.3 Market Concentration Analysis
8 MARKET OPPORTUNITIES AND FUTURE OUTLOOK

