PUBLISHER: Mordor Intelligence | PRODUCT CODE: 2113642

PUBLISHER: Mordor Intelligence | PRODUCT CODE: 2113642
Well Intervention - Market Share Analysis, Industry Trends & Statistics, Growth Forecasts (2026 - 2031)
According to Mordor Intelligence, the well intervention market size was valued at USD 9.76 billion in 2025 and estimated to grow from USD 10.29 billion in 2026 to reach USD 13.43 billion by 2031, at a CAGR of 5.47% during the forecast period (2026-2031).
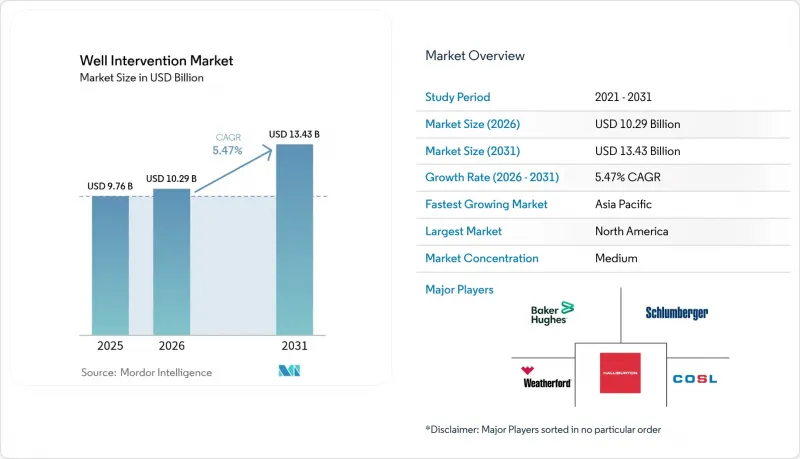
This report is Segmented by Location of Deployment (Onshore and Offshore), Service Type (Logging and Bottom-Hole Survey, Stimulation, and More), Intervention Type (Light, Medium, and Heavy/Workover), Well Type (Horizontal Wells and Vertical Wells), Well Depth (Shallow Water, Deep Water (400 To 1500 M), and Ultra-Deep Water ), and Geography (North America, Europe, Asia Pacific, South America, and More).
Global Well Intervention Market Trends and Insights
Rising Workover Demand from Maturing Onshore Wells
North American and European operators stretch asset life cycles by prioritizing workover programs over fresh drilling. Wells drilled during the 2010-2015 shale expansion need artificial-lift upgrades, stimulation, and mechanical repairs that typically secure 20-30% production uplifts versus 5-10% gains from drilling new wells in mature fields. Baker Hughes completed more than 15,000 artificial-lift installations in 2024, 60% of which were in North American onshore basins. Recurring interventions across extended asset life cycles offer steady revenue to service providers and underscore operators' capital discipline and return-on-existing-infrastructure strategies.
Escalation of Deep- and Ultra-Deep-Water Developments
Ultra-deep-water projects beyond 1,500 m depth are raising technical complexity and service premiums. Chevron's 20,000 psi Anchor project in the Gulf of Mexico illustrates the specialized equipment needed to execute interventions safely and efficiently. Service prices in deep water stand 40-60% above shallow-water rates. Petrobras awarded SLB a USD 1.8 billion deep-water intervention contract across pre-salt fields in 2024, signaling robust investment in complex offshore plays. Rigless intervention technologies mitigate cost exposure by replacing ultra-expensive drillships, but deep-water barriers to entry still favor established multinationals with integrated capability suites.
Crude-Price Volatility Curbing E&P Capex Cycles
Every dip below USD 55 per barrel triggers 15-25% cuts in intervention budgets as operators defer non-essential projects. Offshore rig utilization slipped in 2024, revealing a direct link between spot pricing and discretionary intervention work scopes. Service revenues swing by up to 40% across cycles, forcing providers to manage cost bases and maintain flexible crews. Capital discipline anchored on free-cash-flow metrics remains a primary check on well intervention market growth until commodity prices stabilize.
Other drivers and restraints analyzed in the detailed report include:
- Shale Revival in North America Fuelling Re-fracturing Jobs
- Mandated Methane-Leak Remediation Interventions
- Growing Preference for Rigless Completions
For complete list of drivers and restraints, kindly check the Table Of Contents.
Segment Analysis
Offshore interventions generated robust revenue in 2025, and the segment is positioned for a 6.78% CAGR through 2031 as deep-water and ultra-deep-water wells drive premium-rate work. These high-specification projects underpin a sizeable portion of the well intervention market, and service prices often sit 40-60% above onshore equivalents. Riserless-light-well-intervention vessels, typified by Expro's AX-S system, can finish offshore jobs in 6-8 days versus 15-20 days for conventional rig support. Operators value reduced downtime and safer crew counts, reinforcing offshore demand despite elevated capital intensity.
Onshore operations still dominate with a 73.25% share in 2025 because thousands of aging shale wells need periodic workovers, artificial-lift changes, and stimulation refresh cycles. Lower unit costs and greater accessibility allow frequent interventions, and upgraded coiled-tubing units shave 20-30% from historical service bills. Asia Pacific and Latin America join North America as active onshore hubs as energy demand and domestic resource development accelerate.
Stimulation services rule the growth table with a forecast 7.35% CAGR through 2031. Advances such as emulsified acids, zipper fracturing, and simul-frac enhance contact efficiency while lowering horsepower requirements; Baker Hughes' OptiPort technology demonstrates better proppant distribution and reduced surface equipment footprint. Operators prioritize these high-impact treatments when commodity prices justify the incremental uplift.
Logging and bottom-hole survey services preserve a 31.90% share because reservoir imaging and mechanical diagnostics remain prerequisites for effective intervention planning. Fiber-optic conveyance and real-time analytics shorten decision loops, letting crews adjust operations on the fly. Artificial-lift, workover and fishing, and niche services such as zonal isolation round out portfolios by solving specific down-hole challenges that surface during production declines or equipment failures.
Complete Report Scope:
- By Location of Deployment
- Onshore
- Offshore
- By Service Type
- Logging and Bottom-hole Survey
- Stimulation
- Artificial Lift
- Workover and Fishing
- Others (Zonal Isolation, Sand Control etc.)
- By Intervention Type
- Light (Slickline, E-line, CT)
- Medium
- Heavy/Workover
- By Well Type
- Horizontal wells
- Vertical wells
- By Well Depth
- Shallow Water (Below 400 m)
- Deep Water (400 to 1,500 m)
- Ultra-Deep Water (Above 1,500 m)
- By Geography
- North America
- United States
- Canada
- Mexico
- Europe
- United Kingdom
- Norway
- Germany
- Russia
- Rest of Europe
- Asia Pacific
- China
- India
- Japan
- ASEAN Countries
- Australia
- Rest of Asia Pacific
- South America
- Brazil
- Argentina
- Rest of South America
- Middle East and Africa
- Saudi Arabia
- United Arab Emirates
- Qatar
- South Africa
- Rest of Middle East and Africa
- North America
Geography Analysis
North America held 38.95% of the well intervention market in 2025 as prolific shale basins, tough methane regulations, and deep-water Gulf of Mexico assets combine to sustain high service intensity. Operators leverage digital slickline, real-time fiber-optic tools, and autonomous robotics to improve efficiency by 20-30% while meeting stringent environmental standards. Recurring refrac campaigns maintain capacity utilization for pressure pumping fleets even when fresh drilling slows.
Europe follows with a mature yet active theater anchored by the North Sea. Norway and the UK incentivize late-life asset optimization, and carbon-capture storage conversions add fresh intervention demand streams. Stringent ESG policies elevate methane remediation and well-integrity management to core operating priorities, prompting technology-heavy service contracts.
Asia Pacific is the fastest-growing well intervention market fastest-growing region, set for a 6.28% CAGR through 2031. Strong energy demand, supportive government policies, and ambitious offshore gas projects in Southeast Asia spur the deployment of advanced intervention technologies. China's voracious land rig appetite and India's upstream liberalization add scale, while Australia's mature offshore fields require sophisticated interventions to sustain LNG export infrastructure.
- Schlumberger Limited
- Halliburton Company
- Baker Hughes Company
- Weatherford International plc
- Expro Group Holdings NV
- National Oilwell Varco Inc.
- Vallourec SA
- Scientific Drilling International
- China Oilfield Services Ltd (COSL)
- Helix Energy Solutions Group Inc.
- Archer Ltd.
- Welltec A/S
- Superior Energy Services Inc.
- Trican Well Service Ltd.
- Aker Solutions ASA
- Altus Intervention AS
- Hunting PLC
- TechnipFMC plc
- Petrofac Ltd.
- Oceaneering International Inc.
Additional Benefits:
- The market estimate (ME) sheet in Excel format
- 3 months of analyst support
TABLE OF CONTENTS
1 Introduction
- 1.1 Study Assumptions & Market Definition
- 1.2 Scope of the Study
2 Research Methodology
3 Executive Summary
4 Market Landscape
- 4.1 Market Overview
- 4.2 Market Drivers
- 4.2.1 Rising workover demand from maturing onshore wells
- 4.2.2 Escalation of deep- and ultra-deep-water developments
- 4.2.3 Shale revival in North America fuelling re-fracturing jobs
- 4.2.4 Mandated methane-leak remediation interventions
- 4.2.5 Adoption of digital slickline & autonomous down-hole robots
- 4.2.6 Emerging carbon-capture & storage (CCS) well conversions
- 4.3 Market Restraints
- 4.3.1 Crude-price volatility curbing E&P capex cycles
- 4.3.2 Growing preference for rigless completions
- 4.3.3 ESG-driven capital flight from hydrocarbons
- 4.4 Supply-Chain Analysis
- 4.5 Regulatory Landscape
- 4.6 Technological Outlook
- 4.7 Major Upcoming Upstream Projects
- 4.8 Porter's Five Forces
- 4.8.1 Bargaining Power of Suppliers
- 4.8.2 Bargaining Power of Buyers
- 4.8.3 Threat of New Entrants
- 4.8.4 Threat of Substitute Products & Services
- 4.8.5 Intensity of Competitive Rivalry
5 Market Size & Growth Forecasts
- 5.1 By Location of Deployment
- 5.1.1 Onshore
- 5.1.2 Offshore
- 5.2 By Service Type
- 5.2.1 Logging and Bottom-hole Survey
- 5.2.2 Stimulation
- 5.2.3 Artificial Lift
- 5.2.4 Workover and Fishing
- 5.2.5 Others (Zonal Isolation, Sand Control etc.)
- 5.3 By Intervention Type
- 5.3.1 Light (Slickline, E-line, CT)
- 5.3.2 Medium
- 5.3.3 Heavy/Workover
- 5.4 By Well Type
- 5.4.1 Horizontal wells
- 5.4.2 Vertical wells
- 5.5 By Well Depth
- 5.5.1 Shallow Water (Below 400 m)
- 5.5.2 Deep Water (400 to 1,500 m)
- 5.5.3 Ultra-Deep Water (Above 1,500 m)
- 5.6 By Geography
- 5.6.1 North America
- 5.6.1.1 United States
- 5.6.1.2 Canada
- 5.6.1.3 Mexico
- 5.6.2 Europe
- 5.6.2.1 United Kingdom
- 5.6.2.2 Norway
- 5.6.2.3 Germany
- 5.6.2.4 Russia
- 5.6.2.5 Rest of Europe
- 5.6.3 Asia Pacific
- 5.6.3.1 China
- 5.6.3.2 India
- 5.6.3.3 Japan
- 5.6.3.4 ASEAN Countries
- 5.6.3.5 Australia
- 5.6.3.6 Rest of Asia Pacific
- 5.6.4 South America
- 5.6.4.1 Brazil
- 5.6.4.2 Argentina
- 5.6.4.3 Rest of South America
- 5.6.5 Middle East and Africa
- 5.6.5.1 Saudi Arabia
- 5.6.5.2 United Arab Emirates
- 5.6.5.3 Qatar
- 5.6.5.4 South Africa
- 5.6.5.5 Rest of Middle East and Africa
- 5.6.1 North America
6 Competitive Landscape
- 6.1 Market Concentration
- 6.2 Strategic Moves (M&A, Partnerships, PPAs)
- 6.3 Market Share Analysis (Market Rank/Share for key companies)
- 6.4 Company Profiles (includes Global level Overview, Market level overview, Core Segments, Financials as available, Strategic Information, Products & Services, and Recent Developments)
- 6.4.1 Schlumberger Limited
- 6.4.2 Halliburton Company
- 6.4.3 Baker Hughes Company
- 6.4.4 Weatherford International plc
- 6.4.5 Expro Group Holdings NV
- 6.4.6 National Oilwell Varco Inc.
- 6.4.7 Vallourec SA
- 6.4.8 Scientific Drilling International
- 6.4.9 China Oilfield Services Ltd (COSL)
- 6.4.10 Helix Energy Solutions Group Inc.
- 6.4.11 Archer Ltd.
- 6.4.12 Welltec A/S
- 6.4.13 Superior Energy Services Inc.
- 6.4.14 Trican Well Service Ltd.
- 6.4.15 Aker Solutions ASA
- 6.4.16 Altus Intervention AS
- 6.4.17 Hunting PLC
- 6.4.18 TechnipFMC plc
- 6.4.19 Petrofac Ltd.
- 6.4.20 Oceaneering International Inc.
7 Market Opportunities & Future Outlook
- 7.1 White-space & Unmet-need Assessment

