PUBLISHER: Mordor Intelligence | PRODUCT CODE: 2113848

PUBLISHER: Mordor Intelligence | PRODUCT CODE: 2113848
X-ray Security Scanner - Market Share Analysis, Industry Trends & Statistics, Growth Forecasts (2026 - 2031)
According to Mordor Intelligence, the x-ray security scanner market size reached USD 6.42 billion in 2026 and is forecast to rise to USD 10.64 billion by 2031, reflecting a 10.64% CAGR across the period.
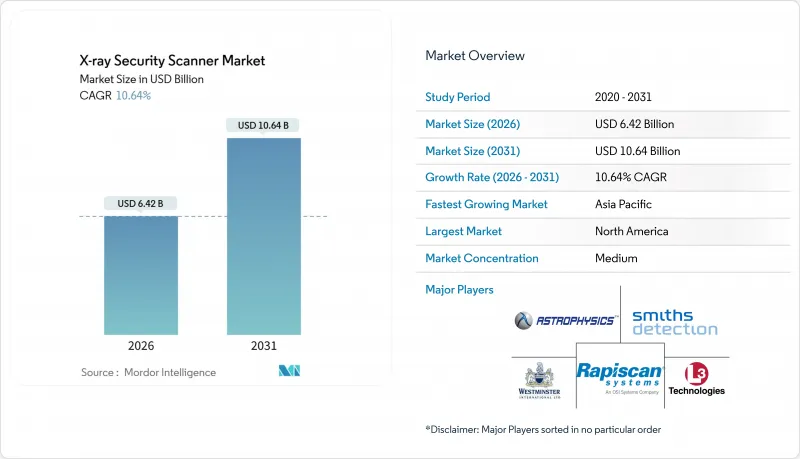
This report is Segmented by Application (People Screening, Product Screening With Mail and Parcel, and Cargo and Baggage), End-User Industry (Aviation and Transportation, and More), Scanner Configuration (Single-View, Dual-View, and Computed-Tomography/3-D View), Imaging Dimension (2-D Imaging, and 3-D/Volumetric Imaging), and Geography. The Market Forecasts are Provided in Terms of Value (USD).
Global X-ray Security Scanner Market Trends and Insights
Heightened Enforcement of 100% Air-Cargo Screening Mandates
Freight forwarders and airlines have lost exemptions that once allowed known-shipper cargo to bypass X-ray inspection. The Transportation Security Administration enlarged its Air Cargo Advance Screening program in 2024, requiring electronic manifests a full day before loading, then routing higher-risk pallets to CT or dual-energy units capable of detecting sheet explosives under 100 g. In 2025 the European Union Aviation Safety Agency imposed a volumetric-imaging requirement for cargo over 150 kg, covering 78% of wide-body belly freight. Legacy single-view tunnels cannot meet these criteria because they lack atomic-number segmentation, so airports and ground-handling agents are accelerating refresh cycles. Integrators report that inline CT retrofits now represent 44% of new cargo projects in North America, compressing procurement timelines to under 18 months. Vendors that offer modular control software compatible with federal risk-based targeting interfaces are winning bids because they minimize integration risk.
Relaxation of 100 ml Liquid Ban Driving EU Airport CT Scanner Roll-outs
In 2024 the European Commission permitted member states to scrap the 100 ml carry-on liquid limit if checkpoints deploy C3-certified CT. Frankfurt Airport finished 42 CT lanes by December 2025, boosting passenger throughput 18% after laptops and liquids stayed inside bags. Charles de Gaulle Airport allocated EUR 120 million (USD 128 million) to refit 68 lanes by 2027. Although London Heathrow and Amsterdam Schiphol briefly reinstated the liquid rule in mid-2024 because of false-positive rates above 8%, software patches have since cut alarms below 4%, clearing a path to resume phase-in. Airport operators now view CT as essential not only for security compliance but also for customer-experience metrics that airlines use in slot-allocation negotiations.
High CAPEX of CT and Dual-Energy Systems for Tier-2 Airports
CT checkpoint scanners carry unit prices of USD 2.5 million to USD 3.2 million, about four times dual-view tunnels, and regional airports that process under 5 million passengers annually struggle to fund upgrades. In 2025 the Transportation Security Administration allocated USD 1.3 billion for 469 CT units, but U.S. tier-2 airports lacked matching grants and deferred projects. European operators face similar hurdles: 62% of airports below 3 million passengers postponed CT adoption in 2024, opting to extend the life of single-view tunnels through software patches. Leasing programs spread payments over seven to ten years yet add about 30% to total cost of ownership, squeezing operating margins. Without new financing tools, many smaller airports will remain outside the CT upgrade cycle through the medium term.
Other drivers and restraints analyzed in the detailed report include:
- E-commerce Parcel Volumes Forcing High-Throughput Dual-View Systems
- Urban Metro Expansions in Asia Pacific Requiring Compact Drive-Through Scanners
- Public Health and Privacy Pushback on People Scanners at Stadiums
For complete list of drivers and restraints, kindly check the Table Of Contents.
Segment Analysis
Mail and parcel inspection is forecast to advance at a 10.87% CAGR through 2031, overtaking many legacy aviation projects. Universal Postal Union data show that international parcels will reach 1.8 billion by 2027, forcing postal operators to add orthogonal-view tunnels that scan at belt speeds above 1 m/s. United States Postal Service hubs adopted 127 high-speed systems in 2024, and UPS paired them with neural-network triage that cut secondary manual reviews to single-digit levels. These shifts underline how parcel operators, not airlines, are now dictating image-analysis roadmaps to vendors.
Cargo and baggage screening still represents the largest slice of the X-ray security scanner market size, powered by regulators that insist on 100% cargo inspection. The Transportation Security Administration bought 469 CT units for checkpoints in 2025, each averaging USD 2.77 million. Meanwhile, EASA rules require freight above 150 kg to undergo volumetric imaging, accelerating the replacement of single-view tunnels. People-screening deployments continue in urban transit, but privacy objections have slowed backscatter use in stadiums, nudging operators toward millimeter-wave alternatives.
Commercial facilities (retail, hospitality, and corporate campuses) are projected to grow at an 11.41% CAGR through 2031 as insurers link lower premiums to perimeter screening. Data-center operators now place portals at loading docks after a 2024 breach in Virginia, and hotels follow Department of Homeland Security guidance designating them soft targets. Some retailers pilot exit-lane tunnels tied to RFID tags, cutting shrink by 12% in test stores, evidence that security scanners are migrating from high-risk aviation to everyday commercial settings.
Aviation remains dominant, with 52.8% 2025 market share, propelled by Transportation Security Administration CT contracts and Leidos's USD 2.6 billion services deal covering 440 airports. Border agencies are also modernizing: U.S. Customs and Border Protection awarded USD 198 million for next-generation cargo scanners in 2024, embedding dual-energy discrimination to spot narcotics precursors. Critical-infrastructure sectors such as power plants now install portals to comply with North American Electric Reliability Corporation physical-security rules.
Complete Report Scope:
- By Application
- People Screening
- Product Screening
- Mail and Parcel
- Cargo and Baggage
- By End-user Industry
- Aviation and Transportation
- Law Enforcement
- Commercial (Retail, Hospitality, Corporate)
- Government and Border Security
- Critical Infrastructure (Energy, Nuclear, Data Centers)
- By Scanner Configuration
- Single-view
- Dual-view
- Computed-Tomography / 3-D View
- By Imaging Dimension
- 2-D Imaging
- 3-D / Volumetric Imaging
- By Geography
- North America
- United States
- Canada
- Mexico
- Rest of North America
- South America
- Brazil
- Argentina
- Chile
- Rest of South America
- Europe
- United Kingdom
- Germany
- France
- Italy
- Rest of Europe
- Asia Pacific
- China
- India
- Japan
- South Korea
- Rest of Asia Pacific
- Middle East
- Saudi Arabia
- United Arab Emirates
- Qatar
- Rest of Middle East
- Africa
- South Africa
- Nigeria
- Kenya
- Rest of Africa
- North America
Geography Analysis
Asia Pacific is expected to deliver an 11.26% CAGR to 2031, the fastest trajectory worldwide. China operated 10,287 km of urban rail in 2024, while India added 614 km between 2020 and 2025, and both require X-ray bag checks at metro entrances. Delhi Metro's 288 tunnels scan 400 bags per peak-hour cycle, and Singapore reduced false alarms 34% by adding AI classifiers. Airport modernizations remain selective; India's tier-2 airports continue to favour dual-view retrofits while awaiting federal funding for CT.
North America held 35.1% of 2025 revenue. The Transportation Security Administration's 469-unit CT order and Leidos's USD 2.6 billion logistics contract underline steady federal spending. U.S. border modernization also accelerates: Customs and Border Protection ordered USD 198 million in portals for land crossings. Canada allocated CAD 89 million (USD 66 million) to refresh scanners at the Ambassador Bridge and Peace Arch, while Mexico pilots CT lanes in Mexico City and Cancun.
Europe captured roughly 28% of 2025 turnover. Frankfurt and Paris airports are on track for full CT coverage by 2027, yet Heathrow and Schiphol resets show rollout risks. Middle Eastern hubs align with Gulf infrastructure spending: Dubai and Abu Dhabi expansions under UAE Vision 2030 prioritize CT and dual-energy deployments. Saudi Arabia's Public Investment Fund earmarked USD 800 billion for general infrastructure, including aviation security upgrades. South America and Africa remain nascent, though South Africa's Airports Company installed 14 CT lanes in 2024.
- Smiths Detection Group Ltd.
- OSI Systems, Inc.
- Leidos, Inc.
- L3Harris Technologies, Inc.
- Nuctech Company Limited
- Astrophysics Inc.
- Westminster Group Plc
- Adani Systems Inc.
- Autoclear, LLC
- Aventura Technologies, Inc.
- Analogic Corporation
- CEIA S.p.A.
- VOTI Detection Inc.
- VMI Security B.V.
- Gilardoni S.p.A.
- Viken Detection Corporation
- Teledyne Technologies Incorporated
- OR Technology (Oehler Research Technology GmbH)
- ZKTeco Co., Ltd.
- NU Clear Advanced Security Ltd.
Additional Benefits:
- The market estimate (ME) sheet in Excel format
- 3 months of analyst support
TABLE OF CONTENTS
1 INTRODUCTION
- 1.1 Study Assumptions and Market Definition
- 1.2 Scope of the Study
2 RESEARCH METHODOLOGY
3 EXECUTIVE SUMMARY
4 MARKET LANDSCAPE
- 4.1 Market Overview
- 4.2 Market Drivers
- 4.2.1 Heightened Enforcement of 100% Air-Cargo Screening Mandates
- 4.2.2 Relaxation of 100 ml Liquid Ban Driving EU Airport CT Scanner Roll-outs
- 4.2.3 E-commerce Parcel Volumes Forcing High-Throughput Dual-View Systems
- 4.2.4 Urban Metro Expansions in Asia Pacific Requiring Compact Drive-Through Scanners
- 4.2.5 Spectral Imaging Integration Enabling Automated Contraband Classification
- 4.2.6 Subscription-Based "Screening-as-a-Service" Models for Tier-2 Airports
- 4.3 Market Restraints
- 4.3.1 High CAPEX of CT and Dual-Energy Systems for Tier-2 Airports
- 4.3.2 Public Health and Privacy Pushback on People Scanners at Stadiums
- 4.3.3 Export-Control Barriers on Dual-Use Detector Exports
- 4.3.4 Millimeter-Wave Alternatives Reducing X-ray Scanner Adoption in Low-Dose Scenarios
- 4.4 Impact of Macroeconomic Factors on the Market
- 4.5 Industry Value-Chain Analysis
- 4.6 Regulatory Outlook
- 4.7 Technological Outlook
- 4.8 Porter's Five Forces Analysis
- 4.8.1 Bargaining Power of Suppliers
- 4.8.2 Bargaining Power of Buyers
- 4.8.3 Threat of New Entrants
- 4.8.4 Threat of Substitutes
- 4.8.5 Intensity of Competitive Rivalry
5 MARKET SIZE AND GROWTH FORECASTS (VALUE)
- 5.1 By Application
- 5.1.1 People Screening
- 5.1.2 Product Screening
- 5.1.2.1 Mail and Parcel
- 5.1.2.2 Cargo and Baggage
- 5.2 By End-user Industry
- 5.2.1 Aviation and Transportation
- 5.2.2 Law Enforcement
- 5.2.3 Commercial (Retail, Hospitality, Corporate)
- 5.2.4 Government and Border Security
- 5.2.5 Critical Infrastructure (Energy, Nuclear, Data Centers)
- 5.3 By Scanner Configuration
- 5.3.1 Single-view
- 5.3.2 Dual-view
- 5.3.3 Computed-Tomography / 3-D View
- 5.4 By Imaging Dimension
- 5.4.1 2-D Imaging
- 5.4.2 3-D / Volumetric Imaging
- 5.5 By Geography
- 5.5.1 North America
- 5.5.1.1 United States
- 5.5.1.2 Canada
- 5.5.1.3 Mexico
- 5.5.1.4 Rest of North America
- 5.5.2 South America
- 5.5.2.1 Brazil
- 5.5.2.2 Argentina
- 5.5.2.3 Chile
- 5.5.2.4 Rest of South America
- 5.5.3 Europe
- 5.5.3.1 United Kingdom
- 5.5.3.2 Germany
- 5.5.3.3 France
- 5.5.3.4 Italy
- 5.5.3.5 Rest of Europe
- 5.5.4 Asia Pacific
- 5.5.4.1 China
- 5.5.4.2 India
- 5.5.4.3 Japan
- 5.5.4.4 South Korea
- 5.5.4.5 Rest of Asia Pacific
- 5.5.5 Middle East
- 5.5.5.1 Saudi Arabia
- 5.5.5.2 United Arab Emirates
- 5.5.5.3 Qatar
- 5.5.5.4 Rest of Middle East
- 5.5.6 Africa
- 5.5.6.1 South Africa
- 5.5.6.2 Nigeria
- 5.5.6.3 Kenya
- 5.5.6.4 Rest of Africa
- 5.5.1 North America
6 COMPETITIVE LANDSCAPE
- 6.1 Market Concentration
- 6.2 Strategic Moves
- 6.3 Market Share Analysis
- 6.4 Company Profiles (includes Global-level Overview, Market-level Overview, Core Segments, Financials as available, Strategic Information, Market Rank/Share, Products and Services, and Recent Developments)
- 6.4.1 Smiths Detection Group Ltd.
- 6.4.2 OSI Systems, Inc.
- 6.4.3 Leidos, Inc.
- 6.4.4 L3Harris Technologies, Inc.
- 6.4.5 Nuctech Company Limited
- 6.4.6 Astrophysics Inc.
- 6.4.7 Westminster Group Plc
- 6.4.8 Adani Systems Inc.
- 6.4.9 Autoclear, LLC
- 6.4.10 Aventura Technologies, Inc.
- 6.4.11 Analogic Corporation
- 6.4.12 CEIA S.p.A.
- 6.4.13 VOTI Detection Inc.
- 6.4.14 VMI Security B.V.
- 6.4.15 Gilardoni S.p.A.
- 6.4.16 Viken Detection Corporation
- 6.4.17 Teledyne Technologies Incorporated
- 6.4.18 OR Technology (Oehler Research Technology GmbH)
- 6.4.19 ZKTeco Co., Ltd.
- 6.4.20 NU Clear Advanced Security Ltd.
7 MARKET OPPORTUNITIES AND FUTURE OUTLOOK
- 7.1 White-space and Unmet-Need Assessment

