PUBLISHER: Mordor Intelligence | PRODUCT CODE: 2113894

PUBLISHER: Mordor Intelligence | PRODUCT CODE: 2113894
Wind Turbine - Market Share Analysis, Industry Trends & Statistics, Growth Forecasts (2026 - 2031)
According to Mordor Intelligence, the wind turbine market size was valued at USD 169.33 billion in 2025 and estimated to grow from USD 186.95 billion in 2026 to reach USD 306.79 billion by 2031, at a CAGR of 10.41% during the forecast period (2026-2031).
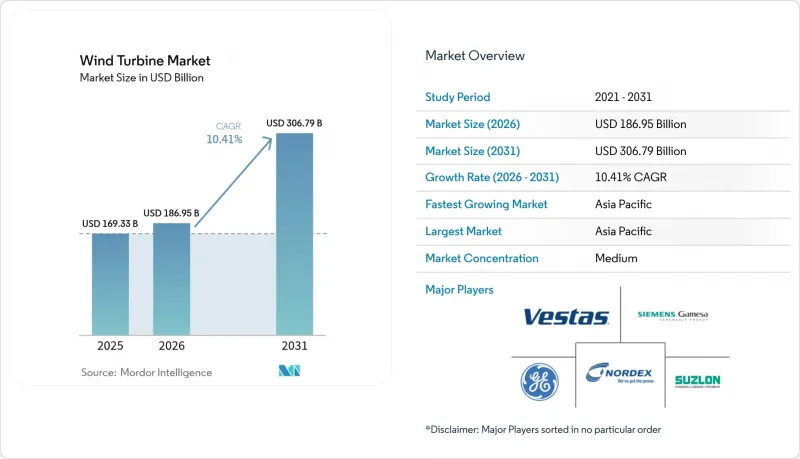
This report is Segmented by Location of Deployment (Onshore and Offshore), Capacity Rating (Small, Medium, Large, and Very Large), Axis Type (Horizontal Axis and Vertical Axis), Component (Rotor Blades, Nacelle and Drivetrain, Generator, Tower, and Power-Electronics and Control), End-Use Application (Utility-Scale, Commercial and Industrial, and Residential and Micro-Grid), and Geography (Asia-Pacific, and More).
Global Wind Turbine Market Trends and Insights
Escalating National Renewable-Energy Targets Drive Unprecedented Policy Support
The European Union now mandates 42.5% renewable electricity by 2030, while Spain aims for 81% and Greece sets comparable goals. India added 3.4 GW of wind capacity in 2024 as part of its goal to reach 500 GW of non-fossil energy. The United Kingdom's Clean Power 2030 mission seeks 95% low-carbon generation, removing prior onshore wind curbs. These frameworks guarantee revenue via feed-in tariffs, certificates, and competitive auctions, thereby accelerating the wind turbine market. Long-term policy certainty also fosters domestic manufacturing and the localization of supply chains.
Rapid LCOE Decline Transforms Wind Energy Economics
Saudi Arabia's latest tender cleared at USD 15/MWh, underlining how far onshore costs have fallen. Offshore trajectories are similar; floating wind is projected to reach 40 EUR/MWh by 2050 as rotors exceeding 180 m become standard. The average turbine rating reached 5,500 kW in 2024, resulting in reduced balance-of-plant expenses. Serial foundation fabrication, modular substations, and green-bond financing further compress unit costs. These trends entrench wind's competitiveness against fossil and solar-plus-storage alternatives.
Grid Connection Bottlenecks Constrain Market Growth
U.S. interconnection queues swelled to 2,600 GW, and the UK faces 14-year wait times, which delay commissioning and inflate carrying costs. Germany curtailed 9% of North Sea output in 2024 due to congestion. Although reforms, such as FERC Order 2023, aim to streamline approvals, transmission upgrades still lag behind wind build schedules, capping near-term additions.
Other drivers and restraints analyzed in the detailed report include:
- Utility Appetite for Mega-Turbines Reshapes Market Dynamics
- Green Hydrogen Integration Creates New Revenue Streams
- Solar-Plus-Storage Competition Intensifies Market Dynamics
For complete list of drivers and restraints, kindly check the Table Of Contents.
Segment Analysis
Onshore facilities continued to account for 91.83% of 2025 revenue, supported by mature supply chains and more streamlined permitting processes. Offshore projects, however, are projected to record a 18.95% CAGR and steadily raise their share of the wind turbine market size through 2031. Asia Pacific's 10 GW (Japan) and 12 GW (South Korea) pipelines illustrate that floating concepts are rapidly scaling, unlocking high-wind deep-water sites and attracting insurers once skeptical of novel mooring systems.
Cost parity with onshore turbines is expected to be achieved by the mid-2030s, as modular hulls and serial foundation fabrication reduce capital expenditures. As grid congestion mounts onshore, coastal nations are utilizing offshore hubs to de-risk interconnection timelines, thereby further increasing their share of the offshore wind turbine market.
Large units, 1-5 MW, retained a 45.85% share in 2025; however, models exceeding 5 MW are forecast to expand at a 14.05% CAGR, driven by utility demand for fewer, higher-output machines. Siemens Gamesa's 21 MW concept and China's 18 MW rollout highlight the tilt toward mega-platforms. Bigger rotors harness stronger winds aloft, lower O&M truck rolls, and enhance project economics, reinforcing the growth trajectory of the very-large class.
Complete Report Scope:
- By Location of Deployment
- Onshore
- Offshore
- Fixed-bottom
- Floating
- By Capacity Rating
- Small (Below 100 kW)
- Medium (100 kW to 1 MW)
- Large (1 to 5 MW)
- Very Large (Above 5 MW)
- By Axis Type
- Horizontal Axis
- Vertical Axis
- By Component
- Rotor Blades
- Nacelle and Drivetrain
- Generator
- Tower
- Power-Electronics and Control
- By End-Use Application
- Utility-Scale
- Commercial and Industrial
- Residential and Micro-grid
- By Geography
- North America
- United States
- Canada
- Mexico
- Europe
- Germany
- United Kingdom
- France
- Spain
- Russia
- Finland
- Sweden
- Tukey
- Netherlands
- Rest of Europe
- Asia Pacific
- China
- India
- Japan
- South Korea
- Australia
- Vietnam
- Rest of Asia Pacific
- South America
- Brazil
- Argentina
- Chile
- Rest of South America
- Middle East and Africa
- Saudi Arabia
- South Africa
- Egypt
- Morocco
- Rest of Middle East and Africa
- North America
Geography Analysis
Asia Pacific accounted for 47.90% of the 2025 market value, energized by China's domestic buildout, India's 3.4 GW additions, and Japan's floating push. The region's 11.35% growth clip stems from local manufacturing depth and sustained policy incentives. Europe remains a technology pacesetter, with the EU's 42.5% renewable mandate and robust offshore infrastructure keeping project momentum high.
The Middle East and Africa region is projected to be the fastest-expanding territory, buoyed by Egypt's USD 10 billion 10 GW megaproject and Saudi tenders clearing at USD 15/MWh. North America is catching up on offshore potential as transmission rules evolve, while South America rides Brazil's and Chile's auction pipelines to deepen its regional role.
- Vestas Wind Systems A/S
- Siemens Gamesa Renewable Energy S.A.
- General Electric Company (GE Vernova)
- Nordex SE
- Suzlon Energy Ltd.
- Xinjiang Goldwind Science & Technology Co., Ltd.
- Envision Energy Ltd.
- Ming Yang Smart Energy Group Ltd.
- Dongfang Electric Corp.
- Enercon GmbH
- Hitachi Ltd.
- LM Wind Power A/S
- MHI Vestas Offshore Wind A/S
- Senvion SA
- Sinovel Wind Group Co., Ltd.
- Vergnet SA
- Eocycle Technologies Inc.
- Airgenesis LLC
- United Power Technology Co., Ltd.
- Siemens Energy AG
Additional Benefits:
- The market estimate (ME) sheet in Excel format
- 3 months of analyst support
TABLE OF CONTENTS
1 Introduction
- 1.1 Study Assumptions & Market Definition
- 1.2 Scope of the Study
2 Research Methodology
3 Executive Summary
4 Market Landscape
- 4.1 Market Overview
- 4.2 Market Drivers
- 4.2.1 Escalating national renewable-energy targets
- 4.2.2 Rapid fall in onshore & offshore LCOE
- 4.2.3 Utility appetite for >=15 MW turbines
- 4.2.4 Favourable green-hydrogen linkage policies
- 4.2.5 Floating-wind bankability milestones
- 4.2.6 AI-enabled predictive-maintenance savings
- 4.3 Market Restraints
- 4.3.1 Grid-connection queue bottlenecks
- 4.3.2 Competition from utility-scale solar-plus-storage
- 4.3.3 Rare-earth magnet supply security
- 4.3.4 End-of-life blade-recycling costs
- 4.4 Supply-Chain Analysis
- 4.5 Regulatory Landscape & Government Incentives
- 4.6 Technological Outlook
- 4.7 Porters Five Forces
- 4.7.1 Bargaining Power of Suppliers
- 4.7.2 Bargaining Power of Buyers
- 4.7.3 Threat of New Entrants
- 4.7.4 Threat of Substitutes
- 4.7.5 Competitive Rivalry
5 Market Size & Growth Forecasts
- 5.1 By Location of Deployment
- 5.1.1 Onshore
- 5.1.2 Offshore
- 5.1.2.1 Fixed-bottom
- 5.1.2.2 Floating
- 5.2 By Capacity Rating
- 5.2.1 Small (Below 100 kW)
- 5.2.2 Medium (100 kW to 1 MW)
- 5.2.3 Large (1 to 5 MW)
- 5.2.4 Very Large (Above 5 MW)
- 5.3 By Axis Type
- 5.3.1 Horizontal Axis
- 5.3.2 Vertical Axis
- 5.4 By Component
- 5.4.1 Rotor Blades
- 5.4.2 Nacelle and Drivetrain
- 5.4.3 Generator
- 5.4.4 Tower
- 5.4.5 Power-Electronics and Control
- 5.5 By End-Use Application
- 5.5.1 Utility-Scale
- 5.5.2 Commercial and Industrial
- 5.5.3 Residential and Micro-grid
- 5.6 By Geography
- 5.6.1 North America
- 5.6.1.1 United States
- 5.6.1.2 Canada
- 5.6.1.3 Mexico
- 5.6.2 Europe
- 5.6.2.1 Germany
- 5.6.2.2 United Kingdom
- 5.6.2.3 France
- 5.6.2.4 Spain
- 5.6.2.5 Russia
- 5.6.2.6 Finland
- 5.6.2.7 Sweden
- 5.6.2.8 Tukey
- 5.6.2.9 Netherlands
- 5.6.2.10 Rest of Europe
- 5.6.3 Asia Pacific
- 5.6.3.1 China
- 5.6.3.2 India
- 5.6.3.3 Japan
- 5.6.3.4 South Korea
- 5.6.3.5 Australia
- 5.6.3.6 Vietnam
- 5.6.3.7 Rest of Asia Pacific
- 5.6.4 South America
- 5.6.4.1 Brazil
- 5.6.4.2 Argentina
- 5.6.4.3 Chile
- 5.6.4.4 Rest of South America
- 5.6.5 Middle East and Africa
- 5.6.5.1 Saudi Arabia
- 5.6.5.2 South Africa
- 5.6.5.3 Egypt
- 5.6.5.4 Morocco
- 5.6.5.5 Rest of Middle East and Africa
- 5.6.1 North America
6 Competitive Landscape
- 6.1 Market Concentration
- 6.2 Strategic Moves (M&A, Partnerships, PPAs)
- 6.3 Market Share Analysis (Market Rank/Share for key companies)
- 6.4 Company Profiles (includes Global level Overview, Market level overview, Core Segments, Financials as available, Strategic Information, Products & Services, and Recent Developments)
- 6.4.1 Vestas Wind Systems A/S
- 6.4.2 Siemens Gamesa Renewable Energy S.A.
- 6.4.3 General Electric Company (GE Vernova)
- 6.4.4 Nordex SE
- 6.4.5 Suzlon Energy Ltd.
- 6.4.6 Xinjiang Goldwind Science & Technology Co., Ltd.
- 6.4.7 Envision Energy Ltd.
- 6.4.8 Ming Yang Smart Energy Group Ltd.
- 6.4.9 Dongfang Electric Corp.
- 6.4.10 Enercon GmbH
- 6.4.11 Hitachi Ltd.
- 6.4.12 LM Wind Power A/S
- 6.4.13 MHI Vestas Offshore Wind A/S
- 6.4.14 Senvion SA
- 6.4.15 Sinovel Wind Group Co., Ltd.
- 6.4.16 Vergnet SA
- 6.4.17 Eocycle Technologies Inc.
- 6.4.18 Airgenesis LLC
- 6.4.19 United Power Technology Co., Ltd.
- 6.4.20 Siemens Energy AG
7 Market Opportunities & Future Outlook
- 7.1 White-space & Unmet-Need Assessment

