PUBLISHER: Mordor Intelligence | PRODUCT CODE: 2113924

PUBLISHER: Mordor Intelligence | PRODUCT CODE: 2113924
Southeast Asia Bottled Water - Market Share Analysis, Industry Trends & Statistics, Growth Forecasts (2026 - 2031)
According to Mordor Intelligence, the Southeast Asia bottled water market size is projected to be USD 42.54 billion in 2025, USD 46.10 billion in 2026, and reach USD 68.94 billion by 2031, growing at a CAGR of 8.38% from 2026 to 2031.
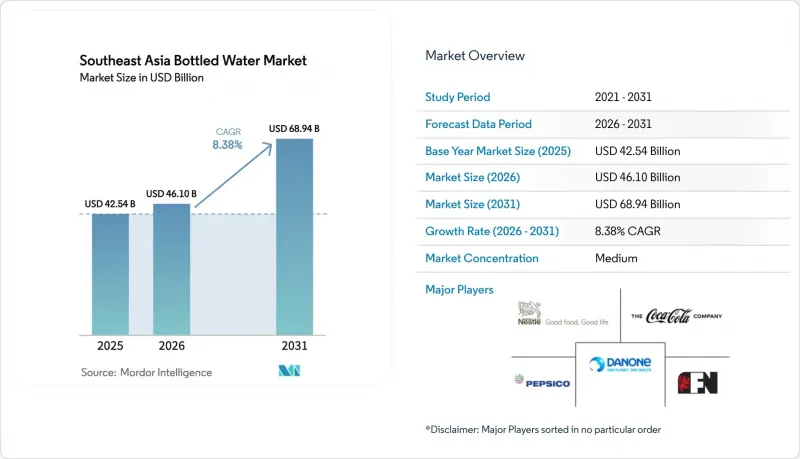
This report is Segmented by Product Type (Still, Sparkling, Functional/Flavored), Packaging Format (PET, Glass, Cans), Category (Mass, Premium), Distribution Channel (On-Trade, Off-Trade), and Geography (Thailand, Indonesia, Singapore, Malaysia, Vietnam, Philippines, Rest of SEA). Market Forecasts are Provided in Value (USD) and Volume (Units).
Southeast Asia Bottled Water Market Trends and Insights
Concerns Over Tap Water Contamination Boost Reliance on Bottled Alternatives
Recurring water contamination incidents in Southeast Asia have eroded trust in municipal tap systems, driving households toward bottled water as a permanent solution. In Vietnam, the World Bank's 2024 report revealed that only 62% of urban households and 38% of rural households receive piped water meeting WHO microbiological standards, forcing many to bear the cost of packaged alternatives. Similarly, the Asian Development Bank's 2025 report highlighted that 30% of urban piped connections in Indonesia exceed permissible coliform limits, especially in secondary cities lacking modern treatment facilities. In Thailand, 147 tap water quality violations recorded in 2024, primarily in northeastern provinces, triggered localized spikes in bottled water sales. This shift has created a lasting demand, as even middle-income families now view bottled water as essential for health, with trust in municipal systems taking years to rebuild despite remediation efforts.
Rapid Urbanization Strains Municipal Water Supplies, Increasing Demand for Bottled Water
By 2025, Southeast Asia's urbanization rate reached 52%, with the United Nations projecting it to rise to 68% by 2040. This rapid urban growth has concentrated populations in megacities, straining water infrastructures originally designed for much smaller populations. In 2024, Jakarta faced a daily water shortfall of over 1.2 million cubic meters, forcing residents in outlying areas to rely entirely on bottled water, according to Indonesia's Ministry of Public Works and Housing. Similarly, Ho Chi Minh City's water supply system operated at 95% capacity during the dry season, leaving new residential developments without reliable piped water. As a result, property developers began including bottled water subscriptions in lease agreements. These infrastructure challenges are worsening as urbanization outpaces capital budgets, driving a sustained rise in bottled water demand that is expected to continue until governments complete their long-term pipe replacement programs.
Logistical Challenges Limit Rural and Island Distribution
Southeast Asia's geography and underdeveloped transport infrastructure pose significant challenges for bottled water brands to profitably serve rural and island populations. Indonesia's 17,000 islands experience high inter-island shipping costs, adding 15-25% to landed costs, while irregular ferry schedules disrupt inventory during monsoons. Similarly, the Philippines' 7,641 islands rely on costly multi-modal transport, making bottled water unaffordable for low-income households. In Thailand's northeastern provinces, poor road conditions and inadequate cold-chain infrastructure force distributors to focus on urban areas, leaving rural communities dependent on untreated well water or overpriced small-format bottles with 40-50% markups. These logistical barriers restrict market penetration and limit volume growth in regions that account for 40% of Southeast Asia's population.
Other drivers and restraints analyzed in the detailed report include:
- On-the-Go Lifestyles Favor Convenient Bottled Water Packaging
- Government Campaigns Promote Bottled Water as a Healthy Choice
- Numerous Local Brands Intensify Price Competition and Weaken Loyalty
For complete list of drivers and restraints, kindly check the Table Of Contents.
Segment Analysis
In 2025, still bottled water led the market with an 82.19% share, driven by its affordability-priced 30-40% lower than sparkling and functional alternatives-and versatility for drinking, cooking, and other household uses. Brands like Danone's Aqua in Indonesia, offering 600ml bottles at IDR 3,500 (USD 0.23) and 19-liter refillable jugs at IDR 19,000 (USD 1.25), cater to both on-the-go and bulk consumption. Similarly, Nestle's Pure Life maintains competitive pricing across Thailand, Malaysia, and the Philippines, leveraging scale to counter local competitors. While growth in this mature segment is limited, urbanization and distrust of tap water continue to drive demand, ensuring still water remains the category's revenue backbone.
Functional and flavored bottled water is projected to grow at an 8.50% CAGR through 2031, fueled by health-conscious consumers seeking hydration with added benefits like electrolytes, vitamins, and botanical extracts. Post-pandemic wellness trends have boosted demand, as seen in BE WTR's activated water, launched in Thailand and Singapore in 2024, featuring alkaline minerals and antioxidants at THB 25 (USD 0.75) for a 500ml bottle. Flavored variants like lemon, mint, and cucumber appeal to younger consumers seeking taste variety without sugar, bridging the gap between plain water and soft drinks. Sparkling bottled water remains niche due to higher production costs and limited familiarity outside Singapore and expatriate communities, but rising disposable incomes and premiumization trends suggest gradual adoption.
In 2025, PET bottles commanded a dominant 62.08% share of the packaging market, bolstered by their widespread manufacturing, mature supply chains, and consumer acceptance across diverse price points and distribution channels. Indorama Ventures, the leading PET resin producer in Southeast Asia, boasts recycling facilities in Thailand and Indonesia. With a combined annual capacity surpassing 50,000 tonnes, these facilities provide food-grade rPET to giants like Coca-Cola, PepsiCo, and local bottlers, all at a cost 10-15% lower than that of virgin resin. Danone's pledge in 2024 to transition Aqua to 100% rPET bottles by 2025 underscores the evolving sustainability narrative of rPET, as brands increasingly heed regulatory mandates and consumer demand for recyclable packaging. Beyond cost benefits, PET's lightweight design curtails transport emissions, resealable caps boost convenience, and transparent walls facilitate quality checks-features that appeal to consumers across all income brackets.
Aluminum cans are set to expand at a robust 8.84% CAGR through 2031, driven by their recyclability, premium market positioning, and growing production capabilities in Southeast Asia. A testament to the industry's optimism, UACJ Corporation's 2024 venture into a 1.2 billion baht (USD 35 million) aluminum recycling facility in Thailand is noteworthy. This facility, with its ability to transform post-consumer cans into beverage-grade sheets, boasts a remarkable 95% energy saving compared to primary aluminum production. This appeal is further amplified by Extended Producer Responsibility regulations in Vietnam, the Philippines, and Singapore, which impose penalties on low-recovery packaging. The premium perception of aluminum cans fuels their adoption: brands such as Liquid Death and BE WTR leverage cans to stand out in saturated markets, commanding a 30-40% price premium over their PET counterparts. Their target audience, fitness aficionados and festival attendees, values the cans' portability and visual allure. In 2024, Ball Corporation introduced resealable can technology, overcoming a traditional limitation of cans and broadening their appeal for multi-sip consumption.
Complete Report Scope:
- Product Type
- Still Bottled Water
- Sparkling Bottled Water
- Functional /Flavored Bottled Water
- Packaging Format
- PET Bottles
- Glass Bottles
- Cans
- Category
- Mass
- Premium
- Distribution Channel
- On-Trade
- Off-Trade
- Supermarket/Hypermarket
- Convenience/Grocery Stores
- Online Retail Stores
- Others Distribution Channel
- Country
- Thailand
- Indonesia
- Singapore
- Malaysia
- Vietnam
- Phillipines
- Rest of Southeast Asia
List of Companies Covered in this Report:
- Danone S.A.
- Nestle S.A.
- The Coca-Cola Company
- PepsiCo Inc.
- Fraser and Neave Holdings Bhd
- Spritzer Bhd
- Asia Brewery Incorporated
- Universal Robina Corporation
- Thai Beverage Public Co. Ltd
- Boon Rawd Brewery Co. Ltd
- Vinh Hao Mineral Water Corporation
- Otsuka Pharmaceutical Co. Ltd
- Wings Group (Cleo)
- Coca-Cola Europacific Partners
- Suntory PepsiCo Beverage
- Nongfu Spring
- Indorama Ventures
- Amcor PLC
- ALPLA Group
- Berry Global Inc.
Additional Benefits:
- The market estimate (ME) sheet in Excel format
- 3 months of analyst support
TABLE OF CONTENTS
1 INTRODUCTION
- 1.1 Study Assumptions and Market Definition
- 1.2 Scope of the Study
2 RESEARCH METHODOLOGY
3 EXECUTIVE SUMMARY
4 MARKET LANDSCAPE
- 4.1 Market Overview
- 4.2 Market Drivers
- 4.2.1 Concerns over tap water contamination boost reliance on bottled alternatives
- 4.2.2 Rapid urbanization strains municipal water supplies, increasing demand for bottled water
- 4.2.3 On-the-go lifestyles favor convenient bottled water packaging
- 4.2.4 Government campaigns promote bottled water as a healthy choice
- 4.2.5 Premium variants attract demand in tourism-driven hospitality sectors
- 4.2.6 Supermarkets and e-commerce expand bottled water availability in cities
- 4.3 Market Restraints
- 4.3.1 Logistical challenges limit rural and island distribution
- 4.3.2 Numerous local brands intensify price competition and weaken loyalty
- 4.3.3 Stringent regulations on plastic packaging increase compliance costs
- 4.3.4 Varying water standards complicate regional compliance and distribution
- 4.4 Supply Chain Analysis
- 4.5 Regulatory Landscape
- 4.6 Technological Outlook
- 4.7 Porter's Five Forces Analysis
- 4.7.1 Threat of New Entrants
- 4.7.2 Bargaining Power of Buyers
- 4.7.3 Bargaining Power of Suppliers
- 4.7.4 Threat of Substitutes
- 4.7.5 Intensity of Competitive Rivalry
5 MARKET SIZE AND GROWTH FORECASTS (VALUE AND VOLUME)
- 5.1 Product Type
- 5.1.1 Still Bottled Water
- 5.1.2 Sparkling Bottled Water
- 5.1.3 Functional /Flavored Bottled Water
- 5.2 Packaging Format
- 5.2.1 PET Bottles
- 5.2.2 Glass Bottles
- 5.2.3 Cans
- 5.3 Category
- 5.3.1 Mass
- 5.3.2 Premium
- 5.4 Distribution Channel
- 5.4.1 On-Trade
- 5.4.2 Off-Trade
- 5.4.2.1 Supermarket/Hypermarket
- 5.4.2.2 Convenience/Grocery Stores
- 5.4.2.3 Online Retail Stores
- 5.4.2.4 Others Distribution Channel
- 5.5 Country
- 5.5.1 Thailand
- 5.5.2 Indonesia
- 5.5.3 Singapore
- 5.5.4 Malaysia
- 5.5.5 Vietnam
- 5.5.6 Philippines
- 5.5.7 Rest of Southeast Asia
6 COMPETITIVE LANDSCAPE
- 6.1 Market Concentration
- 6.2 Strategic Moves
- 6.3 Market Share Analysis
- 6.4 Company Profiles (includes Global level Overview, Market level overview, Core Segments, Financials as available, Strategic Information, Market Rank/Share for key companies, Products and Services, and Recent Developments)
- 6.4.1 Danone S.A.
- 6.4.2 Nestle S.A.
- 6.4.3 The Coca-Cola Company
- 6.4.4 PepsiCo Inc.
- 6.4.5 Fraser and Neave Holdings Bhd
- 6.4.6 Spritzer Bhd
- 6.4.7 Asia Brewery Incorporated
- 6.4.8 Universal Robina Corporation
- 6.4.9 Thai Beverage Public Co. Ltd
- 6.4.10 Boon Rawd Brewery Co. Ltd
- 6.4.11 Vinh Hao Mineral Water Corporation
- 6.4.12 Otsuka Pharmaceutical Co. Ltd
- 6.4.13 Wings Group (Cleo)
- 6.4.14 Coca-Cola Europacific Partners
- 6.4.15 Suntory PepsiCo Beverage
- 6.4.16 Nongfu Spring
- 6.4.17 Indorama Ventures
- 6.4.18 Amcor PLC
- 6.4.19 ALPLA Group
- 6.4.20 Berry Global Inc.
7 MARKET OPPORTUNITIES AND FUTURE OUTLOOK

