PUBLISHER: Mordor Intelligence | PRODUCT CODE: 2114165

PUBLISHER: Mordor Intelligence | PRODUCT CODE: 2114165
Recombinant Protein - Market Share Analysis, Industry Trends & Statistics, Growth Forecasts (2026 - 2031)
According to Mordor Intelligence, the recombinant protein market size is estimated at USD 3.13 billion in 2026, and is expected to reach USD 4.59 billion by 2031, at a CAGR of 8.10% during the forecast period (2026-2031).
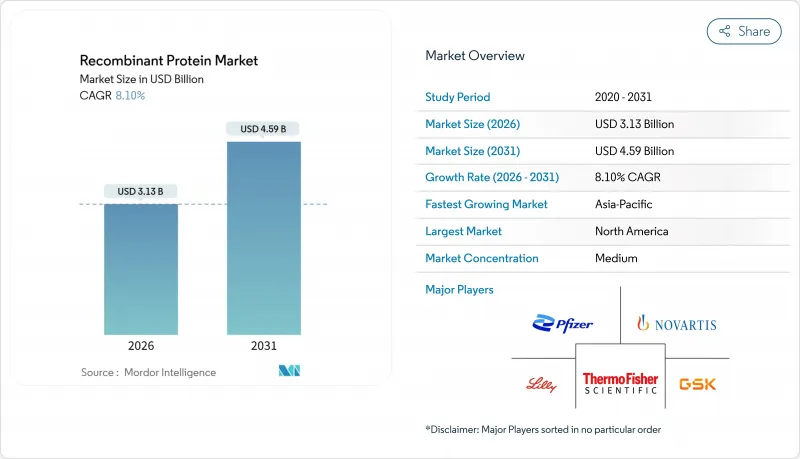
This report is Segmented by Product (Hormones, Cytokines & Growth Factors, and More), Expression System (Mammalian, Bacterial, Yeast, and More), Application (Therapeutic, Research, Industrial), End User (Pharmaceutical & Biotechnology Companies, Cros & CDMOs and More), and Geography (North America, Europe, Asia-Pacific, and More). Market Forecasts are Provided in Terms of Value (USD).
Global Recombinant Protein Market Trends and Insights
Chronic Disease Burden Elevates Demand for Biologics
Rising prevalence of diabetes, cancer, and autoimmune disorders is expanding the addressable patient pool for recombinant therapeutics. The World Health Organization added semaglutide to its Model List of Essential Medicines in 2024, recognizing glucagon-like peptide-1 receptor agonists as a cornerstone of obesity and type 2 diabetes management . Novo Nordisk's Wegovy and Eli Lilly's Zepbound collectively generated multi-billion-dollar revenues in 2025, underscoring payer willingness to reimburse high-cost biologics when clinical outcomes justify expenditure. Oncology pipelines are shifting toward interleukin-based immunotherapies and bispecific antibodies that engage T cells, with FDA approvals for teclistamab and talquetamab in multiple myeloma validating the dual-targeting paradigm. This trend extends beyond wealthy markets; India and China are scaling biosimilar insulin and erythropoietin production to serve domestic populations, creating a parallel demand stream that favors cost-efficient expression systems and local fill-finish capacity.
Breakthroughs In High-Yield Expression & Purification Platforms
Mammalian cell lines now routinely achieve titers of 10 grams per liter to 15 grams per liter in perfusion culture, halving bioreactor footprint and accelerating clinical supply timelines. Chinese hamster ovary (CHO) cell engineering incorporating CRISPR-mediated knockout of apoptosis pathways and overexpression of chaperones has become standard practice among top-tier CDMOs, enabling clients to compress process development from 18 months to 12 months. Continuous chromatography systems, which integrate bind-elute and flow-through modes, reduce resin consumption by 30% and cut purification cycle time significantly, translating into lower cost-of-goods for high-volume products. Bacterial platforms are benefiting from codon optimization and periplasmic secretion strategies that improve solubility and reduce endotoxin burden, making Escherichia coli viable for simpler cytokines and growth factors. These advances compress the cost-quality frontier, allowing smaller biotechs to compete on manufacturing efficiency rather than relying solely on intellectual property moats.
Persistent High COGS for Complex Glycoproteins
Downstream processing for heavily glycosylated proteins still represents 60%-70% of manufacturing outlay, despite resin and process advances. Affinity resins priced at USD 10,000-15,000 per liter require frequent replacement, and extended culture durations inflate overhead costs. Glyco-engineered yeast strains offer promise, but sparse regulatory precedent adds 12-18 months of comparability work, restraining near-term adoption. High cost structures disadvantage biosimilars once reference prices fall, concentrating production among the few players that maintain scale efficiencies. Without step-change gains in glycan control or purification economy, margin pressure will persist and temper recombinant protein market acceleration.
Other drivers and restraints analyzed in the detailed report include:
- Expansion Of Bioclusters & CDMO Capacity Worldwide
- Favorable Biologics Reimbursement & Fast-Track Approvals
- Intensifying Biosimilar-Driven Price Erosion
For complete list of drivers and restraints, kindly check the Table Of Contents.
Segment Analysis
Cytokines and growth factors accounted for 25.2% of the recombinant protein market share in 2025, sustained by widespread use of interleukins, colony-stimulating factors, and interferons across oncology and immunology. Interleukin-15 programs in particular are expanding T-cell therapies, while next-generation interleukin-2 variants deliver stronger tumor infiltration with lower toxicity. Fusion proteins, though only emerging, are projected to grow at an 8.82% CAGR through 2031, benefiting from half-life extension and dual-targeting mechanisms exemplified by Amgen's Uplizna . Demand for hormones such as insulin, erythropoietin, and human growth hormone remains steady, yet biosimilar launches like Semglee and Rezvoglar exert downward price pressure. Monoclonal antibodies and fragments continue to dominate autoimmune and oncology care, while industrial enzymes provide reliable cash flow as sustainability mandates drive the switch from petrochemical catalysts. AI-designed scaffolds and synthetic biology outputs populate early pipelines, suggesting longer-term upside once regulatory clarity and manufacturing readiness mature.
Mammalian hosts held 46.1% of the market share in 2025, reflecting an unrivaled ability to deliver human-like glycosylation essential for immunoglobulins and Fc-fusion constructs. Recombinant protein market size tied to mammalian systems continues to expand as perfusion and fed-batch processes yield titers above 10 g/L, lowering per-gram costs. Cell-free platforms, however, grow fastest at an 8.54% CAGR, offering 48-hour production cycles and site-specific conjugation versatility showcased by Sutro Biopharma's XpressCF.
Bacterial expression remains a workhorse for non-glycosylated molecules, aided by codon optimization that halves refolding expense. Yeast systems deliver a balance of eukaryotic folding and bacterial scalability, with Pichia pastoris enabling dense fermentations suited for industrial enzymes. Insect cells occupy niche vaccine and viral-like-particle uses, but limited scale constrains their broader stake in the recombinant protein market.
Complete Report Scope:
- By Product
- Hormones (Insulin, EPO, hGH, FSH)
- Cytokines & Growth Factors (ILs, CSFs, IFNs)
- Monoclonal Antibodies & Fragments
- Enzymes
- Fusion Proteins & Others
- By Expression System
- Mammalian (CHO, HEK293)
- Bacterial (E. coli)
- Yeast (Pichia, Saccharomyces)
- Insect (Sf9, Sf21)
- Cell-Free / Synthetic
- By Application
- Therapeutic
- Research
- Industrial (Agro-biotech, Food, Detergents)
- By End User
- Pharmaceutical & Biotechnology Companies
- Academic & Research Institutes
- CROs & CDMOs
- By Geography
- North America
- United States
- Canada
- Mexico
- Europe
- Germany
- United Kingdom
- France
- Italy
- Spain
- Rest of Europe
- Asia-Pacific
- China
- Japan
- India
- South Korea
- Australia
- Rest of APAC
- Middle East & Africa
- GCC
- South Africa
- Rest of Middle East & Africa
- South America
- Brazil
- Argentina
- Rest of South America
- North America
Geography Analysis
North America held 42.1% of global revenue in 2025, buoyed by concentrated venture funding, FDA regulatory leadership, and entrenched bioclusters in Boston and the San Francisco Bay Area. The FDA issued 68 breakthrough therapy designations across 2024-2025, shaving up to a year off commercialization timelines. Canada's CAD 950 million Pan-Canadian Biologics and Biosimilars Initiative is set to boost domestic output, reducing import reliance and enlarging the regional recombinant protein market size.
Europe leverages established capacity in Ireland, Switzerland, and Denmark. Lonza's Visp and Portsmouth sites contribute 200 kL of mammalian volume, while Fujifilm's new 120 kL Danish plant targets complex glycoproteins. EMA's PRIME program continues to streamline development, and biosimilar penetration across infliximab and rituximab surpasses 80%, reinforcing Europe's reputation for value-based procurement.
Asia-Pacific is on an 8.81% CAGR trajectory as China and India escalate CDMO footprints. WuXi Biologics exceeds 400 kL capacity with cost structures undercutting Western peers by up to 30%. Samsung Biologics' 784 kL site in Incheon further cements regional prominence. Domestic demand for biosimilar insulin and erythropoietin in India also adds volume, broadening recombinant protein market penetration across emerging economies.
Middle East & Africa and South America remain nascent but strategic. Saudi Vision 2030 earmarks USD 2 billion for biomanufacturing to lower import dependency. Brazil recorded significant biosimilar market growth in 2025, although regulatory harmonization lags U.S. and EU benchmarks. South Africa's Biovac Institute expanded fill-finish output, offering a springboard for regional recombinant protein contracts once WHO prequalification is secured.
- Abbvie
- Amgen
- Bio-Rad Laboratories
- Eli Lilly and Company
- Merck
- Novo Nordisk
- Sanofi
- Thermo Fisher Scientific
- Novartis
- GlaxoSmithKline
- Novavax
- Pfizer
- Sino Biological
- Bio-Techne Corp.
- GenScript Biotech Corp.
- Lonza Group
- Agilent Technologies
- Takara Bio
- Roche
- Regeneron Pharmaceuticals
- CSL Behring
Additional Benefits:
- The market estimate (ME) sheet in Excel format
- 3 months of analyst support
TABLE OF CONTENTS
1 Introduction
- 1.1 Study Assumptions & Market Definition
- 1.2 Scope of the Study
2 Research Methodology
3 Executive Summary
4 Market Landscape
- 4.1 Market Overview
- 4.2 Market Drivers
- 4.2.1 Chronic-Disease Burden Elevates Demand For Biologics
- 4.2.2 Breakthroughs In High-Yield Expression & Purification Platforms
- 4.2.3 Expansion Of Bioclusters & CDMO Capacity Worldwide
- 4.2.4 Favorable Biologics Reimbursement & Fast-Track Approvals
- 4.2.5 AI-Driven De Novo Protein Design Unlocks Novel Pipelines
- 4.2.6 Single-Use, Low-Capex Bioreactors Democratize Manufacturing
- 4.3 Market Restraints
- 4.3.1 Persistent High COGS For Complex Glycoproteins
- 4.3.2 Intensifying Biosimilar-Driven Price Erosion
- 4.3.3 Cold-Chain & Fill-Finish Bottlenecks in Emerging Markets
- 4.3.4 Regulatory Ambiguity for Cell-Free Synthesis Platforms
- 4.4 Value Chain Analysis
- 4.5 Regulatory Landscape
- 4.6 Technological Outlook
- 4.7 Porter's Five Forces
- 4.7.1 Threat of New Entrants
- 4.7.2 Bargaining Power of Buyers
- 4.7.3 Bargaining Power of Suppliers
- 4.7.4 Threat of Substitutes
- 4.7.5 Intensity of Competitive Rivalry
5 Market Size & Growth Forecasts (Value)
- 5.1 By Product
- 5.1.1 Hormones (Insulin, EPO, hGH, FSH)
- 5.1.2 Cytokines & Growth Factors (ILs, CSFs, IFNs)
- 5.1.3 Monoclonal Antibodies & Fragments
- 5.1.4 Enzymes
- 5.1.5 Fusion Proteins & Others
- 5.2 By Expression System
- 5.2.1 Mammalian (CHO, HEK293)
- 5.2.2 Bacterial (E. coli)
- 5.2.3 Yeast (Pichia, Saccharomyces)
- 5.2.4 Insect (Sf9, Sf21)
- 5.2.5 Cell-Free / Synthetic
- 5.3 By Application
- 5.3.1 Therapeutic
- 5.3.2 Research
- 5.3.3 Industrial (Agro-biotech, Food, Detergents)
- 5.4 By End User
- 5.4.1 Pharmaceutical & Biotechnology Companies
- 5.4.2 Academic & Research Institutes
- 5.4.3 CROs & CDMOs
- 5.5 By Geography
- 5.5.1 North America
- 5.5.1.1 United States
- 5.5.1.2 Canada
- 5.5.1.3 Mexico
- 5.5.2 Europe
- 5.5.2.1 Germany
- 5.5.2.2 United Kingdom
- 5.5.2.3 France
- 5.5.2.4 Italy
- 5.5.2.5 Spain
- 5.5.2.6 Rest of Europe
- 5.5.3 Asia-Pacific
- 5.5.3.1 China
- 5.5.3.2 Japan
- 5.5.3.3 India
- 5.5.3.4 South Korea
- 5.5.3.5 Australia
- 5.5.3.6 Rest of APAC
- 5.5.4 Middle East & Africa
- 5.5.4.1 GCC
- 5.5.4.2 South Africa
- 5.5.4.3 Rest of Middle East & Africa
- 5.5.5 South America
- 5.5.5.1 Brazil
- 5.5.5.2 Argentina
- 5.5.5.3 Rest of South America
- 5.5.1 North America
6 Competitive Landscape
- 6.1 Market Concentration
- 6.2 Market Share Analysis
- 6.3 Company Profiles (includes Global-level Overview, Market-level Overview, Core Segments, Financials as available, Strategic Information, Market Rank/Share for key companies, Products & Services, and Recent Developments)
- 6.3.1 AbbVie Inc.
- 6.3.2 Amgen Inc.
- 6.3.3 Bio-Rad Laboratories Inc.
- 6.3.4 Eli Lilly and Company
- 6.3.5 Merck KGaA
- 6.3.6 Novo Nordisk A/S
- 6.3.7 Sanofi SA
- 6.3.8 Thermo Fisher Scientific Inc.
- 6.3.9 Novartis AG
- 6.3.10 GlaxoSmithKline plc
- 6.3.11 Novavax Inc.
- 6.3.12 Pfizer Inc.
- 6.3.13 Sino Biological Inc.
- 6.3.14 Bio-Techne Corp.
- 6.3.15 GenScript Biotech Corp.
- 6.3.16 Lonza Group AG
- 6.3.17 Agilent Technologies Inc.
- 6.3.18 Takara Bio Inc.
- 6.3.19 F. Hoffmann-La Roche AG
- 6.3.20 Regeneron Pharmaceuticals Inc.
- 6.3.21 CSL Limited
7 Market Opportunities & Future Outlook
- 7.1 White-Space & Unmet-Need Assessment

