PUBLISHER: Mordor Intelligence | PRODUCT CODE: 2114422

PUBLISHER: Mordor Intelligence | PRODUCT CODE: 2114422
ASEAN Waste Management - Market Share Analysis, Industry Trends & Statistics, Growth Forecasts (2026 - 2031)
According to Mordor Intelligence, ASEAN waste management market size in 2026 is estimated at USD 35.36 billion, growing from 2025 value of USD 33.19 billion with 2031 projections showing USD 48.52 billion, growing at 6.54% CAGR over 2026-2031.
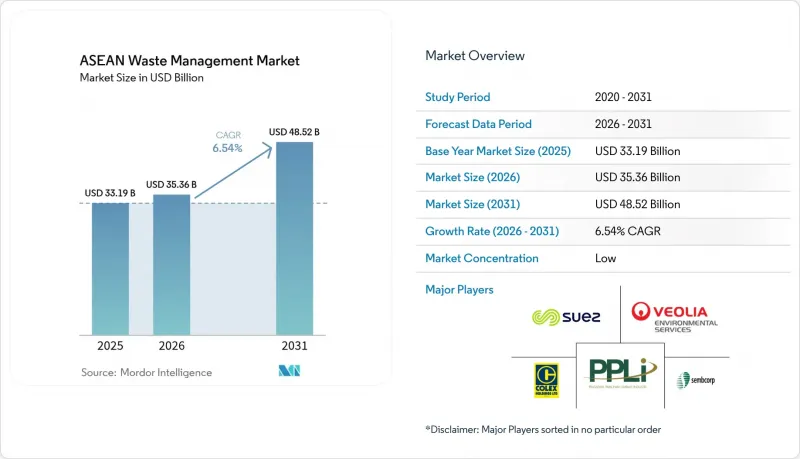
This report is Segmented by Source (Residential, Commercial, Industrial, and More), by Service Type (Collection/Transportation/Sorting, and More), by Waste Type (Municipal Solid, Industrial Hazardous, E-Waste, Plastic, and More), and by Geography (Indonesia, Thailand, Vietnam, Philippines, Malaysia, Singapore, Rest of ASEAN). The Market Forecasts are Provided in Terms of Value (USD).
ASEAN Waste Management Market Trends and Insights
Circular-Economy Regulations Accelerating Public-Private Investment
Region-wide circular-economy targets are unlocking unprecedented capital for waste infrastructure. Indonesia's Presidential Regulation 98/2021 anchors a carbon-credit market that could abate 1,283 million tCO2e by 2030, giving private operators long-term revenue clarity. Singapore's Resource Sustainability Act mandates segregated food waste collection from 2024 and compulsory 3R plans for large packaging producers by 2025, spurring upstream design changes. The ASEAN Framework for Circular Economy, adopted in 2021, harmonizes policy roadmaps and reduces investor risk for cross-border projects. Malaysia's target of 18 WtE plants by 2040, backed by a 40% recycling-rate goal, illustrates how regulatory certainty drives pipeline formation. Multilateral financiers estimate USD 8.9 billion in annual economic losses from poor plastic recovery, strengthening the case for accelerated investment.
EU-Style Extended Producer Responsibility Schemes Spreading Across ASEAN
Harmonized EPR policies are rewriting cost structures across packaging value chains. Vietnam's updated Decree 05/2025/ND-CP raises revenue-based exemptions to USD 0.87 million (VND 20 billion) and USD 1.30 million (VND 30 billion) while setting clearer recycling quotas. Singapore's electronics EPR model, operational since 2021, finances take-back networks through producer fees. Indonesia targets a 70% plastic waste reduction by 2025 using plastic-credit schemes that let brands offset recycling costs. Malaysia's 2021 EPR rollout helped lift the national recycling rate from 15.7% in 2015 to 35.38% in 2023. Predictable compliance fees transform waste into a traceable feedstock, helping formal operators in the ASEAN waste management market secure financing for new materials-recovery facilities.
Highly Fragmented Informal Sector Limiting Feedstock Traceability
Millions of informal pickers dominate plastic and paper recovery across ASEAN, yet operate outside digital audit trails, complicating EPR verification and carbon-credit issuance. Indonesian pemulung collectors manage over half of Jakarta's daily plastic, but rarely provide material-flow documentation, undermining circularity metrics. The United Nations Office on Drugs and Crime links waste trafficking to organized crime in Malaysia, Vietnam, and Thailand, further muddying traceability. Cambodia's rural districts still rely on ad-hoc community dumps, making data capture almost impossible. Without reliable feedstock provenance, many recyclers lose access to premium export markets that demand chain-of-custody proof. Closing this digital divide is crucial for a more formalized ASEAN waste management market.
Other drivers and restraints analyzed in the detailed report include:
- Rapid Rise of E-Commerce Packaging Waste
- AI-Enabled Route Optimization Cutting Collection OPEX
- High Chloride Content in Mixed Municipal Waste Hinders RDF Quality
For complete list of drivers and restraints, kindly check the Table Of Contents.
Segment Analysis
Residential streams delivered 49.23% of 2025 revenue, underscoring the sheer scale of household generation across ASEAN megacities. Commercial waste, however, is set to expand at an 8.35% CAGR, outpacing every other source as malls and office parks comply with stricter segregation mandates. The ASEAN waste management market size for commercial sources is projected to widen notably once large retailers internalize full EPR charges linked to packaging. Food courts and hotels in Singapore already segregate organics for on-site digesters, and similar regulations are being drafted in Vietnam and Malaysia. As procurement teams seek single-contract service bundles covering bins, audit, and reporting, integrated providers will gain cross-selling opportunities.
The ASEAN waste management market share commanded by residential sources may slip because corporate generators purchase premium traceability services that attract higher tariffs. Super-apps offering waste pickup scheduling are bundling reward points, drawing more commercial tenants into formal systems. Industrial parks continue to deliver steady tonnage, yet pollution-control certificates now require third-party audits, nudging factories toward licensed handlers. Construction debris volumes are swelling on the back of infrastructure stimuli, incentivizing joint ventures between cement producers and waste contractors to co-process rubble and wood off-cuts.
Complete Report Scope:
- By Source
- Residential
- Commercial (retail, office, etc.)
- Industrial
- Medical (Health and Pharmaceutical)
- Construction & Demolition
- Others (institutional, agricultural, etc)
- By Service Type
- Collection, Transportation, Sorting & Segregation
- Disposal / Treatment
- Landfill
- Recycling & Resource Recovery
- Incineration & Waste-to-Energy
- Others (Chemical Treatment, Composting, etc.)
- Others (Consulting, Audit & Training, etc.)
- By Waste Type
- Municipal Solid Waste
- Industrial Hazardous Waste
- E-waste
- Plastic Waste
- Biomedical Waste
- Construction & Demolition Waste
- Agricultural Waste
- Other Specialized Waste (radio active, etc)
- By Geography
- Indonesia
- Thailand
- Vietnam
- Philippines
- Malaysia
- Singapore
- Rest of ASEAN Countries
List of Companies Covered in this Report:
- Sembcorp Environmental Management
- Veolia Environment SA
- SUEZ
- PT Prasadha Pamunah Limbah Industri (PPLI)
- Colex Holdings
- Remondis
- ALBA Group Asia
- Indorama Ventures (PET Recycling)
- Blue Planet Environmental Solutions
- Greenway Environmental
- Starpal
- Boon Poh Refuse Disposal
- Binh Duong Water-Environment (BIWASE)
- Metro Waste Philippines
- Dangote Waste Management Myanmar
- Waste4Change Indonesia
- Khun Recycle Thailand
- Saigon Green Technology
- Siam Cement Group (SCG) - Circular Economy Unit
- Republic Services Singapore JV
Additional Benefits:
- The market estimate (ME) sheet in Excel format
- 3 months of analyst support
TABLE OF CONTENTS
1 Introduction
- 1.1 Study Assumptions & Market Definition
- 1.2 Scope of the Study
2 Research Methodology
3 Executive Summary
4 Market Landscape
- 4.1 Market Overview
- 4.2 Market Drivers
- 4.2.1 Circular-economy regulations accelerating public-private investment
- 4.2.2 EU-style Extended Producer Responsibility (EPR) schemes spreading across ASEAN
- 4.2.3 Rapid rise of e-commerce packaging waste
- 4.2.4 Waste-to-Energy (WtE) feed-in tariffs in Indonesia, Vietnam & Thailand
- 4.2.5 Corporate zero-plastic footprints commitments (CPG & retail)
- 4.2.6 AI-enabled route-optimisation cutting collection OPEX (under-reported)
- 4.3 Market Restraints
- 4.3.1 Highly fragmented informal sector limiting feedstock traceability
- 4.3.2 Landfill tipping-fee divergence across member states
- 4.3.3 Policy uncertainty around carbon credit treatment for WtE plants
- 4.3.4 High chloride content in mixed municipal waste hindering RDF quality (under-reported)
- 4.4 Value / Supply-Chain Analysis
- 4.5 Regulatory Landscape
- 4.6 Technological Outlook
- 4.7 Industry Attractiveness - Porter's Five Force Analysis
- 4.7.1 Threat of New Entrants
- 4.7.2 Bargaining Power of Suppliers
- 4.7.3 Bargaining Power of Buyers
- 4.7.4 Threat of Substitutes
- 4.7.5 Intensity of Competitive Rivalry
5 Market Size & Growth Forecasts (Value, In USD Billion)
- 5.1 By Source
- 5.1.1 Residential
- 5.1.2 Commercial (retail, office, etc.)
- 5.1.3 Industrial
- 5.1.4 Medical (Health and Pharmaceutical)
- 5.1.5 Construction & Demolition
- 5.1.6 Others (institutional, agricultural, etc)
- 5.2 By Service Type
- 5.2.1 Collection, Transportation, Sorting & Segregation
- 5.2.2 Disposal / Treatment
- 5.2.2.1 Landfill
- 5.2.2.2 Recycling & Resource Recovery
- 5.2.2.3 Incineration & Waste-to-Energy
- 5.2.2.4 Others (Chemical Treatment, Composting, etc.)
- 5.2.3 Others (Consulting, Audit & Training, etc.)
- 5.3 By Waste Type
- 5.3.1 Municipal Solid Waste
- 5.3.2 Industrial Hazardous Waste
- 5.3.3 E-waste
- 5.3.4 Plastic Waste
- 5.3.5 Biomedical Waste
- 5.3.6 Construction & Demolition Waste
- 5.3.7 Agricultural Waste
- 5.3.8 Other Specialized Waste (radio active, etc)
- 5.4 By Geography
- 5.4.1 Indonesia
- 5.4.2 Thailand
- 5.4.3 Vietnam
- 5.4.4 Philippines
- 5.4.5 Malaysia
- 5.4.6 Singapore
- 5.4.7 Rest of ASEAN Countries
6 Competitive Landscape
- 6.1 Market Concentration
- 6.2 Strategic Moves
- 6.3 Market Share Analysis
- 6.4 Company Profiles (includes Global level Overview, Market level overview, Core Segments, Financials as available, Strategic Information, Products & Services, Recent Developments)
- 6.4.1 Sembcorp Environmental Management
- 6.4.2 Veolia Environment SA
- 6.4.3 SUEZ
- 6.4.4 PT Prasadha Pamunah Limbah Industri (PPLI)
- 6.4.5 Colex Holdings
- 6.4.6 Remondis
- 6.4.7 ALBA Group Asia
- 6.4.8 Indorama Ventures (PET Recycling)
- 6.4.9 Blue Planet Environmental Solutions
- 6.4.10 Greenway Environmental
- 6.4.11 Starpal
- 6.4.12 Boon Poh Refuse Disposal
- 6.4.13 Binh Duong Water-Environment (BIWASE)
- 6.4.14 Metro Waste Philippines
- 6.4.15 Dangote Waste Management Myanmar
- 6.4.16 Waste4Change Indonesia
- 6.4.17 Khun Recycle Thailand
- 6.4.18 Saigon Green Technology
- 6.4.19 Siam Cement Group (SCG) - Circular Economy Unit
- 6.4.20 Republic Services Singapore JV
7 Market Opportunities & Future Outlook
- 7.1 White-space & Unmet-need Assessment

