PUBLISHER: Mordor Intelligence | PRODUCT CODE: 2117305

PUBLISHER: Mordor Intelligence | PRODUCT CODE: 2117305
Textile Waste Management - Market Share Analysis, Industry Trends & Statistics, Growth Forecasts (2026 - 2031)
According to Mordor Intelligence, textile waste management market size market size in 2026 is estimated at USD 31.39 billion, growing from 2025 value of USD 28.35 billion with 2031 projections showing USD 52.18 billion, growing at 10.72% CAGR over 2026-2031.
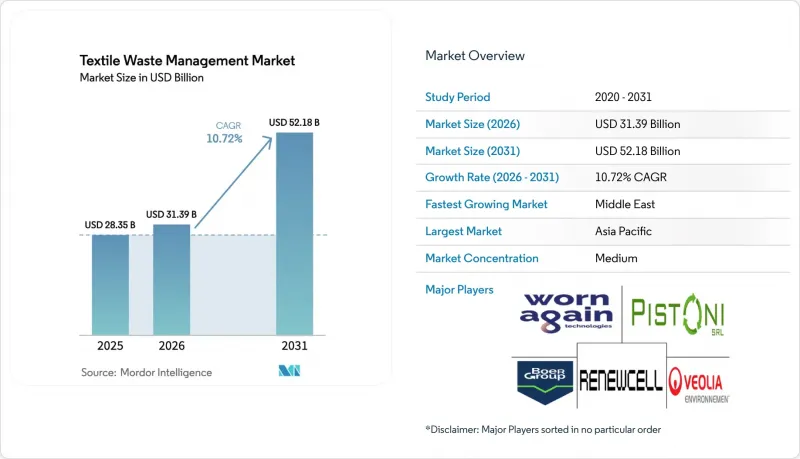
This report is Segmented by Waste Source (Pre-Consumer, Post-Consumer), by Waste Type (Natural Fiber, Synthetic Fiber, and More), by Service (Collection & Logistics, Sorting & Grading, and More), by End-User (Residential / Household, Commercial & Institutional, and More), by Geography (North America, Europe and More). The Market Forecasts are Provided in Terms of Value (USD).
Global Textile Waste Management Market Trends and Insights
Mandatory Separate Textile-Waste Collection Deadlines
Mandatory separate collection deadlines in the European Union, Japan, and South Korea are set to triple the volume of sorted textiles entering formal channels within five years. Early-stage modelling indicates that lower feedstock costs will quickly accentuate the spread between operators who own sorting capacity and those who purchase material on the spot market. As a result, recyclers that finalize offtake agreements now will likely lock in margin advantages before processing fees reset. The accelerated build-out of municipal drop-off sites also creates an immediate need for automated sorting technologies, making investment in optical scanners and robotics a likely priority.
Rapid Urban Middle-Class Growth in South & Southeast Asia
Swelling disposable incomes across Bangladesh, Vietnam, and Indonesia are propelling household textile consumption and correspondingly larger post-consumer waste streams. Formalizing the many informal pickers and traders remains the key hurdle, yet evidence from Bangladesh shows that structured aggregation can simultaneously reduce child labor risks and unlock new green-job pathways. The surge in material flow is prompting local authorities to weigh landfill taxes, a policy step that could compress collection margins if recyclers do not upskill sorting standards. Consequently, developers of low-capex traceability apps stand to gain a first-mover advantage by streamlining payment flows to informal collectors.
Surge in Sustainability-Linked Finance
Green bonds, transition loans, and blended-finance vehicles are reducing the weighted average cost of capital for Textile Waste Management market participants. This cheaper funding drives shorter payback periods for expensive chemical or enzymatic reactors, which historically struggled to reach commercial scale. Because coupon step-ups are tied to diversion or emissions targets, executives now prioritize real-time performance dashboards to avoid margin erosion. Investors are using these data layers to differentiate between operators based on verified impact rather than stated intent, a trend that may penalize firms without rigorous monitoring systems.
Other drivers and restraints analyzed in the detailed report include:
- Escalating Landfill & Incineration Levies
- Fragmented Informal Collection in Africa & South America
For complete list of drivers and restraints, kindly check the Table Of Contents.
Segment Analysis
The pre-consumer segment controls 62.35% of the Textile Waste Management market share in 2025, driven by the concentration of cutting-room waste in large Asian garment factories. Homogeneous clippings simplify baling and allow direct channeling into mechanical recycling lines, reducing unit logistics costs. Because these waste nodes are situated near manufacturing clusters, service providers capture economies of density that translate into higher operating margins. The presence of large volumes at single points also encourages early adoption of digital product passports that certify material origin, an approach that is likely to become a de facto buyer requirement in export markets.
Post-consumer waste is forecast to expand at a 9.55% CAGR through 2031, overtaking growth in the pre-consumer stream as separate-collection mandates formalize household take-back. The proliferation of curbside programs in several U.S. municipalities and EPR proposals in the EU suggests that daily textile disposal will soon be tracked much like glass or paper. That momentum implies a steeper learning curve for automated sorting equipment designed to handle variable fiber blends, pushing technology providers to fine-tune near-infrared scanners and AI classifiers. Firms that master post-consumer variability first will secure premium processing fees as brands race to meet recycled-content targets.
Synthetic fibers, mainly polyester, represent 47.25 % of the Textile Waste Management market size in 2025, reflecting polyester's prominence in apparel. Extensive PET bottle recycling infrastructure provides a partial blueprint; however, closed-loop textile-to-textile streams remain embryonic, keeping fiber-grade output in short supply. Operators that retrofit bottle-line assets to digest fabric waste are discovering higher contamination rates, yet can leverage existing depolymerization know-how to shorten scale-up timelines. The incidence of oil-price swings magnifies the sensitivity of recycled-polyester margins, suggesting that hedging instruments will become standard practice for recyclers.
Cellulosic and regenerated fibers exhibit an 8.63 % forecast CAGR, making them the fastest-growing waste cohort. Advances in enzymatic hydrolysis now convert cotton into dissolving pulp with quality metrics comparable to virgin inputs, enabling textile-to-textile circularity. Pilot-plant data indicate that mixed cotton-poly blends can be fractionated economically when enzymes operate in tandem with mild solvent systems, signalling a path to unlock blended-fabric value. This progress foretells a gradual migration of market share toward chemical routes that can process multi-material garments without large fibre-quality sacrifices.
Complete Report Scope:
- By Waste Source
- Pre-consumer (Manufacturing Scrap)
- Post-consumer (Used Garments & Household Textiles)
- By Waste Type
- Natural Fibers
- Cotton
- Wool
- Silk
- Others(Jute, Animal Fibre, etc.)
- Synthetic Fibers
- Polyester
- Nylon
- Others (Acrylic, Rayon, etc.)
- Cellulosic & Regenerated Fibers
- Viscose / Rayon
- Lyocell / Modal
- Blended Fabrics
- Hazardous / Contaminated Textiles
- Natural Fibers
- By Service
- Collection & Logistics
- Sorting & Grading
- Recycling (Mechanical, Chemical/Enzymatic, Reuse)
- Energy Recovery (Incineration & WtE)
- Landfill / Open Dumping
- By End-User
- Residential / Household
- Commercial & Institutional (Retail, Hospitality)
- Industrial Manufacturing (Apparel & Footwear)
- Others (Municipal Garbage, Medical Facilities, etc.)
- By Geography
- North America
- United States
- Canada
- Mexico
- South America
- Brazil
- Argentina
- Rest of South America
- Europe
- Germany
- France
- United Kingdom
- Italy
- Spain
- BENELUX (Belgium, Netherlands, and Luxembourg)
- NORDICS (Denmark, Finland, Iceland, Norway, and Sweden)
- Rest of Europe
- Asia-Pacific
- China
- Japan
- India
- Bangladesh
- South Korea
- ASEAN (Indonesia, Thailand, Philippines, Malaysia, Vietnam)
- Rest of Asia-Pacific
- Middle East and Africa
- Saudi Arabia
- United Arab Emirates
- Turkey
- Egypt
- South Africa
- Rest of Middle East and Africa
- North America
Geography Analysis
Asia holds 45.65% Textile Waste Management market share in 2025, anchored by China and propelled by India and Bangladesh. While China's policy framework gradually tightens, Bangladesh's transition from informal to semi-formal collection reveals a latent acceleration path once material quality standards stabilize. The formation of industry-government taskforces in Dhaka hints that formal sector recyclers will gain privileged access to waste streams, thereby squeezing intermediaries without compliance capabilities. This transformation implies a likely reshaping of labor practices as mechanized sorting lines replace manual grade-outs.
The Middle East records the highest growth trajectory at 8.15% CAGR for 2026-2031, propelled by sovereign mandates that aim to divert up to 90% of waste from landfills by 2040. Anchor projects such as the Landmark CircuLife facility in the UAE showcase region-specific advantages like low energy costs and integrated free-zone logistics. Regional regulators are imposing minimum recycled-content standards on locally produced textiles, which could generate a captive demand pool for Gulf-based output. The ensuing supply stability may attract global apparel brands to establish sourcing bases in the region, implicitly diversifying geopolitical risk.
Europe leads on regulatory clarity after adopting a union-wide requirement for separate textile collection by January 2025. Current capture rates hover near 15%, indicating ample headroom as infrastructure scales. Parallel debate on eco-modulated fees suggests that producers moving fastest on recyclability design will bear lower compliance costs, incentivizing upstream fiber choices. North America shows uneven progress, with states such as Massachusetts implementing landfill bans that create regional pockets of feedstock surplus, pushing recyclers to expand capacity where policy certainty exists. Latin American and African markets remain constrained by informal systems; however, pilot EPR schemes in Chile and Ghana could serve as templates for broader adoption, signaling entry opportunities once governance stabilizes.
- Worn Again Technologies
- Veolia Environnement S.A.
- Boer Group
- Renewcell AB
- Pistoni S.r.l.
- Lenzing AG
- Textile Recycling International
- RETEXTIL Deutschland GmbH
- Hyosung TNC Corporation
- Infinited Fiber Company
- Aquafil S.p.A.
- Indorama Ventures PLC
- SOEX Group
- Suez SA
- Le Relais Group
- Fabscrap Inc.
- Patagonia Inc. (Textile Circularity)
- Gr3n SA
- Recover Textile Systems
- Waste Management Inc.
Additional Benefits:
- The market estimate (ME) sheet in Excel format
- 3 months of analyst support
TABLE OF CONTENTS
1 Introduction
- 1.1 Study Assumptions & Market Definition
- 1.2 Scope of the Study
2 Research Methodology
3 Executive Summary
4 Market Landscape
- 4.1 Market Overview
- 4.2 Market Drivers
- 4.2.1 Mandatory Separate Textile-Waste Collection Deadlines (EU 2025, Japan 2024, South Korea 2025) Expanding Feedstock Supply
- 4.2.2 Rapid Urban Middle-Class Growth in South & Southeast Asia Swelling Post-Consumer Textile Volumes
- 4.2.3 Escalating Landfill & Incineration Levies in Europe and U.S. Driving Municipal Shift to Recycling Contracts
- 4.2.4 GCC Sovereign Circular-Economy Funds Enabling Large-Scale Chemical Recycling Hubs in the Middle East
- 4.2.5 Latin American Extended Producer-Responsibility Laws Formalizing Collection Networks & Stimulating Demand
- 4.2.6 Surge in Sustainability-Linked Finance Lowering Cost of Capital for Global Recycling Infrastructure
- 4.3 Market Restraints
- 4.3.1 Fragmented Informal Collection in Africa & Parts of South America Undermining Feedstock Quality
- 4.3.2 Limited Commercial Readiness of Blended-Fabric Recycling Technologies Restricting Addressable Waste
- 4.3.3 Virgin Polyester Price Volatility Compressing Recycled Fiber Margins Across Asia
- 4.3.4 Patchy EPR Coverage and Policy Uncertainty in North America Hindering Nationwide Scaling
- 4.4 Value / Supply-Chain Analysis
- 4.5 Regulatory & Government Policy Outlook
- 4.6 Technological Outlook
- 4.7 Porter's Five Forces
- 4.7.1 Threat of New Entrants
- 4.7.2 Bargaining Power of Buyers
- 4.7.3 Bargaining Power of Suppliers
- 4.7.4 Threat of Substitutes
- 4.7.5 Intensity of Competitive Rivalry
- 4.8 Impact of Geopolitics on Textile Waste Management
5 Market Size & Growth Forecasts (Value, USD Bn)
- 5.1 By Waste Source
- 5.1.1 Pre-consumer (Manufacturing Scrap)
- 5.1.2 Post-consumer (Used Garments & Household Textiles)
- 5.2 By Waste Type
- 5.2.1 Natural Fibers
- 5.2.1.1 Cotton
- 5.2.1.2 Wool
- 5.2.1.3 Silk
- 5.2.1.4 Others(Jute, Animal Fibre, etc.)
- 5.2.2 Synthetic Fibers
- 5.2.2.1 Polyester
- 5.2.2.2 Nylon
- 5.2.2.3 Others (Acrylic, Rayon, etc.)
- 5.2.3 Cellulosic & Regenerated Fibers
- 5.2.3.1 Viscose / Rayon
- 5.2.3.2 Lyocell / Modal
- 5.2.4 Blended Fabrics
- 5.2.5 Hazardous / Contaminated Textiles
- 5.2.1 Natural Fibers
- 5.3 By Service
- 5.3.1 Collection & Logistics
- 5.3.2 Sorting & Grading
- 5.3.3 Recycling (Mechanical, Chemical/Enzymatic, Reuse)
- 5.3.4 Energy Recovery (Incineration & WtE)
- 5.3.5 Landfill / Open Dumping
- 5.4 By End-User
- 5.4.1 Residential / Household
- 5.4.2 Commercial & Institutional (Retail, Hospitality)
- 5.4.3 Industrial Manufacturing (Apparel & Footwear)
- 5.4.4 Others (Municipal Garbage, Medical Facilities, etc.)
- 5.5 By Geography
- 5.5.1 North America
- 5.5.1.1 United States
- 5.5.1.2 Canada
- 5.5.1.3 Mexico
- 5.5.2 South America
- 5.5.2.1 Brazil
- 5.5.2.2 Argentina
- 5.5.2.3 Rest of South America
- 5.5.3 Europe
- 5.5.3.1 Germany
- 5.5.3.2 France
- 5.5.3.3 United Kingdom
- 5.5.3.4 Italy
- 5.5.3.5 Spain
- 5.5.3.6 BENELUX (Belgium, Netherlands, and Luxembourg)
- 5.5.3.7 NORDICS (Denmark, Finland, Iceland, Norway, and Sweden)
- 5.5.3.8 Rest of Europe
- 5.5.4 Asia-Pacific
- 5.5.4.1 China
- 5.5.4.2 Japan
- 5.5.4.3 India
- 5.5.4.4 Bangladesh
- 5.5.4.5 South Korea
- 5.5.4.6 ASEAN (Indonesia, Thailand, Philippines, Malaysia, Vietnam)
- 5.5.4.7 Rest of Asia-Pacific
- 5.5.5 Middle East and Africa
- 5.5.5.1 Saudi Arabia
- 5.5.5.2 United Arab Emirates
- 5.5.5.3 Turkey
- 5.5.5.4 Egypt
- 5.5.5.5 South Africa
- 5.5.5.6 Rest of Middle East and Africa
- 5.5.1 North America
6 Competitive Landscape
- 6.1 Market Concentration Overview
- 6.2 Strategic Moves by Key Players in the Industry
- 6.3 Market Share Analysis (Key Players)
- 6.4 Company Profiles (includes Global-level Overview, Market-level Overview, Core Segments, Financials as available, Strategic Information, Products & Services, Recent Developments)
- 6.4.1 Worn Again Technologies
- 6.4.2 Veolia Environnement S.A.
- 6.4.3 Boer Group
- 6.4.4 Renewcell AB
- 6.4.5 Pistoni S.r.l.
- 6.4.6 Lenzing AG
- 6.4.7 Textile Recycling International
- 6.4.8 RETEXTIL Deutschland GmbH
- 6.4.9 Hyosung TNC Corporation
- 6.4.10 Infinited Fiber Company
- 6.4.11 Aquafil S.p.A.
- 6.4.12 Indorama Ventures PLC
- 6.4.13 SOEX Group
- 6.4.14 Suez SA
- 6.4.15 Le Relais Group
- 6.4.16 Fabscrap Inc.
- 6.4.17 Patagonia Inc. (Textile Circularity)
- 6.4.18 Gr3n SA
- 6.4.19 Recover Textile Systems
- 6.4.20 Waste Management Inc.
7 Market Opportunities & Future Outlook

