PUBLISHER: Mordor Intelligence | PRODUCT CODE: 2116329

PUBLISHER: Mordor Intelligence | PRODUCT CODE: 2116329
US Retail 3PL - Market Share Analysis, Industry Trends & Statistics, Growth Forecasts (2026 - 2031)
According to Mordor Intelligence, the US retail 3PL market size in 2026 is estimated at USD 57.17 billion, growing from 2025 value of USD 55.59 billion with 2031 projections showing USD 65.79 billion, growing at 2.84% CAGR over 2026-2031.
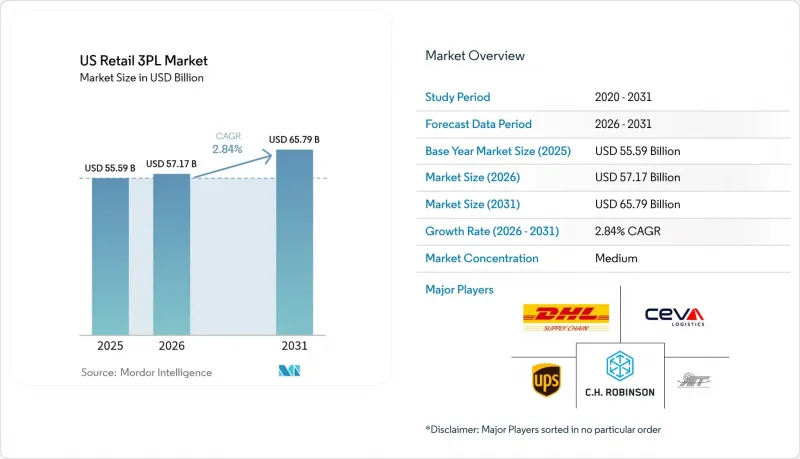
This report is Segmented by Service (Domestic Transportation Management and More), by Product (Food and Beverages, Personal and Household Care and More), by Distribution Channel (Super/Hyper/Convenience and Department Stores and More), by Logistics Model (Asset-Light, Asses-Heavy and More), by Geography (Northeast, Midwest and More). The Market Forecasts are Provided in Terms of Value (USD).
US Retail 3PL Market Trends and Insights
Hyper-local Same-day Delivery Reshapes Urban Logistics
Warehouse vacancy in primary U.S. metros fell to multi-year lows in 2024 as retailers raced to secure infill space required to meet same-day promises. Large-format leases signed by 3PLs accounted for 35% of total industrial activity, reflecting a strategic shift toward urban nodes that compress order-to-door times. The average last-mile delivery cost in dense urban zones reached USD 10.10 per package, up 12% year-over-year, prompting heavy investment in AI-driven routing tools that compress mileage and driver hours. Providers with proprietary micro-fulfillment designs can cut line-haul splits, reduce split-shipments, and capture premium pricing from omnichannel retailers searching for guaranteed same-day coverage.
Online Fresh-Food and Meal-Kit Purchases Drive Cold-Chain Expansion
U.S. consumers accelerated adoption of online grocery baskets in 2024, increasing demand for temperature-controlled square footage that can flex between frozen, chilled, and ambient zones. Major consolidators such as Lineage Logistics and Americold scaled networks through M&A, unlocking capital for high-density automation that sharpens temperature precision and trims energy cost curves. 3PLs bundling route-level telematics and real-time load monitoring are securing multi-year contracts from meal-kit providers that require two-hour delivery windows in metro cores.
Post-pandemic E-commerce Normalization
Domestic freight volumes contracted again in Q1 2025, with shipment indices down 13.8% year-over-year, leaving some 3PL networks over-capacitated. Operators are consolidating micro-fulfillment footprints, sub-leasing unused cross-docks, and doubling down on cost-to-serve analytics to defend margins until demand rebounds.
Other drivers and restraints analyzed in the detailed report include:
- Fashion Returns Accelerate Specialized Reverse Logistics
- Store-based Fulfillment Alters Replenishment Flow
- Consumer Inflation Fatigue
For complete list of drivers and restraints, kindly check the Table Of Contents.
Segment Analysis
Value-Added Warehousing and Distribution generated the fastest 3.65% CAGR outlook, even though Domestic Transportation Management accounted for the single-largest 46.35% revenue slice within the Retail third-party logistics market in 2025. Rising retailer appetite for inventory postponement, kitting, and direct-to-consumer pick-and-pack workflows elevates multi-temperature and high-velocity warehousing assets. The Retail third-party logistics market size allocated to VAWD is projected to widen its share as omni-inventory strategies gain traction. Providers combining robotics, automated storage and retrieval systems, and real-time warehouse execution software deliver cycle-time reductions that translate into measurable sell-through gains for clients. Retailers increased their outsourced warehousing penetration from 43% to 65%, underscoring a strategic handoff that favors 3PLs investing in next-generation fulfillment orchestration. In contrast, Transportation Management remains pivotal for long-haul replenishment yet faces margin compression as contract bid cycles intensify and shippers pursue mode optimization to counter softer freight indices. Still, freight brokerages that add procurement platforms and API-based tender visibility can capture incremental wallet share from smaller shippers. Over the forecast horizon, service differentiation rather than pure asset control is expected to reshape how the Retail third-party logistics market allocates capital.
Domestic Transportation Management specialists are re-positioning to provide end-to-end control tower visibility that syncs with warehouse management systems and returns networks. Standard truckload brokerage margins averaged in the low single digits during 2024, spurring providers to bolt on value-add segments such as cross-dock consolidation, pool distribution, and outbound parcel sortation. As contract rates stabilize, asset-light brokers that embed digital freight matching and predictive pricing algorithms can defend their share. Meanwhile, VAWD innovators that deploy goods-to-person robotics can lift picker productivity by 3-4 x relative to manual zones, enabling higher throughput without proportional headcount increases. Energy-efficient refrigeration investments are also critical because utility costs now account for 12% of total warehouse expense for chilled facilities. Integrating renewable power agreements and battery storage can carve 200-300 basis points off total operating costs, enhancing competitive bids for fresh-food contracts.
Foods and Beverages commanded 27.60% revenue in 2025, reflecting the category's year-round velocity and temperature-sensitive handling needs. Yet Fashion and Lifestyle is slated for a 5.28% CAGR, the steepest among product silos, underpinned by surging e-commerce penetration, seasonal SKU turnover, and return-to-stock speed imperatives. Apparel returns hovering near 50% convert reverse logistics from cost center to premium service, widening margin pools for partners that can grade, steam, and re-package apparel within 48 hours. Garment-on-hanger transport, RFID pallet tracking, and value-added services such as personalization or embroidery amplify the need for specialists capable of tailoring facility layouts to apparel workflows.
Foods and Beverages will continue to anchor fixed-asset deployment, particularly in cold-chain nodes accessible to high-density coastal metros. Multi-tenant facilities equipped with zone-flexing racking systems allow providers to adjust temperature bands as product mix shifts. Personal and Household Care products require strict batch-lot traceability, driving demand for 3PLs certified under current good manufacturing practices. Furniture logistics centers handle outsized SKUs and white-glove final-mile crews trained in in-home assembly, while Electronics and Appliances push 3PLs to integrate secure cages, bonded zones, and lithium battery compliance protocols. Each sub-sector presents addressable white-space for niche entrants that pair category expertise with national reach.
Complete Report Scope:
- By Service
- Domestic Transportation Management
- Roadways
- Railways
- Airways
- Waterways
- International Transportation Management
- Roadways
- Railways
- Airways
- Waterways
- Value-Added Warehousing and Distribution (VAWD)
- Domestic Transportation Management
- By Product
- Foods and Beverages
- Personal and Household Care
- Fashion and Lifestyle (accessories, apparel, footwear)
- Furniture
- Electronics and Household Appliances
- Other Products
- By Distribution Channel
- Super/Hyper/Convenience and Department Stores
- Specialty Stores
- Online
- Other Channels
- By Logistics Model
- Asset-Light (Management-Based)
- Asset-Heavy (Own Fleet and Warehouses)
- Hybrid
- By Geography
- Northeast
- Midwest
- Southwest
- Southeast
- West
List of Companies Covered in this Report:
- DHL Supply Chain
- CEVA Logistics
- AIT Worldwide Logistics
- United Parcel Service, Inc.
- C.H. Robinson Worldwide, Inc.
- Kuehne + Nagel International AG
- FedEx Logistics, Inc.
- GXO Logistics, Inc.
- Expeditors International of Washington, Inc.
- CJ Logistics America, LLC
- Hub Group, Inc.
- ShipMonk LLC
- XPO Logistics, Inc.
- Ryder System, Inc.
- Geodis Americas, LLC
- NFI Industries
- Radial, Inc.
- Saddle Creek Logistics Services
- Ingram Micro Commerce and Lifecycle Services
- Americold Logistics, LLC
- Lineage Logistics Holdings, LLC
- Stord, Inc.
Additional Benefits:
- The market estimate (ME) sheet in Excel format
- 3 months of analyst support
TABLE OF CONTENTS
1 Introduction
- 1.1 Study Assumptions and Market Definition
- 1.2 Scope of the Study
2 Research Methodology
3 Executive Summary
4 Market Landscape
- 4.1 Market Overview
- 4.2 Market Drivers
- 4.2.1 Hyper-local same-day delivery expectation in major metros
- 4.2.2 Rapid penetration of online fresh-food and meal-kit purchases
- 4.2.3 Soaring fashion return rates driving specialized reverse logistics
- 4.2.4 Store-based fulfillment (BOPIS / ship-from-store) reshaping replenishment flows
- 4.2.5 Peak-season "flash event" surges demanding elastic overflow capacity
- 4.3 Market Restraints
- 4.3.1 Post-pandemic normalization of e-commerce growth rates in discretionary retail
- 4.3.2 Consumer inflation fatigue curbing high-ticket online purchases and warehousing demand
- 4.3.3 "Green-miles" skepticism-buyers avoiding retailers with long-haul fulfillment footprints
- 4.4 Value / Supply-Chain Analysis
- 4.5 Industry Policies and Regulations
- 4.6 Technological Developments in Logistics industry
- 4.7 Porter's Five Forces
- 4.7.1 Bargaining Power of Suppliers
- 4.7.2 Bargaining Power of Buyers
- 4.7.3 Threat of New Entrants
- 4.7.4 Threat of Substitutes
- 4.7.5 Competitive Rivalry
- 4.8 Impact of Geopolitical Events on the Market
5 Market Size and Growth Forecasts (Value, USD Bn)
- 5.1 By Service
- 5.1.1 Domestic Transportation Management
- 5.1.1.1 Roadways
- 5.1.1.2 Railways
- 5.1.1.3 Airways
- 5.1.1.4 Waterways
- 5.1.2 International Transportation Management
- 5.1.2.1 Roadways
- 5.1.2.2 Railways
- 5.1.2.3 Airways
- 5.1.2.4 Waterways
- 5.1.3 Value-Added Warehousing and Distribution (VAWD)
- 5.1.1 Domestic Transportation Management
- 5.2 By Product
- 5.2.1 Foods and Beverages
- 5.2.2 Personal and Household Care
- 5.2.3 Fashion and Lifestyle (accessories, apparel, footwear)
- 5.2.4 Furniture
- 5.2.5 Electronics and Household Appliances
- 5.2.6 Other Products
- 5.3 By Distribution Channel
- 5.3.1 Super/Hyper/Convenience and Department Stores
- 5.3.2 Specialty Stores
- 5.3.3 Online
- 5.3.4 Other Channels
- 5.4 By Logistics Model
- 5.4.1 Asset-Light (Management-Based)
- 5.4.2 Asset-Heavy (Own Fleet and Warehouses)
- 5.4.3 Hybrid
- 5.5 By Geography
- 5.5.1 Northeast
- 5.5.2 Midwest
- 5.5.3 Southwest
- 5.5.4 Southeast
- 5.5.5 West
6 Competitive Landscape
- 6.1 Market Concentration
- 6.2 Strategic Moves
- 6.3 Market Share Analysis
- 6.4 Company Profiles (includes Global overview, Market overview, Core Segments, Financials, Strategy, Rank/Share, Products and Services, Recent Developments)
- 6.4.1 DHL Supply Chain
- 6.4.2 CEVA Logistics
- 6.4.3 AIT Worldwide Logistics
- 6.4.4 United Parcel Service, Inc.
- 6.4.5 C.H. Robinson Worldwide, Inc.
- 6.4.6 Kuehne + Nagel International AG
- 6.4.7 FedEx Logistics, Inc.
- 6.4.8 GXO Logistics, Inc.
- 6.4.9 Expeditors International of Washington, Inc.
- 6.4.10 CJ Logistics America, LLC
- 6.4.11 Hub Group, Inc.
- 6.4.12 ShipMonk LLC
- 6.4.13 XPO Logistics, Inc.
- 6.4.14 Ryder System, Inc.
- 6.4.15 Geodis Americas, LLC
- 6.4.16 NFI Industries
- 6.4.17 Radial, Inc.
- 6.4.18 Saddle Creek Logistics Services
- 6.4.19 Ingram Micro Commerce and Lifecycle Services
- 6.4.20 Americold Logistics, LLC
- 6.4.21 Lineage Logistics Holdings, LLC
- 6.4.22 Stord, Inc.
7 Market Opportunities and Future Outlook
8 Appendix
- 8.1 Macroeconomic Indicators
- 8.2 External Trade Statistics
- 8.3 Key Export Destinations and Import Origins

