PUBLISHER: Mordor Intelligence | PRODUCT CODE: 2116415

PUBLISHER: Mordor Intelligence | PRODUCT CODE: 2116415
North America Lubricants - Market Share Analysis, Industry Trends & Statistics, Growth Forecasts (2026 - 2031)
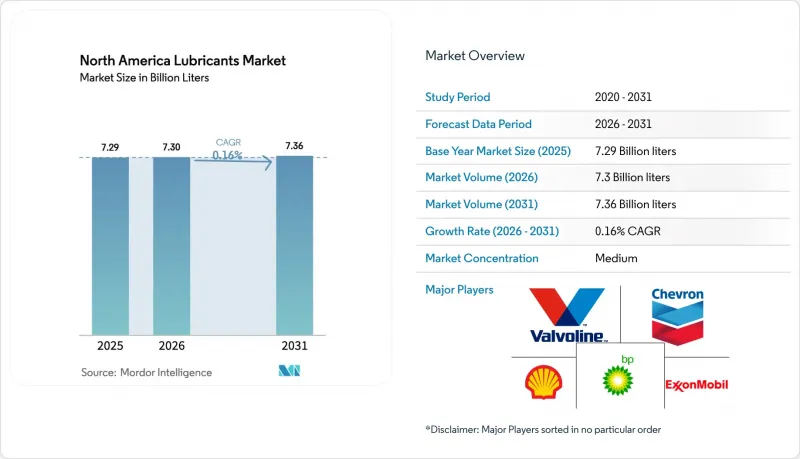
According to Mordor Intelligence, the North America lubricants market size was valued at 7.29 billion liters in 2025 and estimated to grow from 7.3 billion liters in 2026 to reach 7.36 billion liters by 2031, at a CAGR of 0.16% during the forecast period (2026-2031).
This report is Segmented by Product Type (Automotive Engine Oil, Industrial Engine Oil, Transmission Fluids, Gear Oil, Brake Fluids, Hydraulic Fluids, and More), End-User Industry (Automotive, Aerospace, Heavy Equipment, and More), Base Stock Type (Mineral Oil-Based, Synthetic, and More), and Geography (United States, Mexico, Canada). The Market Forecasts are Provided in Terms of Volume (Liters).
North America Lubricants Market Trends and Insights
Synthetic-Lubricant Demand Surge
Synthetic products earn a share across the automotive and industrial equipment sectors because they reduce downtime and extend oil-change intervals, which increases asset utilization and lowers lifecycle costs. Shell reports that hyperscale data-center operators are switching to its immersion-cooling fluids to handle rising chip-level heat loads. The American Petroleum Institute's SQ gasoline-engine oil category, introduced in 2024, requires thermally stable synthetic base stocks, and the ILSAC GF-7 standard slated for 2025 reinforces this shift. OEM warranty terms are increasingly specifying synthetic grades, thereby strengthening pull-through demand in the North American lubricants market. Producers with captive Group III and PAO capacity capitalize on narrowing price gaps versus premium mineral stocks. Greater thermal efficiency also supports decarbonization targets in transport and stationary engines.
Industrial Output Rebound
Construction, mining, and general manufacturing, which rebounded from the 2023 trough, bolsters lubricant consumption in hydraulic systems, gearboxes, and metalworking operations. Public-sector infrastructure outlays stimulate demand for off-highway machinery that relies on low-ash fluids, which are compatible with modern emission controls. Mining companies favor synthetic greases that lengthen relubrication intervals in abrasive environments. Metalworking-fluid uptake follows tooling upgrades as vehicle makers convert lines for battery housing and e-motor production. Mexico's nearshoring inflows magnify factory lubricant demand, lifting the medium-term outlook for the North American lubricants market.
Crude- and Base-Oil Price Volatility
Closures of Group I and Group II units on the U.S. Gulf Coast reduce supply flexibility and magnify the impact of refinery turnarounds on posted prices. Seasonal gasoline demand spikes incentivize refiners to maximize fuel output, tightening base-stock availability and forcing independents to pay spot premiums. Integrated majors absorb feedstock swings but pass costs downstream when Brent widths persist. Bio-based base-oil economics fluctuate with tallow and used-cooking-oil pricing, complicating procurement planning. Distributors hedge inventories yet risk carrying high-priced stocks when futures soften, weighing on near-term margins across the North American lubricants market.
Other drivers and restraints analyzed in the detailed report include:
- Tightening CAFE and EPA Rules
- Expansion of E-Commerce DIY Channels
- Electric-Vehicle Fleet Expansion
For complete list of drivers and restraints, kindly check the Table Of Contents.
Segment Analysis
Automotive engine oils accounted for 39.25% of the North American lubricants market size in 2025, as light-duty and heavy-duty vehicles continue to dominate the rolling stock. The subsegment's value mix tilts toward synthetics that command price premiums, softening the revenue impact of gradual volume decline. Industrial engine oils, although smaller in absolute liters, post the quickest 0.64% CAGR thanks to machinery modernization across metal-cutting, power generation, and agricultural fleets. Transmission-fluid demand shows a bifurcated path: conventional automatics decline, yet purpose-designed e-drive lubricants emerge, carrying a higher unit value. Gear oils benefit from mining and wind-turbine gearboxes that mandate extreme-pressure performance, and hydraulic fluids gain from infrastructure build-outs that specify low-toxicity, fire-resistant grades.
Resilient niche classes add balance to the North American lubricants market. Greases capture opportunities in electric drivetrain bearings, wind turbine pitch systems, and food-processing equipment requiring NSF H1 certification. Metalworking fluids rebound in step with automakers' tooling up for aluminum body-in-white and battery-case machining. Specialty dielectric fluids for data-center immersion cooling, although currently less than 1 % of total liters, grow at a double-digit pace and reinforce the strategic value of high-margin formulations. OEM service-fill contracts act as a lock-in mechanism, making first-fill approvals a critical battleground for suppliers.
Complete Report Scope:
- By Product Type
- Automotive Engine Oil
- Industrial Engine Oil
- Transmission Fluids
- Gear Oil
- Brake Fluids
- Hydraulic Fluids
- Greases
- Process Oil (Including Rubber Process Oil and White Oil)
- Metalworking Fluids
- Turbine Oil
- Transformer Oil
- Other Product Types
- By End-user Industry
- Automotive
- Passenger Vehicles
- Commercial Vehicles
- Two-Wheelers
- Marine
- Aerospace
- Heavy Equipment
- Construction
- Mining
- Agriculture
- Industrial
- Power Generation
- Metallurgy and Metalworking
- Textiles
- Oil and Gas
- Other End-Use Industries
- Automotive
- By Base Stock Type
- Mineral Oil-Based Lubricants
- Synthetic Lubricants
- Semi-Synthetic Lubricants
- Bio-Based Lubricants
List of Companies Covered in this Report:
- AMSOIL Inc.
- Bardahl
- BP p.l.c
- Chevron Corporation
- CITGO Petroleum Lubricants
- Exxon Mobil Corporation
- FUCHS
- Idemitsu Lubricants America
- Kluber Lubrication
- Lucas Oil Products, Inc.
- Motul
- Petro-Canada Lubricants
- Phillips 66 Company
- Quaker Houghton
- Saudi Arabian Oil Co.
- Shell plc
- TotalEnergies
Additional Benefits:
- The market estimate (ME) sheet in Excel format
- 3 months of analyst support
TABLE OF CONTENTS
1 Introduction
- 1.1 Study Assumptions & Market Definition
- 1.2 Scope of the Study
2 Research Methodology
3 Executive Summary
4 Market Landscape
- 4.1 Market Overview
- 4.2 Market Drivers
- 4.2.1 Rising demand for high-performance synthetic lubricants
- 4.2.2 Industrial output rebound across construction, mining and manufacturing
- 4.2.3 Stricter CAFE / EPA fuel-economy rules driving low-viscosity oils
- 4.2.4 Rapid growth of e-commerce DIY aftermarket channels
- 4.2.5 Surging adoption of dielectric immersion-cooling fluids in data centres
- 4.3 Market Restraints
- 4.3.1 Crude- and base-oil price volatility
- 4.3.2 Accelerating electric-vehicle parc lowers ICE-oil volumes
- 4.3.3 Tight PFAS and micro-plastics rules threatening some additive chemistries
- 4.4 Value Chain Analysis
- 4.5 Regulatory Framework
- 4.6 End-User Trends
- 4.6.1 Automotive Industry
- 4.6.2 Manufacturing Industry
- 4.6.3 Power Generation Industry
- 4.7 Porter's Five Forces
- 4.7.1 Bargaining Power of Suppliers
- 4.7.2 Bargaining Power of Buyers
- 4.7.3 Threat of New Entrants
- 4.7.4 Threat of Substitutes
- 4.7.5 Degree of Competition
5 Market Size and Growth Forecasts (Volume)
- 5.1 By Product Type
- 5.1.1 Automotive Engine Oil
- 5.1.2 Industrial Engine Oil
- 5.1.3 Transmission Fluids
- 5.1.4 Gear Oil
- 5.1.5 Brake Fluids
- 5.1.6 Hydraulic Fluids
- 5.1.7 Greases
- 5.1.8 Process Oil (Including Rubber Process Oil and White Oil)
- 5.1.9 Metalworking Fluids
- 5.1.10 Turbine Oil
- 5.1.11 Transformer Oil
- 5.1.12 Other Product Types
- 5.2 By End-user Industry
- 5.2.1 Automotive
- 5.2.1.1 Passenger Vehicles
- 5.2.1.2 Commercial Vehicles
- 5.2.1.3 Two-Wheelers
- 5.2.2 Marine
- 5.2.3 Aerospace
- 5.2.4 Heavy Equipment
- 5.2.4.1 Construction
- 5.2.4.2 Mining
- 5.2.4.3 Agriculture
- 5.2.5 Industrial
- 5.2.5.1 Power Generation
- 5.2.5.2 Metallurgy and Metalworking
- 5.2.5.3 Textiles
- 5.2.5.4 Oil and Gas
- 5.2.5.5 Other End-Use Industries
- 5.2.1 Automotive
- 5.3 By Base Stock Type
- 5.3.1 Mineral Oil-Based Lubricants
- 5.3.2 Synthetic Lubricants
- 5.3.3 Semi-Synthetic Lubricants
- 5.3.4 Bio-Based Lubricants
6 Competitive Landscape
- 6.1 Market Concentration
- 6.2 Strategic Moves
- 6.3 Market Share**(%)/Ranking Analysis
- 6.4 Company Profiles (includes Global level Overview, Market level overview, Core Segments, Financials as available, Strategic Information, Market Rank/Share, Products & Services, Recent Developments)
- 6.4.1 AMSOIL Inc.
- 6.4.2 Bardahl
- 6.4.3 BP p.l.c
- 6.4.4 Chevron Corporation
- 6.4.5 CITGO Petroleum Lubricants
- 6.4.6 Exxon Mobil Corporation
- 6.4.7 FUCHS
- 6.4.8 Idemitsu Lubricants America
- 6.4.9 Kluber Lubrication
- 6.4.10 Lucas Oil Products, Inc.
- 6.4.11 Motul
- 6.4.12 Petro-Canada Lubricants
- 6.4.13 Phillips 66 Company
- 6.4.14 Quaker Houghton
- 6.4.15 Saudi Arabian Oil Co.
- 6.4.16 Shell plc
- 6.4.17 TotalEnergies
7 Market Opportunities & Future Outlook
- 7.1 White-space and Unmet-Need Assessment
8 Key Strategic Questions for CEOs

