PUBLISHER: Mordor Intelligence | PRODUCT CODE: 2116650

PUBLISHER: Mordor Intelligence | PRODUCT CODE: 2116650
Marine Port Services - Market Share Analysis, Industry Trends & Statistics, Growth Forecasts (2026 - 2031)
According to Mordor Intelligence, the marine port services market size was valued at USD 94.45 billion in 2025 and estimated to grow from USD 98.36 billion in 2026 to reach USD 120.47 billion by 2031, at a CAGR of 4.14% during the forecast period (2026-2031).
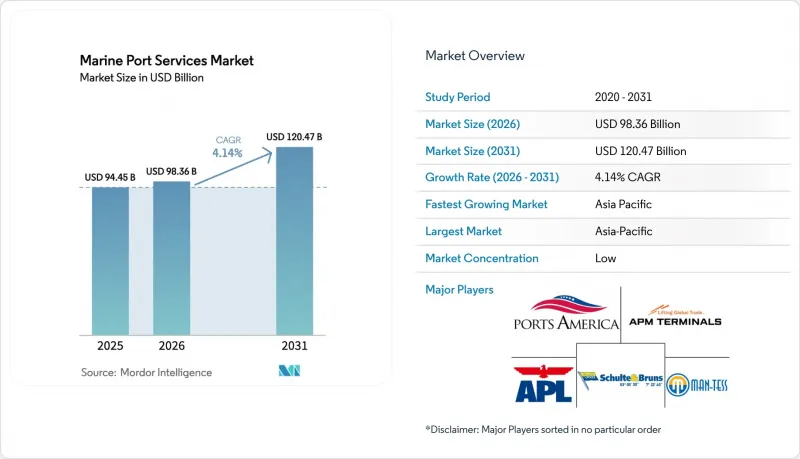
This report is Segmented by Service (Container Handling Services, Ship Repair & Maintenance Services, Supply-Chain & Logistics Solutions, Other Services), Ownership & Governance (State-Owned Ports, PPP/Concession Ports, Private Greenfield Ports), and Geography (North America, South America, Asia-Pacific, Europe, Middle East and Africa). The Market Forecasts are Provided in Terms of Value (USD).
Global Marine Port Services Market Trends and Insights
Surge in Global Containerized Trade Volumes
In 2024, global container volumes rebounded by 6%, reaching a total of 183.2 million TEUs shipped worldwide. As of October 2025, global volumes have already surpassed the previous year's figures by 4%, positioning the industry for a potential record-breaking year. . Leading carriers increased port calls per rotation by 18%, channeling more revenue toward stevedoring and ancillary services. Automated terminals benefited most, registering 25-30% higher productivity and securing price premiums despite larger upfront costs. Port authorities reacted by approving USD 45 billion in expansion projects slated for completion by 2027. The sustained volume pipeline encourages operators to maintain berth utilization above 80%, reinforcing confidence in the marine port services market.
Government-Backed Port Infrastructure Investments
Public funding accelerates modernization, with the EU allocating EUR 12.4 billion (USD 13.68 billion) under TEN-T for maritime corridors. In India, the Sagarmala program coordinates multipurpose terminals and rail connectivity to boost hinterland reach. Around 60% of approved budgets are dedicated to electrification, shore-power, and renewable energy integration, creating long-term demand for engineering, procurement, and construction expertise. Improved infrastructure attracts private concessionaires who pledge performance guarantees, expanding the addressable base of the marine port services market
High Capital Intensity and Long Payback Cycles
Automated container yards require USD 150-200 million upfront, and payback often extends beyond a decade, limiting participation by smaller authorities. Private operators demand minimum-volume clauses that shift demand risk onto port owners, challenging liquidity management. Currency depreciation in several African economies caused port project costs to overrun by up to 30%, underscoring exchange-rate exposure. Elevated interest rates amplify financing hurdles, slowing expansion of the marine port services market.
Other drivers and restraints analyzed in the detailed report include:
- Rapid Digitalization and Automation of Port Operations
- Near-Shoring-Driven Secondary-Port Demand
- Stringent Environmental and Decarbonization Mandates
For complete list of drivers and restraints, kindly check the Table Of Contents.
Segment Analysis
Container handling accounted for 68.40% of the marine port services market share in 2025, validating the structural shift toward containerized trade. The segment benefits from high switching costs and scale advantages, keeping throughput fees firm even in volatile demand cycles. Supply-chain and logistics solutions represent the fastest-growing opportunity, rising at a 4.18% CAGR as ports transform into integrated distribution hubs. Technology-enabled visibility platforms further monetize cargo data streams, supplementing traditional handling revenues.
Real-time analytics have lowered dwell times and reduced the need for buffer stock, allowing shippers to adopt just-in-time models without sacrificing reliability. Automated cranes and stackers require 40% fewer personnel, boosting margins while creating room for performance-based contracting. As multimodal offerings expand, supply-chain services could narrow the revenue gap with core handling functions, reinforcing diversification across the marine port services market.
Complete Report Scope:
- By Service
- Container Handling Services
- Ship Repair and Maintenance Services
- Supply-Chain and Logistics Solutions
- Other Services
- By Ownership and Governance
- State-Owned Ports
- PPP / Concession Ports
- Private Greenfield Ports
- By Geography (Value, USD billion)
- North America
- United States
- Canada
- Mexico
- South America
- Brazil
- Peru
- Chile
- Argentina
- Rest of South America
- Asia-Pacific
- India
- China
- Japan
- Australia
- South Korea
- South East Asia (Singapore, Malaysia, Thailand, Indonesia, Vietnam, and Philippines)
- Rest of Asia-Pacific
- Europe
- United Kingdom
- Germany
- France
- Spain
- Italy
- BENELUX (Belgium, Netherlands, and Luxembourg)
- NORDICS (Denmark, Finland, Iceland, Norway, and Sweden)
- Rest of Europe
- Middle East and Africa
- United Arab of Emirates
- Saudi Arabia
- South Africa
- Nigeria
- Rest of Middle East And Africa
- North America
Geography Analysis
Asia-Pacific retained 40.70% of overall revenue in 2025 and is forecast to grow at 4.67% CAGR through 2031, bolstered by China's automation roadmap and India's Sagarmala corridors. Belt and Road investments totaling USD 62 billion across 34 foreign projects extend Chinese terminal influence, diverting cargo toward preferred routes. Southeast Asian facilities gained 12% volume in 2024, aided by electronics and apparel manufacturing shifts to Vietnam, Thailand, and Indonesia. Port planners emphasize dual-fuel equipment and renewable energy, keeping environmental compliance on track while optimizing operating expenditure.
Europe focuses on decarbonization and digital twins. Rotterdam's EUR 850 million (USD 938.09 million) green-bond program targets shore-power across 25 berths, aiming for carbon-neutral operations by 2030. Hamburg reduced equipment downtime by 22% after adopting predictive models, freeing berth capacity for higher-margin services. Integrated rail and river networks extend port hinterlands deep into Central Europe, mitigating congestion risk and stabilizing the marine port services market.
North America leverages near-shoring to Mexico and infrastructure funding to modernize East and Gulf Coast terminals. Federal support complements private investment, raising crane density and on-dock rail capacity at Houston, New Orleans, and Mobile. Canadian Arctic gateways prepare for seasonal cargo via the Northern Sea Route, positioning for niche grains and minerals trades as ice-free periods lengthen. Competition now hinges on reliability and integrated customs processing rather than solely on vessel size accommodation, reshaping regional dynamics of the marine port services market.
- APM Terminals
- Ports America
- American President Lines (APL) (Subsdiary of CMA CGM)
- MAN-TESS group
- Schulte and Bruns GmbH and Co. KG
- Irish Continental Group
- Velogic
- Supermaritime Group
- Pacific Cargo Services (Division of NKW Group)
- Klaipeda stevedoring company BEGA
- Port Stevedoring (PS)
- Inchcape Shipping Services
- Finnsteve Oy Ab
- Buss Port Services
- Streamline Shipping Group
- Taurus Global Marine
- Rogers Shipping Ltd.
- Celtic Shipping Agencies LTD
- Broekman Logistics
- Jenkins Shipping
Additional Benefits:
- The market estimate (ME) sheet in Excel format
- 3 months of analyst support
TABLE OF CONTENTS
1 Introduction
- 1.1 Study Assumptions and Market Definition
- 1.2 Scope of the Study
2 Research Methodology
3 Executive Summary
4 Market Landscape
- 4.1 Market Overview
- 4.2 Market Drivers
- 4.2.1 Surge in global containerized trade volumes
- 4.2.2 Government-backed port infrastructure investments
- 4.2.3 Rapid digitalization and automation of port operations
- 4.2.4 Near-shoring-driven secondary-port demand
- 4.2.5 Offshore-wind logistics support services
- 4.2.6 Arctic shipping lane emergence
- 4.3 Market Restraints
- 4.3.1 High capital intensity and long payback cycles
- 4.3.2 Stringent environmental and decarbonization mandates
- 4.3.3 Geopolitical chokepoint disruptions
- 4.3.4 Competition from inland dry-ports and land corridors
- 4.4 Value / Supply-Chain Analysis
- 4.5 Regulatory Landscape
- 4.6 Technological Outlook
- 4.7 Porter's Five Forces
- 4.7.1 Threat of New Entrants
- 4.7.2 Bargaining Power of Buyers/Consumers
- 4.7.3 Bargaining Power of Suppliers
- 4.7.4 Threat of Substitute Products
- 4.7.5 Intensity of Competitive Rivalry
- 4.8 Impact of COVID-19 and Geo-Political Events
5 Market Size and Growth Forecasts (Value)
- 5.1 By Service
- 5.1.1 Container Handling Services
- 5.1.2 Ship Repair and Maintenance Services
- 5.1.3 Supply-Chain and Logistics Solutions
- 5.1.4 Other Services
- 5.2 By Ownership and Governance
- 5.2.1 State-Owned Ports
- 5.2.2 PPP / Concession Ports
- 5.2.3 Private Greenfield Ports
- 5.3 By Geography (Value, USD billion)
- 5.3.1 North America
- 5.3.1.1 United States
- 5.3.1.2 Canada
- 5.3.1.3 Mexico
- 5.3.2 South America
- 5.3.2.1 Brazil
- 5.3.2.2 Peru
- 5.3.2.3 Chile
- 5.3.2.4 Argentina
- 5.3.2.5 Rest of South America
- 5.3.3 Asia-Pacific
- 5.3.3.1 India
- 5.3.3.2 China
- 5.3.3.3 Japan
- 5.3.3.4 Australia
- 5.3.3.5 South Korea
- 5.3.3.6 South East Asia (Singapore, Malaysia, Thailand, Indonesia, Vietnam, and Philippines)
- 5.3.3.7 Rest of Asia-Pacific
- 5.3.4 Europe
- 5.3.4.1 United Kingdom
- 5.3.4.2 Germany
- 5.3.4.3 France
- 5.3.4.4 Spain
- 5.3.4.5 Italy
- 5.3.4.6 BENELUX (Belgium, Netherlands, and Luxembourg)
- 5.3.4.7 NORDICS (Denmark, Finland, Iceland, Norway, and Sweden)
- 5.3.4.8 Rest of Europe
- 5.3.5 Middle East and Africa
- 5.3.5.1 United Arab of Emirates
- 5.3.5.2 Saudi Arabia
- 5.3.5.3 South Africa
- 5.3.5.4 Nigeria
- 5.3.5.5 Rest of Middle East And Africa
- 5.3.1 North America
6 Competitive Landscape
- 6.1 Market Concentration
- 6.2 Strategic Moves
- 6.3 Market Share Analysis
- 6.4 Company Profiles {(includes Global level Overview, Market level overview, Core Segments, Financials as available, Strategic Information, Market Rank/Share for key companies, Products and Services, and Recent Developments)}
- 6.4.1 APM Terminals
- 6.4.2 Ports America
- 6.4.3 American President Lines (APL) (Subsdiary of CMA CGM)
- 6.4.4 MAN-TESS group
- 6.4.5 Schulte and Bruns GmbH and Co. KG
- 6.4.6 Irish Continental Group
- 6.4.7 Velogic
- 6.4.8 Supermaritime Group
- 6.4.9 Pacific Cargo Services (Division of NKW Group)
- 6.4.10 Klaipeda stevedoring company BEGA
- 6.4.11 Port Stevedoring (PS)
- 6.4.12 Inchcape Shipping Services
- 6.4.13 Finnsteve Oy Ab
- 6.4.14 Buss Port Services
- 6.4.15 Streamline Shipping Group
- 6.4.16 Taurus Global Marine
- 6.4.17 Rogers Shipping Ltd.
- 6.4.18 Celtic Shipping Agencies LTD
- 6.4.19 Broekman Logistics
- 6.4.20 Jenkins Shipping
7 Market Opportunities and Future Outlook
- 7.1 White-space and Unmet-Need Assessment

