PUBLISHER: Mordor Intelligence | PRODUCT CODE: 2117251

PUBLISHER: Mordor Intelligence | PRODUCT CODE: 2117251
Asia-Pacific Structured Cabling - Market Share Analysis, Industry Trends & Statistics, Growth Forecasts (2026 - 2031)
According to Mordor Intelligence, the Asia-Pacific structured cabling market size is expected to grow from USD 4.73 billion in 2025 to USD 5.29 billion in 2026 and is forecast to reach USD 8.46 billion by 2031 at 9.85% CAGR over 2026-2031.
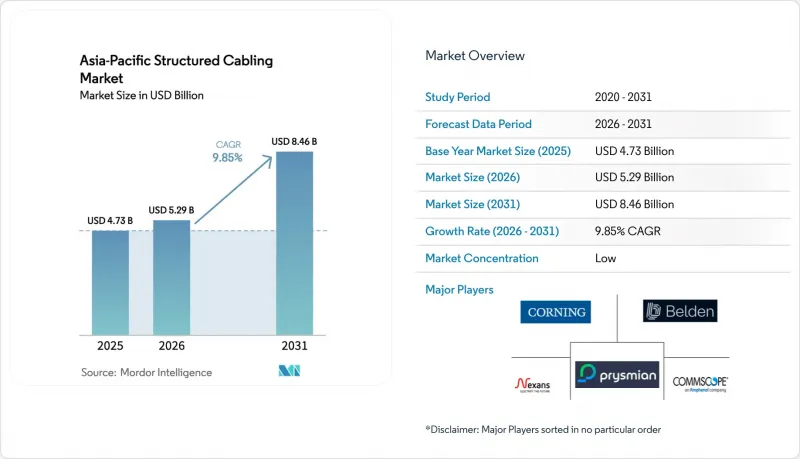
This report is Segmented by Offering (Hardware, Services, and Software), Cable Type (Copper, and Fiber), Cable Category Standard (Cat 5e, and Cat 6), Application (LAN, Data Center, FTTx/Campus Backbone, and Industrial Automation Networks), End-User Industry (IT and Telecom, Cloud and Colocation Data Centers, BFSI, and More), and Geography. Market Forecasts are Provided in Terms of Value (USD).
Asia-Pacific Structured Cabling Market Trends and Insights
Accelerating Hyperscale And Edge Data-Center Build-Outs
Investments from hyperscale providers exceed USD 50 billion across Southeast Asia, India, and Australia, with AWS, Google, Microsoft, Alibaba Cloud, and Oracle each commissioning multigigawatt campuses that rely on 144- or 288-fiber MPO trunks and Cat 6 top-of-rack links. Rising construction in secondary cities such as Hyderabad, Chengdu, and Ho Chi Minh City shortens latency for streaming and gaming applications and enlarges the addressable footprint for vendors. Edge facilities under 5 MW use pre-terminated solutions to cut installation time by up to 40%, leading integrators to favor factory-assembled cassettes over field terminations. Because labor costs in Singapore and Sydney rose 3.8% in 2025, contractors actively seek designs that trim onsite hours without sacrificing performance. Component suppliers that bundle cabling, racks, and cable management gain share by mitigating project risk for hyperscale tenants that demand reliable completion schedules.
Government Fiber-To-The-Home Initiatives
India's BharatNet installed 692,676 km of optical fiber and connected 214,323 gram panchayats by December 2025 under a INR 220 billion (USD 2.6 billion) allocation. Thailand, Indonesia, and Vietnam follow similar blueprints that pair universal service funds with domestic-content rules, steering contracts toward local manufacturers that meet delivery windows in cyclone-prone regions. These mandates elevate single-mode fiber demand, spur fusion splicer sales, and push rural operators to adopt hardened closures that withstand monsoon flooding. Because sovereign broadband plans stretch to 2030 and beyond, structured cabling vendors lock in decade-long revenue visibility and hedge against cyclical data-center spending. The initiatives also foster public-private partnerships that bundle dark-fiber leases with smart-city use cases, accelerating campus backbone upgrades in provincial towns.
Rising Adoption Of Enterprise WLAN And 5G FWA Solutions
Wi-Fi Alliance has certified more than 2,500 Wi-Fi 6E devices, and field trials show average throughputs above 1.7 Gbps, prompting many office planners to adopt a wireless-first strategy that trims the need for new horizontal cable drops. Telcos in India, Indonesia, and the Philippines now market 100-300 Mbps 5G fixed wireless packages, with Reliance Jio alone activating 115,000 FWA terminals during 2025, thereby bypassing last-mile copper or fiber in cost-sensitive locations. Cisco benchmarks indicate that Wi-Fi 6E access points draw roughly 28 watts, requiring 90-watt PoE switch ports but still fewer cable runs per floor, which compresses demand for Cat 6 in small and midsize offices. Systems integrators report that renovation projects now devote only 25% of cabling budgets to copper endpoints compared with 45% in 2022, redirecting spend toward aggregation links and network services. While data-center and hyperscale environments remain insulated because high-density racks depend on fiber trunks, reduced office installations constitute a meaningful headwind for structured-cabling vendors in Australia, Thailand, and urban India.
Other drivers and restraints analyzed in the detailed report include:
- Surge In PoE And Remote Powering Requirements
- Low-Latency Demand For AI And ML Cluster Interconnects
- Supply-Chain Volatility In Copper And Optical Fiber
For complete list of drivers and restraints, kindly check the Table Of Contents.
Segment Analysis
The Asia-Pacific structured cabling market size for hardware reached USD 3.34 billion in 2025, equal to 63.12% of total spend, thanks to copper pairs, fiber trunks, modular panels, and cable management systems that dominate greenfield budgets. Design and installation services, however, are growing at a 10.22% CAGR because enterprises must upgrade legacy cabling to support 90-watt PoE, 10GBASE-T throughput, and Wi-Fi 6E backhaul. This service boom benefits contractors certified under BICSI Installer 2, whose credentials shorten procurement cycles for hyperscale tenants. Vendors bundle as-built documentation and thermal simulation into maintenance contracts that now stretch seven years, reflecting higher rack densities and the scarcity of skilled technicians in Indonesia and India.
Software remains a sliver of revenue but is ascending as hyperscalers automate cable inventories to lower mean-time-to-repair by up to 40%. Platforms that ingest test results directly from Fluke or Viavi certifiers produce ISO-compliant handover packs in minutes, trimming administrative labor. Hybrid build-operate agreements are emerging, where integrators assume responsibility for uptime over a five-year horizon, thus embedding recurring revenue during the post-installation phase. The Asia-Pacific structured cabling market creates room for value-added resellers that overlay digital twin capabilities onto cabling blueprints, enabling predictive maintenance on PoE switch ports and fiber-channel utilization.
Fiber captured 56.41% of 2025 value and is expanding at a 10.97% CAGR because spine-leaf architectures inside AI clusters demand 400G-plus optics and single-mode trunks that sustain link budgets beyond 300 meters. OM4 and OM5 multimode still serve short-reach links inside server rows, yet hyperscalers increasingly leapfrog to single-mode to standardize spares. Copper retains relevance in horizontal runs and industrial plants where Cat 6 shielded cable tolerates electromagnetic interference. Rising copper prices and mining concentration in Chile, Peru, and the Democratic Republic of the Congo amplify price swings, making aluminum-clad copper attractive for budget-constrained LANs.
Connector technology evolves in tandem: LC duplex still dominates data-center patching, but 16-fiber MPO and emerging SN interfaces shrink port counts on 800G switches, driving density gains. Pre-terminated assemblies reduce installer labor by 25-35%, a key selling point amid chronic talent shortages in Southeast Asia. Because fiber boasts lower raw-material volatility than copper, telcos with long planning horizons prefer single-mode to hedge cost risk, reinforcing the Asia-Pacific structured cabling market share advantage for optical connectivity.
Complete Report Scope:
- By Offering
- Hardware
- Cabling (Copper, Fiber)
- Connectivity (Connectors, Patch-Panels, Jacks, Cords)
- Racks, Cabinets and Cable Management
- Services
- Design and Consulting
- Installation and Integration
- Maintenance and Support
- Software
- Hardware
- By Cable Type
- Copper
- Copper Cable
- Copper Connectivity
- Fiber
- Single-Mode Cable
- Multi-Mode Cable
- Fiber Connectivity
- Copper
- By Cable Category Standard
- Cat 5e
- Cat 6
- By Application
- LAN
- Data Center
- FTTx / Campus Backbone
- Industrial Automation Networks
- By End-User Industry
- IT and Telecom Service Providers
- Cloud and Colocation Data Centers
- BFSI and Enterprise Offices
- Healthcare Facilities
- Government and Defense
- Manufacturing and Industrial
- Education
- By Geography
- Asia-Pacific
- China
- India
- Japan
- South Korea
- ASEAN
- Australia
- New Zealand
- Rest of Asia-Pacific
- Asia-Pacific
List of Companies Covered in this Report:
- CommScope Holding Company Inc.
- Corning Incorporated
- Nexans SA
- Prysmian Group SpA
- Belden Inc.
- Legrand SA
- Schneider Electric SE
- Panduit Corp.
- TE Connectivity Ltd.
- Furukawa Electric Co. Ltd.
- Superior Essex Inc.
- The Siemon Company
- Datwyler IT Infra AG
- Reichle & De-Massari AG
- LS Cable & System Ltd.
- Sumitomo Electric Industries Ltd.
- ABB Ltd.
- Rosenberger Hochfrequenztechnik GmbH & Co. KG
- Molex LLC (Koch Industries Inc.)
- General Cable Corporation
Additional Benefits:
- The market estimate (ME) sheet in Excel format
- 3 months of analyst support
TABLE OF CONTENTS
1 INTRODUCTION
- 1.1 Study Assumptions and Market Definition
- 1.2 Scope of the Study
2 RESEARCH METHODOLOGY
3 EXECUTIVE SUMMARY
4 MARKET LANDSCAPE
- 4.1 Market Overview
- 4.2 Market Drivers
- 4.2.1 Accelerating Hyperscale and Edge Data-Center Build-Outs
- 4.2.2 Surge in PoE and Remote Powering Requirements
- 4.2.3 Increasing Retrofits for Smart Buildings and Campuses
- 4.2.4 Government Fiber-to-the-Home (FTTH) Initiatives
- 4.2.5 Low-Latency Demand for AI/ML Cluster Interconnects
- 4.2.6 Convergence of OT/IT Cabling in Industry 4.0 Factories
- 4.3 Market Restraints
- 4.3.1 Rising Adoption of Enterprise WLAN/5G FWA Solutions
- 4.3.2 Complex Standards Compliance and Testing Costs
- 4.3.3 Supply-Chain Volatility in Copper and Optical Fiber
- 4.3.4 Cap-Ex Deferrals Due to Cloud Colocation Shift
- 4.4 Industry Value-Chain Analysis
- 4.5 Regulatory Landscape
- 4.6 Technological Outlook
- 4.7 Porter's Five Forces Analysis
- 4.7.1 Bargaining Power of Suppliers
- 4.7.2 Bargaining Power of Buyers
- 4.7.3 Threat of New Entrants
- 4.7.4 Threat of Substitutes
- 4.7.5 Competitive Rivalry
- 4.8 Impact Assessment of Key Stakeholders
- 4.9 Key Use Cases and Case Studies
- 4.10 Impact of Macroeconomic Factors on the Market
- 4.11 Investment Analysis
5 MARKET SIZE AND GROWTH FORECASTS
- 5.1 By Offering
- 5.1.1 Hardware
- 5.1.1.1 Cabling (Copper, Fiber)
- 5.1.1.2 Connectivity (Connectors, Patch-Panels, Jacks, Cords)
- 5.1.1.3 Racks, Cabinets and Cable Management
- 5.1.2 Services
- 5.1.2.1 Design and Consulting
- 5.1.2.2 Installation and Integration
- 5.1.2.3 Maintenance and Support
- 5.1.3 Software
- 5.1.1 Hardware
- 5.2 By Cable Type
- 5.2.1 Copper
- 5.2.1.1 Copper Cable
- 5.2.1.2 Copper Connectivity
- 5.2.2 Fiber
- 5.2.2.1 Single-Mode Cable
- 5.2.2.2 Multi-Mode Cable
- 5.2.2.3 Fiber Connectivity
- 5.2.1 Copper
- 5.3 By Cable Category Standard
- 5.3.1 Cat 5e
- 5.3.2 Cat 6
- 5.4 By Application
- 5.4.1 LAN
- 5.4.2 Data Center
- 5.4.3 FTTx / Campus Backbone
- 5.4.4 Industrial Automation Networks
- 5.5 By End-User Industry
- 5.5.1 IT and Telecom Service Providers
- 5.5.2 Cloud and Colocation Data Centers
- 5.5.3 BFSI and Enterprise Offices
- 5.5.4 Healthcare Facilities
- 5.5.5 Government and Defense
- 5.5.6 Manufacturing and Industrial
- 5.5.7 Education
- 5.6 By Geography
- 5.6.1 Asia-Pacific
- 5.6.1.1 China
- 5.6.1.2 India
- 5.6.1.3 Japan
- 5.6.1.4 South Korea
- 5.6.1.5 ASEAN
- 5.6.1.6 Australia
- 5.6.1.7 New Zealand
- 5.6.1.8 Rest of Asia-Pacific
- 5.6.1 Asia-Pacific
6 COMPETITIVE LANDSCAPE
- 6.1 Market Concentration
- 6.2 Strategic Moves
- 6.3 Market Share Analysis
- 6.4 Company Profiles (includes Global Level Overview, Market Level Overview, Core Segments, Financials As Available, Strategic Information, Market Rank/Share For Key Companies, Products and Services, and Recent Developments)
- 6.4.1 CommScope Holding Company Inc.
- 6.4.2 Corning Incorporated
- 6.4.3 Nexans SA
- 6.4.4 Prysmian Group SpA
- 6.4.5 Belden Inc.
- 6.4.6 Legrand SA
- 6.4.7 Schneider Electric SE
- 6.4.8 Panduit Corp.
- 6.4.9 TE Connectivity Ltd.
- 6.4.10 Furukawa Electric Co. Ltd.
- 6.4.11 Superior Essex Inc.
- 6.4.12 The Siemon Company
- 6.4.13 Datwyler IT Infra AG
- 6.4.14 Reichle & De-Massari AG
- 6.4.15 LS Cable & System Ltd.
- 6.4.16 Sumitomo Electric Industries Ltd.
- 6.4.17 ABB Ltd.
- 6.4.18 Rosenberger Hochfrequenztechnik GmbH & Co. KG
- 6.4.19 Molex LLC (Koch Industries Inc.)
- 6.4.20 General Cable Corporation
7 MARKET OPPORTUNITIES AND FUTURE OUTLOOK
- 7.1 White-Space and Unmet-Need Assessment

