PUBLISHER: Mordor Intelligence | PRODUCT CODE: 2117253

PUBLISHER: Mordor Intelligence | PRODUCT CODE: 2117253
North America Structured Cabling - Market Share Analysis, Industry Trends & Statistics, Growth Forecasts (2026 - 2031)
According to Mordor Intelligence, the North America structured cabling market size is expected to increase from USD 7.94 billion in 2025 to USD 8.76 billion in 2026 and reach USD 13.42 billion by 2031, growing at a CAGR of 8.91% over 2026-2031.
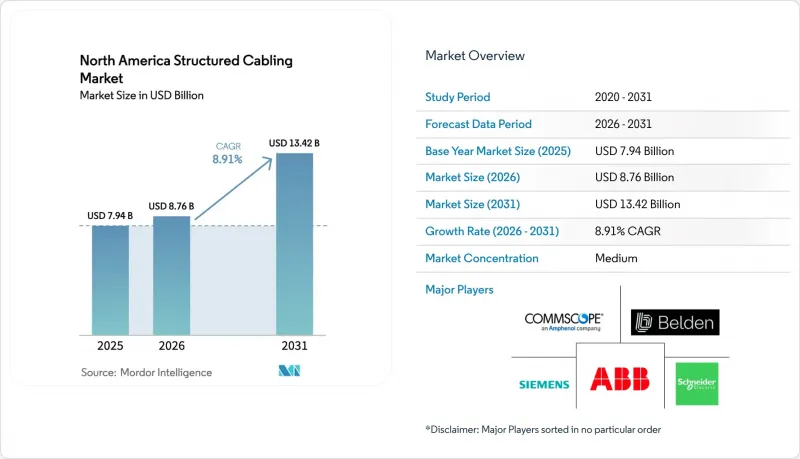
This report is Segmented by Product Type (Copper, and Fiber), Cable Category (Category 5e, Category 6, and More), Component (Cables, Connectivity, and More), Application (LAN, and Data Center), End-User Industry (IT and Telecom, Healthcare, Manufacturing, and More), Installation Type (New Installation, and Upgrade and Retrofit), and Geography. Market Forecasts are Provided in Value (USD).
North America Structured Cabling Market Trends and Insights
Growing Expansion of Hyperscale Data Centers
Hyperscale operators continue to commission gigawatt-scale campuses, adding 7.8 gigawatts of power under construction across the Americas by mid-2025. Amazon's USD 15 billion Indiana complex and Microsoft's USD 4 billion Wisconsin build illustrate the capital intensity behind every new megawatt, each pulling 3-5 kilometers of fiber trunk and 10-15 kilometers of copper cabling for top-of-rack links. The United States hosts 54% of global hyperscale capacity, anchoring regional cable demand. TIA-942-B certification, which prescribes dual pathways and N+1 cable management, elevates per-square-foot spending yet future-proofs plants for 800-gigabit upgrades. AI-optimized designs, such as the USD 7 billion OpenAI-Oracle facility in Michigan, require low-latency spine-leaf topologies that further increase fiber density.
Migration to Higher Bandwidth Category Cables
Category 6A accounted for 41% of United States copper sales in 2025, a four-point gain over 2023, as enterprises targeted 10-gigabit Ethernet to avoid the 30-meter ceiling of Category 8. The IEEE 802.3df roadmap toward 800-gigabit Ethernet accelerates single-mode adoption in data-center spines, yet copper remains entrenched in horizontals due to RJ45 familiarity and mechanical durability. Anticipated ANSI/TIA-568 updates may introduce Category 6B, stretching 10-gigabit reach to 150 meters and extending copper's relevance in campus backbones. Wi-Fi 6E and Wi-Fi 7 upgrades, which need 2.5-gigabit uplinks, are prompting retrofits of legacy Category 5e drops in hospitality and education, converting dormant runs into revenue opportunities. These factors collectively add 1.5 percentage points to the regional CAGR.
Rising Demand for High-Performance Wireless Solutions
Wi-Fi 6E and Wi-Fi 7 close the throughput gap between wired and wireless networks, prompting some enterprises to scale back on horizontal cable counts in favor of dense access-point grids. Although each AP still requires dual Category 6A uplinks for redundancy, the switch from 48-port to 24-port topologies cuts total port density, trimming cable volumes by up to 40%. FCC authorization of the 6 GHz band in 2024 accelerated refresh cycles, and Deloitte expects 40% of pre-2023 wireless estates to be swapped by 2027. While structured cabling retains an anchor role for backhaul, the flexibility and lower upfront cost of wireless-first layouts subtract 0.7 percentage points from forecast CAGR.
Other drivers and restraints analyzed in the detailed report include:
- Increasing Fiber-To-The-Home and 5G Backhaul Deployments
- Rising Adoption of Power over Ethernet for Smart Building Applications
- Complex and Costly Installation in Brownfield Retrofits
For complete list of drivers and restraints, kindly check the Table Of Contents.
Segment Analysis
Copper solutions maintained 58.13% of the North America structured cabling market share in 2025, underscoring their dominance in horizontal links, where Power over Ethernet is paramount. However, fiber revenue is growing 9.37% annually as 400-gigabit and 800-gigabit spines demand single-mode reach beyond 100 meters. Copper margins are under pressure from USD 9,513-per-ton pricing in Q2 2025, which accelerated fiber substitution in rural programs sensitive to material swings.
Multi-mode OM4 and OM5 sustain shorter inter-rack runs, yet operators are pre-cabling with hybrid trunks that accommodate coherent optics upgrades. Fiber's falling cost curve, paired with lower attenuation, tilts long-haul economics decisively in its favor. Copper's chief insulation remains its DC power capability, vital for PoE lighting and industrial Ethernet, where a single medium must carry both data and 90 watts of power.
Category 6 cables accounted for 33.89% of revenue in 2025, yet Category 6A is growing at a 9.89% CAGR on the back of 10-gigabit standardization over 100 meters. United States sales share reached 41% in 2025, a clear pivot from Category 5e's historical dominance. Category 8 remains confined below 5% share because its 30-meter ceiling restricts reach to switch-to-server hops, and its 40-60% price premium erodes return on investment versus fiber.
Anticipated Category 6B specifications extending 10-gigabit to 150 meters could entrench copper even deeper into campus backbones, slowing any rebound for Category 7, whose non-RJ45 connectors and lack of TIA endorsement limit acceptance. BSRIA surveys showed Category 6A global installations rising 12% in 2024, the strongest among copper classes, as building owners avoid stranded investment scenarios experienced during the gigabit transition.
Complete Report Scope:
- By Product Type
- Copper
- Copper Cable
- Copper Connectivity
- Fiber
- Fiber Cable (Single-mode)
- Fiber Cable (Multi-mode)
- Fiber Connectivity
- Copper
- By Cable Category
- Category 5e
- Category 6
- Category 6A
- Category 7
- Category 8
- By Component
- Cables
- Connectivity
- Patch Panels and Cross Connects
- Racks and Cabinets
- Cable Management Accessories
- By Application
- LAN
- Data Center
- By End-User Industry
- IT and Telecom
- Banking, Financial Services, and Insurance (BFSI)
- Government and Defense
- Healthcare
- Manufacturing
- Commercial Buildings
- By Installation Type
- New Installation
- Upgrade and Retrofit
- By Country
- United States
- Canada
- Mexico
List of Companies Covered in this Report:
- Belden Inc.
- The Siemon Company
- Corning Incorporated
- CommScope Inc.
- Anixter Inc.
- Legrand S.A.
- Panduit Corp.
- Schneider Electric SE
- Siemens AG
- Nexans S.A.
- Hubbell Incorporated
- Datwyler IT Infra GmbH
- Prysmian Group
- Superior Essex
- HellermannTyton
- Leviton Manufacturing Co., Inc.
- Reichle & De-Massari AG
- Fluke Networks
- Sterlite Technologies Limited
- ABB Ltd.
Additional Benefits:
- The market estimate (ME) sheet in Excel format
- 3 months of analyst support
TABLE OF CONTENTS
1 INTRODUCTION
- 1.1 Study Assumptions and Market Definition
- 1.2 Scope of the Study
2 RESEARCH METHODOLOGY
3 EXECUTIVE SUMMARY
4 MARKET LANDSCAPE
- 4.1 Market Overview
- 4.2 Market Drivers
- 4.2.1 Growing Expansion of Hyperscale Data Centers
- 4.2.2 Migration to Higher Bandwidth Category Cables
- 4.2.3 Increasing Fiber-To-The-Home and 5G Backhaul Deployments
- 4.2.4 Rising Adoption of Power over Ethernet for Smart Building Applications
- 4.2.5 Edge Data Center Proliferation in Tier-2 Cities
- 4.2.6 Federal Infrastructure Funding Incentives for Rural Broadband Cabling
- 4.3 Market Restraints
- 4.3.1 Rising Demand for High-Performance Wireless Solutions
- 4.3.2 Complex and Costly Installation in Brownfield Retrofits
- 4.3.3 Supply Chain Volatility of Copper and Optical Fiber Raw Materials
- 4.3.4 Skilled Labor Shortage in Certified Cabling Installers
- 4.4 Industry Value Chain Analysis
- 4.5 Regulatory Landscape
- 4.6 Technological Outlook
- 4.7 Impact of Macroeconomic Factors on the Market
- 4.8 Impact of COVID-19 on the North America Structured Cabling Market
- 4.9 Porter's Five Forces Analysis
- 4.9.1 Bargaining Power of Suppliers
- 4.9.2 Bargaining Power of Buyers
- 4.9.3 Threat of New Entrants
- 4.9.4 Threat of Substitutes
- 4.9.5 Intensity of Competitive Rivalry
- 4.10 Investment Analysis
5 MARKET SIZE AND GROWTH FORECASTS (VALUE)
- 5.1 By Product Type
- 5.1.1 Copper
- 5.1.1.1 Copper Cable
- 5.1.1.2 Copper Connectivity
- 5.1.2 Fiber
- 5.1.2.1 Fiber Cable (Single-mode)
- 5.1.2.2 Fiber Cable (Multi-mode)
- 5.1.2.3 Fiber Connectivity
- 5.1.1 Copper
- 5.2 By Cable Category
- 5.2.1 Category 5e
- 5.2.2 Category 6
- 5.2.3 Category 6A
- 5.2.4 Category 7
- 5.2.5 Category 8
- 5.3 By Component
- 5.3.1 Cables
- 5.3.2 Connectivity
- 5.3.3 Patch Panels and Cross Connects
- 5.3.4 Racks and Cabinets
- 5.3.5 Cable Management Accessories
- 5.4 By Application
- 5.4.1 LAN
- 5.4.2 Data Center
- 5.5 By End-User Industry
- 5.5.1 IT and Telecom
- 5.5.2 Banking, Financial Services, and Insurance (BFSI)
- 5.5.3 Government and Defense
- 5.5.4 Healthcare
- 5.5.5 Manufacturing
- 5.5.6 Commercial Buildings
- 5.6 By Installation Type
- 5.6.1 New Installation
- 5.6.2 Upgrade and Retrofit
- 5.7 By Country
- 5.7.1 United States
- 5.7.2 Canada
- 5.7.3 Mexico
6 COMPETITIVE LANDSCAPE
- 6.1 Market Concentration
- 6.2 Strategic Moves
- 6.3 Market Share Analysis
- 6.4 Company Profiles (includes Global Level Overview, Market Level Overview, Core Segments, Financials as available, Strategic Information, Market Rank/Share for key companies, Products and Services, and Recent Developments)
- 6.4.1 Belden Inc.
- 6.4.2 The Siemon Company
- 6.4.3 Corning Incorporated
- 6.4.4 CommScope Inc.
- 6.4.5 Anixter Inc.
- 6.4.6 Legrand S.A.
- 6.4.7 Panduit Corp.
- 6.4.8 Schneider Electric SE
- 6.4.9 Siemens AG
- 6.4.10 Nexans S.A.
- 6.4.11 Hubbell Incorporated
- 6.4.12 Datwyler IT Infra GmbH
- 6.4.13 Prysmian Group
- 6.4.14 Superior Essex
- 6.4.15 HellermannTyton
- 6.4.16 Leviton Manufacturing Co., Inc.
- 6.4.17 Reichle & De-Massari AG
- 6.4.18 Fluke Networks
- 6.4.19 Sterlite Technologies Limited
- 6.4.20 ABB Ltd.
7 MARKET OPPORTUNITIES AND FUTURE OUTLOOK
- 7.1 White-Space and Unmet-Need Assessment

