PUBLISHER: Mordor Intelligence | PRODUCT CODE: 2118124

PUBLISHER: Mordor Intelligence | PRODUCT CODE: 2118124
United States Plastic Waste Management Services - Market Share Analysis, Industry Trends & Statistics, Growth Forecasts (2026 - 2031)
According to Mordor Intelligence, the United States plastic waste management services market size is projected to expand from USD 6.55 billion in 2025 and USD 6.80 billion in 2026 to USD 8.23 billion by 2031, registering a CAGR of 3.89% between 2026 to 2031.
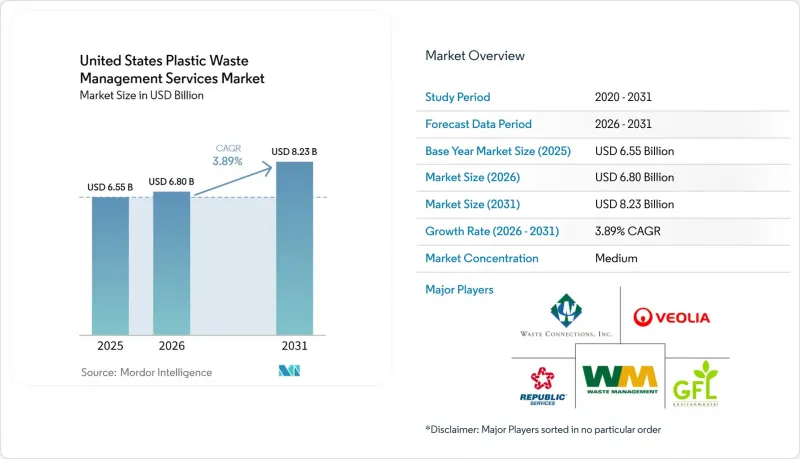
This report is Segmented by Source (Residential, Commercial, Industrial, and Others), by Service Provider (Public/Municipal, Private Waste Management Companies, and Others), and by Service Type (Collection, Transportation, Sorting & Segregation, Disposal / Treatment, and Others). The Market Forecasts are Provided in Terms of Value (USD) and Volume (Tons).
United States Plastic Waste Management Services Market Trends and Insights
Mandatory Recycled Content Requirements for Plastic Packaging
State recycled-content laws are creating a firmer demand floor for recovered resin in the United States plastic waste management services market, as they move demand beyond voluntary packaging pledges. By August 2025, 5 states had enacted minimum post-consumer recycled content laws for plastic packaging, and Maine moved to a 25% requirement for plastic beverage containers effective January 1, 2026. California is also pushing a broad packaging shift under SB 54, which requires all single-use packaging to be recyclable or compostable by 2032 and is already influencing brand redesigns and supplier choices. A 2024 UC Berkeley study cited by APR found that a 40% national recycled content requirement by 2050 could cut United States plastic waste by 50%, lower virgin plastic production by 44%, and reduce greenhouse gas emissions by 17%, which helps explain why long-range infrastructure planning is now leaning more heavily toward recovery capacity. Compliance systems are also becoming more formal as states use verification tools such as APR certification approaches and CalRecycle rulemaking structures, which support more bankable demand conditions for sorting and reprocessing projects.
Escalating Landfill Tipping Fees Improving Recycling Economics
The United States plastic waste management services market is benefiting from rising disposal costs, which improve the relative economics of diversion even when recycled commodity prices are weak. In states with waste-to-energy capacity, the average fee reached USD 71.3 per ton, compared with USD 55.6 per ton in states without that infrastructure, indicating that disposal pressure is strongest in denser coastal systems. That pressure is helping the United States plastic waste management services market move toward fee-for-service pricing, as operators can more directly justify processing charges against avoided disposal costs. Waste Connections stated in its annual filing that it increased recycling collection and processing fees to reflect actual costs better.
Capital-Intensive Modernization of Material Recovery Facilities
The United States plastic waste management services market still faces a significant capital barrier, as many facilities require major upgrades before policy targets can be met. Project examples clearly show the scale, with Lane County's facility estimated at USD 150 million, Rumpke's Columbus center at USD 100 million, and Atlantic Coast Recycling's Passaic redevelopment at USD 47 million. For smaller public systems and rural municipalities, those investment levels are difficult to absorb without deep grant support or a stable producer responsibility funding stream. Higher financing costs and uncertainty over long-term feedstock volumes further delay investment decisions, particularly for independent recyclers and local government-owned facilities. The problem is also recurring because accepted material lists are changing, so sites upgraded for current streams may need more equipment again within 3 to 5 years as packaging rules expand.
Other drivers and restraints analyzed in the detailed report include:
- Growing Investments by Integrated Waste Companies in Recycling Capacity
- Growth in Public-Private Partnerships for Municipal Recycling Operations
- Low Recovery Rates for Flexible Films and Multi-Layer Packaging
For complete list of drivers and restraints, kindly check the Table Of Contents.
Segment Analysis
Industrial sources accounted for 41.2% of the United States plastic waste management services market share in 2025, which made them the largest revenue base among source categories. That position reflects the steady flow of post-industrial scrap from automotive, electronics, chemical, and logistics operations, where plastics are generated in concentrated volumes. These streams usually contain cleaner purges, off-spec pellets, film trim, and molded rejects, so they need less sorting and contamination control than post-consumer loads. The cleaner input profile gives service providers better margins and more predictable throughput in the United States plastic waste management services market.
This advantage is evident in current investment patterns: United States Plastics Recovery doubled shredding and granulating capacity at its Lawrenceville, Georgia, site in January 2026 to handle nearly 50 million pounds of post-industrial polymer a year. Commercial sources are the fastest-growing category and are projected to grow at a 4.7% CAGR through 2031, supported by retailers, food service chains, offices, and other clustered generators that lend themselves well to dedicated route planning. Residential volumes remain important, but they bring higher collection and contamination costs because routes are fragmented and sorting behavior varies widely across households. The others segment, which includes institutions, healthcare, and agriculture, remains smaller but is gaining attention as agricultural film accumulation in Midwestern states draws more notice from state agencies and specialist collectors.
Complete Report Scope:
- By Source
- Residential
- Commercial (Retail, Office, etc.)
- Industrial
- Others (institutional, Agricultural, etc)
- By Service Provider
- Public/Municipal
- Private Waste Management Companies
- Others - Producer Responsibility Organizations (PROs), etc.
- By Service Type
- Collection, Transportation, Sorting & Segregation
- Disposal / Treatment
- Landfill
- Recycling & Resource Recovery
- Incineration & Waste-to-Energy
- Others (Chemical Treatment, etc.)
- Others (Consulting, Audit & Training, etc.)
List of Companies Covered in this Report:
- WM (Waste Management, Inc.)
- Republic Services
- Waste Connections
- Veolia North America
- GFL Environmental
- Clean Harbors
- Reworld
- Recology Inc.
- Casella Waste Systems
- Rumpke Waste & Recycling
- Sims Municipal Recycling
- PreZero US
- FCC Environmental Services
- Remondis Americas
- LRS (Lakeshore Recycling Systems)
- TerraCycle
- KW Plastics
- Balcones Resources
- Nexus Circular
- Circular Services (Closed Loop Partners)
Additional Benefits:
- The market estimate (ME) sheet in Excel format
- 3 months of analyst support
TABLE OF CONTENTS
1 Introduction
- 1.1 Study Assumptions & Market Definition
- 1.2 Scope of the Study
2 Research Methodology
3 Executive Summary
4 Market Landscape
- 4.1 Market Overview
- 4.2 Market Drivers
- 4.2.1 Mandatory Recycled Content Requirements for Plastic Packaging
- 4.2.2 Escalating Landfill Tipping Fees Improving Recycling Economics
- 4.2.3 Growing Investments by Integrated Waste Companies in Recycling Capacity
- 4.2.4 Growth in Public-Private Partnerships for Municipal Recycling Operations
- 4.2.5 Increasing Industrial Plastic Scrap Recovery from Manufacturing
- 4.2.6 Increasing Demand for Closed-Loop Packaging Supply Chains
- 4.3 Market Restraints
- 4.3.1 Capital-Intensive Modernization of Material Recovery Facilities
- 4.3.2 Low Recovery Rates for Flexible Films and Multi-Layer Packaging
- 4.3.3 Insufficient Standardization of Accepted Recyclable Plastics
- 4.3.4 High Transportation Costs for Low-Density Plastic Waste
- 4.4 Value / Supply-Chain Analysis
- 4.5 Regulatory Landscape
- 4.6 Technological Outlook
- 4.7 Startup Ecosystem Analysis
- 4.8 Analysis of Recycled Plastics on Virgin Plastics
- 4.9 Analysis of Plastic Bale & Recycled Resin
- 4.10 Global Trade Flows & Import Restrictions (Waste Plastics)
5 Market Size and Growth Forecasts
- 5.1 By Source
- 5.1.1 Residential
- 5.1.2 Commercial (Retail, Office, etc.)
- 5.1.3 Industrial
- 5.1.4 Others (institutional, Agricultural, etc)
- 5.2 By Service Provider
- 5.2.1 Public/Municipal
- 5.2.2 Private Waste Management Companies
- 5.2.3 Others - Producer Responsibility Organizations (PROs), etc.
- 5.3 By Service Type
- 5.3.1 Collection, Transportation, Sorting & Segregation
- 5.3.2 Disposal / Treatment
- 5.3.2.1 Landfill
- 5.3.2.2 Recycling & Resource Recovery
- 5.3.2.3 Incineration & Waste-to-Energy
- 5.3.2.4 Others (Chemical Treatment, etc.)
- 5.3.3 Others (Consulting, Audit & Training, etc.)
6 Competitive Landscape
- 6.1 Market Concentration
- 6.2 Strategic Moves
- 6.3 Market Share Analysis
- 6.4 Company Profiles {(Includes Global Level Overview, Market Level Overview, Core Segments, Financials as Available, Strategic Information, Products & Services, and Recent Developments)}
- 6.4.1 WM (Waste Management, Inc.)
- 6.4.2 Republic Services
- 6.4.3 Waste Connections
- 6.4.4 Veolia North America
- 6.4.5 GFL Environmental
- 6.4.6 Clean Harbors
- 6.4.7 Reworld
- 6.4.8 Recology Inc.
- 6.4.9 Casella Waste Systems
- 6.4.10 Rumpke Waste & Recycling
- 6.4.11 Sims Municipal Recycling
- 6.4.12 PreZero US
- 6.4.13 FCC Environmental Services
- 6.4.14 Remondis Americas
- 6.4.15 LRS (Lakeshore Recycling Systems)
- 6.4.16 TerraCycle
- 6.4.17 KW Plastics
- 6.4.18 Balcones Resources
- 6.4.19 Nexus Circular
- 6.4.20 Circular Services (Closed Loop Partners)
7 Market Opportunities & Future Outlook
- 7.1 White-space & Unmet-need Assessment

