PUBLISHER: Mordor Intelligence | PRODUCT CODE: 2119087

PUBLISHER: Mordor Intelligence | PRODUCT CODE: 2119087
Asia-Pacific Net-Zero Energy Buildings - Market Share Analysis, Industry Trends & Statistics, Growth Forecasts (2026 - 2031)
According to Mordor Intelligence, the Asia-Pacific net-Zero energy buildings market size is projected to be USD 13.02 billion in 2025, USD 14.03 billion in 2026, and reach USD 30.42 billion by 2031, growing at a CAGR of 16.74% from 2026 to 2031.
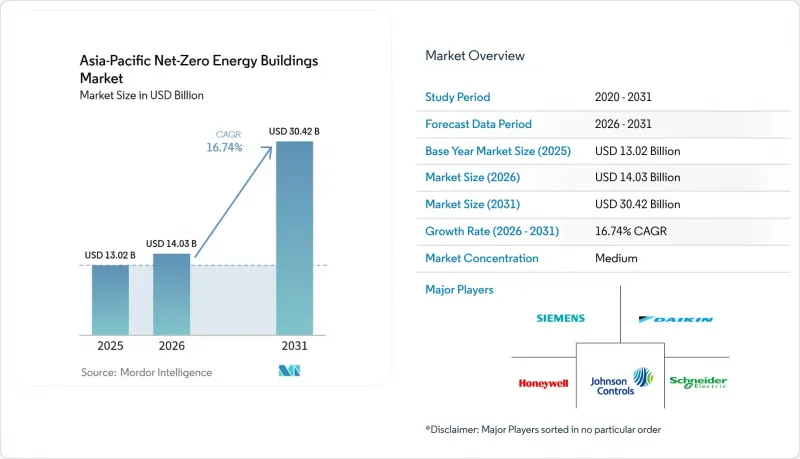
This report is Segmented by Building Type (Residential, Commercial, Institutional, Industrial), Offerings (Solutions, Services), Construction Type (New Construction, Renovation), and Geography (China, Japan, India, Australia, Rest of Asia-Pacific). The Market Forecasts are Provided in Terms of Value (USD).
Asia-Pacific Net-Zero Energy Buildings Market Trends and Insights
Mandatory Net-Zero and Zero-Energy Building Codes Accelerate Market Adoption
Mandatory rules are a central force in the Asia-Pacific net-zero energy buildings market because they make energy performance part of the approval process. Japan made energy-efficiency compliance mandatory for all new residential and nonresidential buildings as of April 1, 2025, under the revised Building Energy Efficiency Act. The rule established ZEB-Oriented performance as the baseline for new nonresidential construction. China issued national group standards in 2025 covering ultra-low-energy housing, public-building carbon intensity, and near-zero-energy design in hot-summer and warm-winter zones. Hainan issued a near-zero-energy building technical standard in March 2026 that requires consumption levels at least 45% below national mandatory norms, and it took effect on April 1, 2026. Different provincial and national requirements can increase the engineering workload for developers operating across multiple jurisdictions, favoring providers that can manage multiple code systems.
Commercial Retrofit Programs Reduce Building Asset Obsolescence
The Asia-Pacific net-zero energy buildings market is also supported by retrofit programs that address the risk of older commercial assets falling behind new performance expectations. Certified green buildings in Asia-Pacific reported energy savings of 20% to 60% and rental premiums of up to 11%, which strengthens the case for owners to invest in upgrades. Japan allocated JPY 14.4 billion (USD 96 million) to its FY2025 Decarbonization Building Renovation Acceleration program for commercial properties. The program targets a 30% to 40% reduction in primary energy use at facilities such as hotels, hospitals, and offices. At Hong Kong University of Science and Technology, Schneider Electric and Veolia financed the upfront retrofit costs for the Lee Shau Kee Business Building and planned to recover over 15 years from verified savings. This approach can make high-performance renovation more accessible to owners who cannot fund the initial upgrade cost directly.
High Upfront Costs and Uncertain Payback Limit Adoption in Secondary Markets
High initial costs remain a material limit on the Asia-Pacific net-zero energy buildings market, especially where construction finance is already constrained. The cost issue is most acute in secondary cities, where developers must weigh long-term energy savings against immediate capital requirements. Research by the World Green Building Council found that green-certified buildings can save 20% to 60% on energy and earn rental premiums of up to 11%. These benefits do not remove the need for financing tools that can convert future savings into capital available at the start of a project. A lack of local green-finance products can slow adoption in markets such as Vietnam and Indonesia. Performance contracts, guarantees, and targeted public support are therefore important for widening access beyond large asset owners.
Other drivers and restraints analyzed in the detailed report include:
- Declining Costs of Solar, Storage, Heat Pumps, and Smart Controls Improve Adoption
- Corporate Demand for Verified Energy Performance Drives Net-Zero Buildings
- Fragmented Building Codes and Renewable Energy Accounting Increase Compliance Complexity
For complete list of drivers and restraints, kindly check the Table Of Contents.
Segment Analysis
Commercial buildings accounted for 45.9% of the Asia-Pacific net-zero energy buildings market share in 2025, driven by corporate sustainability commitments and demand for higher-quality office space. The segment benefits when tenants consider energy performance in leasing and asset selection. Research by the World Green Building Council reported energy savings of 20% to 60% in certified green buildings and rental premiums of up to 11%. These operating and rental outcomes provide developers with a basis for including net-zero specifications at the design stage. Residential buildings remain a major part of the regional opportunity because Japan and South Korea are advancing zero-energy requirements for new homes. Industrial facilities are also relevant as occupiers align building performance with wider Scope 1 and Scope 2 emissions programs.
Institutional buildings are forecast to grow at an 18.1% CAGR through 2031, the fastest rate among building types. Government facilities, universities, and hospitals are often subject to earlier public-sector requirements than private facilities. Taizhou began construction in 2025 of a fever clinic building at the Sixth People's Hospital, described as the city's first near-zero-energy public facility. The project is expected to reduce annual carbon emissions by 3,870 metric tons. The National University of Singapore began work in May 2026 on ArCLab, a historic-building retrofit seeking BCA Green Mark Platinum Zero Energy certification. Public procurement cycles can favor contractors and technology providers that have documented performance in regulated institutional projects.
Complete Report Scope:
- By Building Type
- Residential
- Commercial
- Institutional
- Industrial
- By Offerings
- Solutions (New Net-Zero Energy Building Development, Net-Zero Building Retrofit, Integrated Design & Delivery and Smart Net-Zero Building Solutions)
- Services (Architectural & Engineering Design, Construction Services, Commissioning & Certification Services and Consulting Services)
- By Construction Type
- New Construction
- Renovation
- By Country
- China
- Japan
- India
- Australia
- Rest of Asia-Pacific
List of Companies Covered in this Report:
- Johnson Controls International plc
- Schneider Electric SE
- Siemens Aktiengesellschaft
- Daikin Industries, Ltd.
- Honeywell International Inc.
- Trane Technologies plc
- Carrier Global Corporation
- Mitsubishi Electric Corporation
- Panasonic Holdings Corporation
- ABB Ltd.
- Saint-Gobain S.A.
- Kingspan Group plc
- ROCKWOOL A/S
- Sika AG
- LIXIL Corporation
- AGC Inc.
- China State Construction Engineering Corporation Limited
- Larsen & Toubro Limited
- Sumitomo Forestry Co., Ltd.
- Envision Digital International Pte Ltd.
Additional Benefits:
- The market estimate (ME) sheet in Excel format
- 3 months of analyst support
TABLE OF CONTENTS
1 Introduction
- 1.1 Study Assumptions and Market Definition
- 1.2 Scope of the Study
2 Research Methodology
3 Executive Summary
4 Market Landscape
- 4.1 Market Overview
- 4.2 Market Drivers
- 4.2.1 Mandatory Net-Zero and Zero-Energy Building Codes Accelerate Market Adoption
- 4.2.2 Commercial Retrofit Programs Reduce Building Asset Obsolescence
- 4.2.3 Declining Costs of Solar, Storage, Heat Pumps, and Smart Controls Improve Adoption
- 4.2.4 Corporate Demand for Verified Energy Performance Drives Net-Zero Buildings
- 4.2.5 Grid-Interactive Buildings Create Demand Response Revenue Opportunities
- 4.2.6 Climate-Resilient Passive Design Supports Energy-Efficient Buildings in High-Heat Regions
- 4.3 Market Restraints
- 4.3.1 High Upfront Costs and Uncertain Payback Limit Adoption in Secondary Markets
- 4.3.2 Fragmented Building Codes and Renewable Energy Accounting Increase Compliance Complexity
- 4.3.3 Shortage of Skilled Designers, Commissioning Professionals, and Operators Delays Projects
- 4.3.4 Occupant Behavior and Incomplete Measurement Create Building Performance Gaps
- 4.4 Value and Supply-Chain Analysis
- 4.5 Regulatory Landscape
- 4.6 Technological Outlook
- 4.7 Market Evolution and Adoption Trends
- 4.8 Key Net-Zero Energy Building Projects
- 4.9 Porter's Five Forces Analysis
- 4.9.1 Bargaining Power of Suppliers
- 4.9.2 Bargaining Power of Consumers
- 4.9.3 Threat of New Entrants
- 4.9.4 Threat of Substitutes
- 4.9.5 Intensity of Competitive Rivalry
5 Market Size & Growth Forecasts (Value, USD)
- 5.1 By Building Type
- 5.1.1 Residential
- 5.1.2 Commercial
- 5.1.3 Institutional
- 5.1.4 Industrial
- 5.2 By Offerings
- 5.2.1 Solutions (New Net-Zero Energy Building Development, Net-Zero Building Retrofit, Integrated Design & Delivery and Smart Net-Zero Building Solutions)
- 5.2.2 Services (Architectural & Engineering Design, Construction Services, Commissioning & Certification Services and Consulting Services)
- 5.3 By Construction Type
- 5.3.1 New Construction
- 5.3.2 Renovation
- 5.4 By Country
- 5.4.1 China
- 5.4.2 Japan
- 5.4.3 India
- 5.4.4 Australia
- 5.4.5 Rest of Asia-Pacific
6 Competitive Landscape
- 6.1 Market Concentration
- 6.2 Strategic Moves
- 6.3 Market Share Analysis
- 6.4 Company Profiles (Includes Global Level Overview, Market Level Overview, Core Segments, Financials as Available, Strategic Information, Products & Services, and Recent Developments)
- 6.4.1 Johnson Controls International plc
- 6.4.2 Schneider Electric SE
- 6.4.3 Siemens Aktiengesellschaft
- 6.4.4 Daikin Industries, Ltd.
- 6.4.5 Honeywell International Inc.
- 6.4.6 Trane Technologies plc
- 6.4.7 Carrier Global Corporation
- 6.4.8 Mitsubishi Electric Corporation
- 6.4.9 Panasonic Holdings Corporation
- 6.4.10 ABB Ltd.
- 6.4.11 Saint-Gobain S.A.
- 6.4.12 Kingspan Group plc
- 6.4.13 ROCKWOOL A/S
- 6.4.14 Sika AG
- 6.4.15 LIXIL Corporation
- 6.4.16 AGC Inc.
- 6.4.17 China State Construction Engineering Corporation Limited
- 6.4.18 Larsen & Toubro Limited
- 6.4.19 Sumitomo Forestry Co., Ltd.
- 6.4.20 Envision Digital International Pte Ltd.
7 Market Opportunities & Future Outlook
- 7.1 White-Space and Unmet-Need Assessment

