PUBLISHER: Mordor Intelligence | PRODUCT CODE: 2119800

PUBLISHER: Mordor Intelligence | PRODUCT CODE: 2119800
Auto Loan - Market Share Analysis, Industry Trends & Statistics, Growth Forecasts (2026 - 2031)
According to Mordor Intelligence, the auto loan market size was valued at USD 1.84 trillion in 2025 and is estimated to grow from USD 1.98 trillion in 2026 to reach USD 2.88 trillion by 2031, at a CAGR of 7.78% during the forecast period (2026-2031).
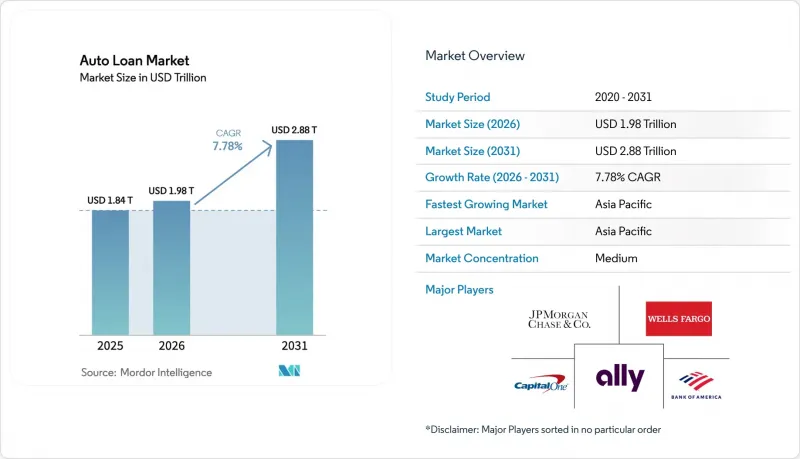
This report is Segmented by Vehicle Type (Passenger Vehicle, Commercial Vehicle), Vehicle Model (Motorcycles/Scooters, Auto-rickshaws/Cargo 3Ws, and More), Ownership (New Vehicles, Used Vehicles), Provider Type (Banks, Non-Banking Financial Institutions, and More), Tenure (Less Than 3 Years, and More), and Geography (North America, and More). The Market Forecasts are Provided in Terms of Value (USD).
Global Auto Loan Market Trends and Insights
Increasing Demand for Passenger Vehicles
Passenger-vehicle originations contributed 81.23% of the 2024 market share and are growing at an 8.95% CAGR, buoyed by rapid urbanization across China, India, and Southeast Asia. Chinese OEMs are on course for a 33% global share by 2030, up from 21% in 2024, spurring captive-finance penetration in export markets. Electric vehicles (EVs) reinforce this trajectory; Asia accounts for 60% of global EV sales as China targets 45% EV penetration of new sales in 2025. Lenders exploit these trends by tailoring residual-value programs for EVs and offering rate incentives that mirror battery warranties.
Quick Digital Loan Processing
Digital origination volumes grew 165% versus 2020, with single-page applications and soft-credit pulls reducing approval times to under two minutes. Capital One's Auto Navigator provides pre-approved rates during vehicle search, while Upstart's AI workflow lets dealers close a deal in less than one minute, automatically delivering FICO Auto Scores and fraud checks. Over 70% of shoppers prefer completing finance steps at home, and dealers report 41% higher close ratios on pre-qualified leads. Platform lenders reap cost efficiencies as automated workflows cut manual underwriting steps and shrink acquisition cost per booked loan.
Rising Interest Rates
Although the Federal Reserve trimmed rates by 25 bps in November 2024, auto APRs remain elevated and weigh on wallet share. Bankrate data confirm that higher policy rates directly translate into more expensive auto loans, especially for subprime tiers. Delinquencies now exceed pre-pandemic peaks, with the Federal Reserve noting performance deterioration across 2022-vintage loans. Lenders are tightening score cutoffs and amplifying the use of alternative data to balance growth and risk.
Other drivers and restraints analyzed in the detailed report include:
- Expansion of Used-Vehicle Financing
- OEM Captive-Finance Growth
- Escalating Vehicle Prices
For complete list of drivers and restraints, kindly check the Table Of Contents.
Segment Analysis
Passenger-vehicle loans accounted for an 80.75% share in the global auto loan market in 2025, and the segment is expected to advance at an 7.46% CAGR, embedding the Global auto loan market in household mobility budgets. The rise of compact SUVs and battery-electric models has broadened borrower profiles, enabling lenders to cross-sell insurance and service contracts. In contrast, commercial-vehicle financing remains cyclical, tied to freight volumes and e-commerce demand. Chinese fleet operators seeking cleaner trucks spur interest in green-finance lines backed by OEM warranties.
The segment contributes materially to the Global auto loan market size because it supports standardized underwriting matrices and robust collateral liquidity. As city congestion policies evolve, lenders develop shared-ownership pilot programs that securitize residual value across multiple users. Commercial-vehicle lenders, meanwhile, deploy telemetry-driven pay-as-you-drive structures that link repayment to mileage and load factors.
Cars-hatchbacks, sedans, and SUVs-held 82.30% share in the global auto loan market in 2025, reflecting entrenched consumer preference and ample dealership financing infrastructure. Yet, motorcycles and scooters outpace with a 9.98% CAGR as urban riders seek affordable and nimble transport. Loan-ticket sizes in this sub-segment are lower, but origination volumes are high, contributing meaningfully to the Global auto loan market depth in India and Southeast Asia.
Financiers craft risk-based pricing for two-wheelers, balancing faster depreciation with higher recovery rates. Cargo three-wheelers and pickups are also joining fintech platforms that offer remote KYC and instant lien registration. Cars continue to dominate securitization pools, ensuring secondary-market liquidity and keeping risk premiums compressed relative to micro-mobility loans.
Complete Report Scope:
- By Vehicle Type
- Passenger Vehicle
- Commercial Vehicle
- By Vehicle Model
- Motorcycles/Scooters
- Auto-rickshaws/Cargo 3Ws
- Cars (Hatchbacks, Sedans, SUVs, etc.)
- Pickups and Small Vans
- Trucks and Buses
- Others
- By Ownership
- New Vehicles
- Used Vehicles
- By Provider Type
- Banks
- Non-Banking Financial Institutions
- Original Equipment Manufacturers
- Other Provider Types (Fintech Companies)
- By Tenure
- Less than 3 Years
- 3-5 Years
- More than 5 years
- By Region
- North America
- United States
- Canada
- Mexico
- South America
- Brazil
- Argentina
- Chile
- Colombia
- Rest of South America
- Europe
- United Kingdom
- Germany
- France
- Spain
- Italy
- Benelux (Belgium, Netherlands, and Luxembourg)
- Nordics (Sweden, Norway, Denmark, Finland, and Iceland)
- Rest of Europe
- Asia-Pacific
- China
- India
- Japan
- South Korea
- Australia
- South-East Asia (Singapore, Indonesia, Malaysia, Thailand, Vietnam, and Philippines)
- Rest of Asia-Pacific
- Middle East and Africa
- United Arab Emirates
- Saudi Arabia
- South Africa
- Nigeria
- Rest of Middle East and Africa
- North America
Geography Analysis
Asia-Pacific anchors the Global auto loan market with a 33.62% 2025 share and a 9.48% CAGR outlook. China's April 2024 policy scrapping minimum down payments ignited credit demand and boosted showroom traffic. The region's EV leadership, with 60% of global sales, pulls lenders toward battery-residual models and charging-subscription add-ons. India and ASEAN members liberalize e-KYC frameworks, enabling two-wheeler credit expansion via smartphone apps.
North America remains mature yet fluid. The CFPB's 2024 supervisory report spotlighted deceptive GAP-waiver and add-on sales, prompting lenders to overhaul disclosures. Average transaction prices at USD 48,000 steer consumers toward longer tenures and used inventory. Digital origination volumes climbed 29% in 2025, as lenders automate income verification and electronic lien filing. Federal Reserve policy keeps prime APRs high, squeezing marginal borrowers and lifting delinquencies above pre-pandemic levels.
Europe contends with regulatory shake-ups. In the United Kingdom, potential GBP 28 billion in redress stemming from commission transparency litigation could reorder lender economics. Meanwhile, securitization volumes reached EUR 137 billion in 2024 as investors sought floating-rate assets. Continental banks upscale green-mobility portfolios, anticipating a USD 30-40 billion uplift to auto-finance gross value added by 2035. Middle East and Africa markets offer white-space growth: GCC banks capitalize on 3.5% GDP growth forecasts to extend Sharia-compliant auto products, while South Africa's digital-on-boarding rules accelerate credit inclusion.
- Ally Financial
- Wells Fargo
- JPMorgan Chase Auto
- Capital One
- Bank of America
- BNP Paribas Personal Finance
- Credit Agricole Auto Bank
- HDFC Bank
- ICICI Bank
- Mashreq Bank
- Toyota Financial Services
- Ford Motor Credit Company
- GM Financial
- Santander Consumer USA
- Hyundai Capital
- Daimler Mobility AG
- Volkswagen Financial Services
- PSA Banque (Stellantis Financial Services)
- Axis Bank
- Barclays
Additional Benefits:
- The market estimate (ME) sheet in Excel format
- 3 months of analyst support
TABLE OF CONTENTS
1 Introduction
- 1.1 Study Assumptions & Market Definition
- 1.2 Scope of the Study
2 Research Methodology
3 Executive Summary
4 Market Landscape
- 4.1 Market Overview
- 4.2 Market Drivers
- 4.2.1 Increasing demand for passenger vehicles
- 4.2.2 Quick digital loan processing
- 4.2.3 Expansion of used-vehicle financing
- 4.2.4 OEM captive-finance growth
- 4.2.5 Embedded finance with mobility platforms
- 4.2.6 AI-based credit scoring for thin-file borrowers
- 4.3 Market Restraints
- 4.3.1 Rising interest rates
- 4.3.2 Escalating vehicle prices
- 4.3.3 Regulatory scrutiny on balloon/long-tenor loans
- 4.3.4 Shift toward vehicle-subscription models
- 4.4 Value / Supply-Chain Analysis
- 4.5 Regulatory Landscape
- 4.6 Technological Outlook
- 4.7 Porter's Five Forces
- 4.7.1 Bargaining Power of Buyers
- 4.7.2 Bargaining Power of Suppliers
- 4.7.3 Threat of New Entrants
- 4.7.4 Threat of Substitutes
- 4.7.5 Intensity of Competitive Rivalry
5 Market Size & Growth Forecasts (Value)
- 5.1 By Vehicle Type
- 5.1.1 Passenger Vehicle
- 5.1.2 Commercial Vehicle
- 5.2 By Vehicle Model
- 5.2.1 Motorcycles/Scooters
- 5.2.2 Auto-rickshaws/Cargo 3Ws
- 5.2.3 Cars (Hatchbacks, Sedans, SUVs, etc.)
- 5.2.4 Pickups and Small Vans
- 5.2.5 Trucks and Buses
- 5.2.6 Others
- 5.3 By Ownership
- 5.3.1 New Vehicles
- 5.3.2 Used Vehicles
- 5.4 By Provider Type
- 5.4.1 Banks
- 5.4.2 Non-Banking Financial Institutions
- 5.4.3 Original Equipment Manufacturers
- 5.4.4 Other Provider Types (Fintech Companies)
- 5.5 By Tenure
- 5.5.1 Less than 3 Years
- 5.5.2 3-5 Years
- 5.5.3 More than 5 years
- 5.6 By Region
- 5.6.1 North America
- 5.6.1.1 United States
- 5.6.1.2 Canada
- 5.6.1.3 Mexico
- 5.6.2 South America
- 5.6.2.1 Brazil
- 5.6.2.2 Argentina
- 5.6.2.3 Chile
- 5.6.2.4 Colombia
- 5.6.2.5 Rest of South America
- 5.6.3 Europe
- 5.6.3.1 United Kingdom
- 5.6.3.2 Germany
- 5.6.3.3 France
- 5.6.3.4 Spain
- 5.6.3.5 Italy
- 5.6.3.6 Benelux (Belgium, Netherlands, and Luxembourg)
- 5.6.3.7 Nordics (Sweden, Norway, Denmark, Finland, and Iceland)
- 5.6.3.8 Rest of Europe
- 5.6.4 Asia-Pacific
- 5.6.4.1 China
- 5.6.4.2 India
- 5.6.4.3 Japan
- 5.6.4.4 South Korea
- 5.6.4.5 Australia
- 5.6.4.6 South-East Asia (Singapore, Indonesia, Malaysia, Thailand, Vietnam, and Philippines)
- 5.6.4.7 Rest of Asia-Pacific
- 5.6.5 Middle East and Africa
- 5.6.5.1 United Arab Emirates
- 5.6.5.2 Saudi Arabia
- 5.6.5.3 South Africa
- 5.6.5.4 Nigeria
- 5.6.5.5 Rest of Middle East and Africa
- 5.6.1 North America
6 Competitive Landscape
- 6.1 Market Concentration
- 6.2 Strategic Moves
- 6.3 Market Share Analysis
- 6.4 Company Profiles (includes Global Level Overview, Market Level Overview, Core Segments, Financials as available, Strategic Information, Market Rank/Share for Key Companies, Products & Services, and Recent Developments)
- 6.4.1 Ally Financial
- 6.4.2 Wells Fargo
- 6.4.3 JPMorgan Chase Auto
- 6.4.4 Capital One
- 6.4.5 Bank of America
- 6.4.6 BNP Paribas Personal Finance
- 6.4.7 Credit Agricole Auto Bank
- 6.4.8 HDFC Bank
- 6.4.9 ICICI Bank
- 6.4.10 Mashreq Bank
- 6.4.11 Toyota Financial Services
- 6.4.12 Ford Motor Credit Company
- 6.4.13 GM Financial
- 6.4.14 Santander Consumer USA
- 6.4.15 Hyundai Capital
- 6.4.16 Daimler Mobility AG
- 6.4.17 Volkswagen Financial Services
- 6.4.18 PSA Banque (Stellantis Financial Services)
- 6.4.19 Axis Bank
- 6.4.20 Barclays
7 Market Opportunities & Future Outlook
- 7.1 White-Space & Unmet-Need Assessment

