PUBLISHER: Mordor Intelligence | PRODUCT CODE: 2121236

PUBLISHER: Mordor Intelligence | PRODUCT CODE: 2121236
Green IT Services - Market Share Analysis, Industry Trends & Statistics, Growth Forecasts (2026 - 2031)
According to Mordor Intelligence, green IT services market size in 2026 is estimated at USD 38.86 billion, growing from 2025 value of USD 32.53 billion with 2031 projections showing USD 94.65 billion, growing at 19.48% CAGR over 2026-2031.
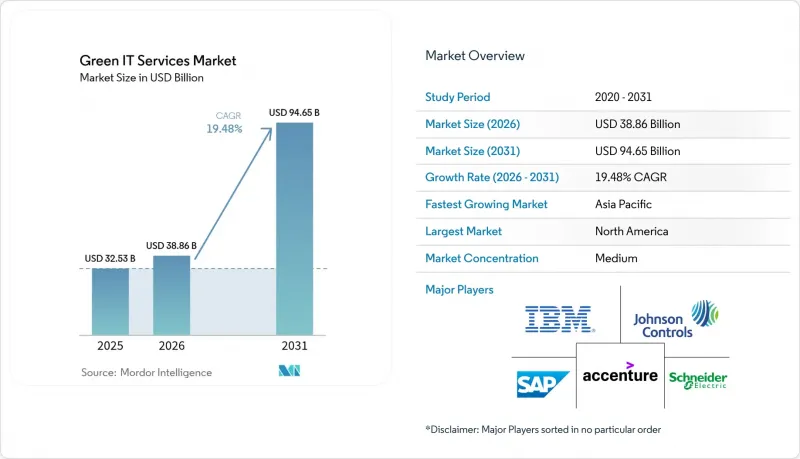
This report is Segmented by Type (Software and Services), Deployment Model (On-Premise, Cloud, and Hybrid), Organization Size (Large Enterprises and Small and Medium Enterprises), Service Area (Data Center Optimization, and More), End-User Vertical (Government, BFSI, IT and Telecom, Industrial, and More), and Geography. The Market Forecasts are Provided in Terms of Value (USD).
Global Green IT Services Market Trends and Insights
Growing Corporate Net-Zero Targets
More than 70% of Fortune 500 companies have committed to achieving carbon neutrality by 2030, prompting CIOs to embed sustainability metrics into their IT purchasing criteria. Financial institutions are deepening the trend; JPMorgan Chase has pledged USD 2.5 trillion for sustainable finance, prompting internal IT teams to favor carbon-efficient architectures. Linking executive compensation to emissions reductions intensifies demand for measurable green IT outcomes, positioning sustainability platforms as strategic enablers rather than discretionary spend. As firms harmonize ESG frameworks with digital roadmaps, service providers that integrate emissions analytics into existing stacks gain a competitive edge. The influence is expected to peak over the next three years as reporting cycles formalize and penalties for non-compliance escalate.
Rising Energy Costs Accelerate ROI Calculations
European commercial power prices were 40% higher in 2024 versus pre-2022 averages, converting green IT from an ethical pursuit to a financial imperative. Enterprises such as Deutsche Bank have realized USD 15 million in annual savings after deploying AI-based thermal management, which paid back in under 18 months. Parallel carbon-pricing regimes, including the EU ETS at USD 80-100 per ton CO2e, widen the cost gap between efficient and legacy infrastructure. As volatility persists, CFOs are now quantifying sustainability projects through net-present-value lenses, propelling the rapid adoption of workload orchestration software that reduces megawatt hours consumed. The near-term payoff re-orders IT capital-allocation priorities toward low-carbon assets.
High Capital Requirements Create Adoption Barriers
Energy-efficient servers cost 20-30% more than conventional models, while mid-sized data center retrofits can require USD 5-10 million, which can strain SME budgets. Limited access to sustainability-linked financing elevates hurdle rates, delaying refresh cycles. Cloud-based subscription services partially offset the burden, yet many organizations still struggle to allocate capital for holistic modernization. As interest-rate environments normalize and green-bond markets mature, financing innovations are expected to moderate this constraint.
Other drivers and restraints analyzed in the detailed report include:
- Strengthening Government Regulations Create Compliance-Driven Demand
- Rapid Growth of Hyperscale Data Centers Adopting Renewable PPAs
- Workforce Skills Gap Constrains Implementation Velocity
For complete list of drivers and restraints, kindly check the Table Of Contents.
Segment Analysis
Services commanded a 64.58% share of the Green IT services market in 2025, underscoring enterprises' reliance on consulting-led engagements for sustainability roadmap development. The services category encompasses advisory, integration, and managed operations that tackle complex legacy estates spanning on-premise, cloud, and edge environments. Players like Accenture have deepened their expertise through the acquisition of carbon analytics boutiques, reinforcing their capability breadth. Software, however, is surging at a 20.71% CAGR as standardized SaaS platforms automate emissions tracking and enable rapid scalability. Subscriptions lower entry barriers for SMEs, broaden the addressable demand, and gradually shift the revenue mix toward recurring licenses across the forecast horizon.
Software's ascent is also fueled by hyperscaler ecosystems that embed carbon-intelligent APIs into DevOps pipelines, thereby shrinking deployment cycles from months to weeks. Early adopters highlight improved auditability and predictive analytics that align IT capacity with renewable generation windows. As regulatory reporting templates converge, software modules that offer pre-populated compliance formats will capture incremental spend, narrowing but not erasing the services lead.
Cloud deployments accounted for 50.15% of revenue in 2025 as enterprises leveraged hyperscalers' renewable power footprints and economy-of-scale efficiencies. The Green IT services market size for cloud workloads reached USD 16.32 billion in 2025, reflecting widespread migration of compute-intensive tasks to carbon-optimal regions. Yet hybrid architectures record the fastest 20.88% CAGR, balancing data sovereignty and latency needs with sustainability objectives.
Hybrid strategies typically retain sensitive workloads in on-premise footprints while offloading analytics and AI functions to green cloud zones. Pharmaceutical firms exemplify this approach, leveraging local data centers for intellectual property security and cloud analytics for carbon optimization. On-premise deployments persist in regulated verticals, such as defense, although their share gradually declines as energy-efficient equipment and microgrid integrations improve economics.
Complete Report Scope:
- By Type
- Software
- Services
- By Deployment Model
- On-Premise
- Cloud
- Hybrid
- By Organization Size
- Large Enterprises
- Small and Medium Enterprises (SMEs)
- By Service Area
- Data Center Optimization
- Workplace and End-user Services
- Asset and Infrastructure Management
- Consulting and Integration
- Enterprise Resource Planning
- By End-user Vertical
- Government
- Banking, Financial Services and Insurance (BFSI)
- IT and Telecom
- Industrial
- Healthcare
- Other End-user Verticals
- By Geography
- North America
- United States
- Canada
- Mexico
- South America
- Brazil
- Argentina
- Rest of South America
- Europe
- Germany
- United Kingdom
- France
- Italy
- Spain
- Russia
- Rest of Europe
- Asia-Pacific
- China
- Japan
- India
- South Korea
- Rest of Asia-Pacific
- Middle East and Africa
- Middle East
- Saudi Arabia
- United Arab Emirates
- Turkey
- Rest of Middle East
- Africa
- South Africa
- Nigeria
- Rest of Africa
- Middle East
- North America
Geography Analysis
North America generated 38.02% of 2025 revenue, underpinned by Environmental Protection Agency guidelines that limit federal agency data center emissions and by voluntary corporate science-based targets. Tax credits in the Inflation Reduction Act lower capital costs for clean energy integration, bolstering uptake among medium-sized enterprises. U.S. multinationals leverage established renewable energy certificate markets, simplifying compliance and supporting export competitiveness.
Europe represents a mature yet expanding opportunity, where high electricity tariffs sharpen ROI on efficiency upgrades. The EU Digital Product Passport and CSRD compel detailed reporting on IT hardware provenance and emissions, driving demand for granular traceability solutions. Vendor differentiation increasingly hinges on EU taxonomy alignment and ISO 14064 verification services. Eastern European member states receive Cohesion Fund allocations earmarked for sustainable digital infrastructure, broadening regional adoption.
Asia-Pacific posts the fastest 22.68% CAGR to 2031. China's carbon-neutrality manifesto and energy-intensity caps trigger accelerated modernization of legacy data centers, while India's renewable auctions and production incentives attract hyperscale investments. Japan's USD 150 billion Green Transformation program subsidizes low-carbon computing, and Australia's Safeguard Mechanism tightens baselines for large emitters, including cloud facilities. South America and the Middle East & Africa remain emergent; foreign direct investment in smart-city and fintech projects catalyzes localized demand, though policy frameworks are still coalescing.
- Accenture plc
- Atos SE
- Capgemini SE
- Cognizant Technology Solutions Corporation
- Cisco Systems, Inc.
- Dell Technologies Inc.
- Fujitsu Limited
- Hitachi, Ltd.
- Hewlett Packard Enterprise Company
- IBM Corporation
- Infosys Limited
- Johnson Controls International plc
- NTT DATA Corporation
- SAP SE
- Schneider Electric SE
- Tata Consultancy Services Limited
- Wipro Limited
- Accuvio Sustainability Software Ltd.
- Dakota Software Corporation
- Sphera Solutions, Inc. (Enviance)
Additional Benefits:
- The market estimate (ME) sheet in Excel format
- 3 months of analyst support
TABLE OF CONTENTS
1 INTRODUCTION
- 1.1 Study Assumptions and Market Definition
- 1.2 Scope of the Study
2 RESEARCH METHODOLOGY
3 EXECUTIVE SUMMARY
4 MARKET LANDSCAPE
- 4.1 Market Overview
- 4.2 Market Drivers
- 4.2.1 Growing Corporate Net-Zero Targets
- 4.2.2 Rising Energy Costs Increasing ROI on Green IT
- 4.2.3 Strengthening Government Regulations on IT Emissions
- 4.2.4 Rapid Growth of Hyperscale DCs adopting Renewable PPAs
- 4.2.5 AI-Driven Real-Time Optimization
- 4.2.6 EU Digital Product Passport Mandates
- 4.3 Market Restraints
- 4.3.1 High Up-front Capex for Green IT Infrastructure
- 4.3.2 Lack of Skilled Workforce
- 4.3.3 Embedded-Carbon Accounting Complexity in Multi-cloud
- 4.3.4 Intermittent Renewable Supply vs IT Load Variability
- 4.4 Impact of Macroeconomic Factors
- 4.5 Industry Supply Chain Analysis
- 4.6 Regulatory Landscape
- 4.7 Technological Outlook
- 4.8 Porter's Five Forces Analysis
- 4.8.1 Bargaining Power of Suppliers
- 4.8.2 Bargaining Power of Buyers
- 4.8.3 Threat of New Entrants
- 4.8.4 Threat of Substitutes
- 4.8.5 Intensity of Competitive Rivalry
5 MARKET SIZE AND GROWTH FORECASTS (VALUE)
- 5.1 By Type
- 5.1.1 Software
- 5.1.2 Services
- 5.2 By Deployment Model
- 5.2.1 On-Premise
- 5.2.2 Cloud
- 5.2.3 Hybrid
- 5.3 By Organization Size
- 5.3.1 Large Enterprises
- 5.3.2 Small and Medium Enterprises (SMEs)
- 5.4 By Service Area
- 5.4.1 Data Center Optimization
- 5.4.2 Workplace and End-user Services
- 5.4.3 Asset and Infrastructure Management
- 5.4.4 Consulting and Integration
- 5.4.5 Enterprise Resource Planning
- 5.5 By End-user Vertical
- 5.5.1 Government
- 5.5.2 Banking, Financial Services and Insurance (BFSI)
- 5.5.3 IT and Telecom
- 5.5.4 Industrial
- 5.5.5 Healthcare
- 5.5.6 Other End-user Verticals
- 5.6 By Geography
- 5.6.1 North America
- 5.6.1.1 United States
- 5.6.1.2 Canada
- 5.6.1.3 Mexico
- 5.6.2 South America
- 5.6.2.1 Brazil
- 5.6.2.2 Argentina
- 5.6.2.3 Rest of South America
- 5.6.3 Europe
- 5.6.3.1 Germany
- 5.6.3.2 United Kingdom
- 5.6.3.3 France
- 5.6.3.4 Italy
- 5.6.3.5 Spain
- 5.6.3.6 Russia
- 5.6.3.7 Rest of Europe
- 5.6.4 Asia-Pacific
- 5.6.4.1 China
- 5.6.4.2 Japan
- 5.6.4.3 India
- 5.6.4.4 South Korea
- 5.6.4.5 Rest of Asia-Pacific
- 5.6.5 Middle East and Africa
- 5.6.5.1 Middle East
- 5.6.5.1.1 Saudi Arabia
- 5.6.5.1.2 United Arab Emirates
- 5.6.5.1.3 Turkey
- 5.6.5.1.4 Rest of Middle East
- 5.6.5.2 Africa
- 5.6.5.2.1 South Africa
- 5.6.5.2.2 Nigeria
- 5.6.5.2.3 Rest of Africa
- 5.6.5.1 Middle East
- 5.6.1 North America
6 COMPETITIVE LANDSCAPE
- 6.1 Market Concentration
- 6.2 Strategic Moves
- 6.3 Market Share Analysis
- 6.4 Company Profiles (includes Global level Overview, Market level overview, Core Segments, Financials as available, Strategic Information, Market Rank/Share for key companies, Products and Services, and Recent Developments)
- 6.4.1 Accenture plc
- 6.4.2 Atos SE
- 6.4.3 Capgemini SE
- 6.4.4 Cognizant Technology Solutions Corporation
- 6.4.5 Cisco Systems, Inc.
- 6.4.6 Dell Technologies Inc.
- 6.4.7 Fujitsu Limited
- 6.4.8 Hitachi, Ltd.
- 6.4.9 Hewlett Packard Enterprise Company
- 6.4.10 IBM Corporation
- 6.4.11 Infosys Limited
- 6.4.12 Johnson Controls International plc
- 6.4.13 NTT DATA Corporation
- 6.4.14 SAP SE
- 6.4.15 Schneider Electric SE
- 6.4.16 Tata Consultancy Services Limited
- 6.4.17 Wipro Limited
- 6.4.18 Accuvio Sustainability Software Ltd.
- 6.4.19 Dakota Software Corporation
- 6.4.20 Sphera Solutions, Inc. (Enviance)
7 MARKET OPPORTUNITIES AND FUTURE OUTLOOK
- 7.1 White-space and Unmet-need Assessment

