PUBLISHER: Mordor Intelligence | PRODUCT CODE: 2121631

PUBLISHER: Mordor Intelligence | PRODUCT CODE: 2121631
Benzene - Market Share Analysis, Industry Trends & Statistics, Growth Forecasts (2026 - 2031)
According to Mordor Intelligence, the benzene market size is expected to grow from 57.08 million tons in 2025 to 59.22 million tons in 2026 and is forecast to reach 71.19 million tons by 2031 at a 3.75% CAGR over 2026-2031.
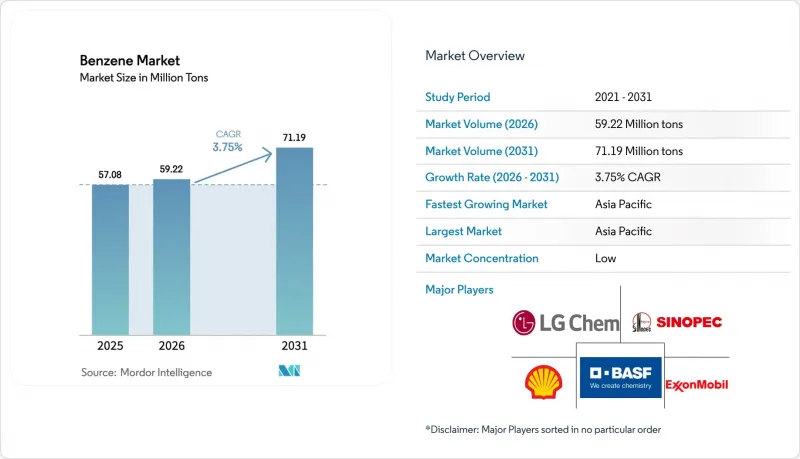
This report is Segmented by Derivative (Ethylbenzene, Cumene, Alkylbenzene, Cyclohexane, Nitrobenzene, and Other Derivatives), End-User Industry (Plastics & Polymers, Resins & Adhesives, Agrochemicals, Pharmaceuticals, Paints, and Coatings & Solvents), and Geography (Asia-Pacific, North America, Europe, South America, and Middle East and Africa). The Market Forecasts are Provided in Terms of Volume (Tons).
Global Benzene Market Trends and Insights
Increasing Demand for Styrene-Based Polymers in Packaging & Automotive
Styrene monomer consumed about 51% of global benzene supply in 2025, underpinning polystyrene markets for packaging and acrylonitrile-butadiene-styrene resins for automotive interiors. Asia-Pacific registers 4-5% annual growth in polystyrene consumption, supported by e-commerce logistics and cold-chain expansion, while North American and European demand grows below 2% amid single-use plastics restrictions. Automotive lightweighting pushes ABS and styrene-acrylonitrile resins into dashboards and exterior trim, sustaining benzene throughput even when packaging moderates. Integrated investments such as BASF's 1 million tpa cracker-styrene complex in Zhanjiang, started in November 2025, exemplify strategic co-location that captures margin and mitigates price volatility. Inventory cycles in both packaging and automotive impose simultaneous supply-chain risks, making flexible production scheduling critical for benzene market participants.
Capacity Additions for Downstream Chemicals by Integrated Producers in Asia
Between 2023 and 2025, Asian complexes added about 12 million tpa of aromatics, anchored by Sinopec-Aramco's USD 10 billion Fujian project and Reliance's USD 9.75 billion crude-to-chemicals facility. Direct crude-to-aromatics technology trims benzene cash costs by USD 50-80 per ton versus European naphtha cracker routes, widening the competitiveness gap. The April 2025 framework for a 1.5 million tpa aromatics plant in Yanbu extends this model to the Gulf, positioning the region as a swing exporter to Europe and Africa. Spot prices in Asia fell from USD 900 per ton in January 2025 to USD 728 per ton in July 2025, reflecting the oversupply cycle. Non-integrated producers consequently curtailed run rates or exported at breakeven, underscoring the necessity of downstream linkages within the benzene market.
Stringent Occupational Exposure Limits & Litigation Risk
OSHA caps benzene exposure at 1 ppm time-weighted average, with similar thresholds under the European Union's REACH framework, compelling continuous air monitoring, personal protective equipment, and medical surveillance. Compliance adds USD 5-10 per ton to production costs in mature regions. Litigation precedents, including refinery worker settlements, elevate liability premiums and accelerate plant closures such as INEOS's scheduled Sarnia exit in June 2026. Regulators in China have begun tightening enforcement, narrowing historical cost advantages for some Asian sites. High compliance spending, combined with muted local derivative demand, underpins a wave of rationalization that redistributes benzene market capacity toward integrated low-cost hubs.
Other drivers and restraints analyzed in the detailed report include:
- Recovery of Construction Sector Boosting Phenol & Caprolactam Chains
- Growing Adoption of Alkylbenzene-Based Surfactants in Emerging Markets
- Volatility of Crude-Oil-Linked Feedstock Prices
For complete list of drivers and restraints, kindly check the Table Of Contents.
Segment Analysis
Ethylbenzene held 51.40% of global demand in 2025, anchoring the benzene market through styrene monomer for polystyrene, ABS, and styrene-butadiene rubber. While the overall benzene market sees slight expansion, growth in polystyrene is tempered by packaging legislation in developed economies. Cumene plays a pivotal role, feeding into phenol-acetone chains associated with construction panels and polycarbonate glazing. Nitrobenzene, while smaller today, records the highest 4.48% CAGR, supported by the polyurethane insulation push and automotive lightweighting. Alkylbenzene contributes to steady surfactant demand, and cyclohexane underpins nylon-6. Specialty outlets such as maleic anhydride and chlorobenzenes collectively remain limited. Integrated complexes, able to swing output among these derivatives, capture diversification benefits unavailable to single-derivative plants, especially during styrene down-cycles.
The benzene market share leadership gives ethylbenzene pricing influence, yet margin resilience increasingly gravitates toward nitrobenzene and pharmaceutical aniline, where ISO-certified supply chains secure premiums. Commodity ethylbenzene plants in Europe face tightening spreads, while Asian nitrobenzene units linked to local MDI facilities post stable earnings. Cross-derivative optionality, such as reallocating benzene from ethylbenzene to nitrobenzene when styrene spreads compress, emerges as a tactical lever for integrated producers. Merchant suppliers without downstream capture must rely on export arbitrage, exposing them to freight, currency, and spot volatility.
Complete Report Scope:
- By Derivative
- Ethylbenzene
- Cumene
- Alkylbenzene
- Cyclohexane
- Nitrobenzene
- Other Derivatives (Aniline, Maleic Anhydride, and more)
- By End-user Industry
- Plastics and Polymers
- Resins & Adhesives
- Agrochemicals
- Pharmaceuticals
- Paints, Coatings, and Solvents
- Geography
- Asia-Pacifc
- China
- India
- Japan
- South Korea
- ASEAN Countries
- Rest of Asia-Pacific
- North America
- United States
- Canada
- Mexico
- Europe
- Germany
- United Kingdom
- France
- Italy
- Spain
- Russia
- NORDIC Countries
- Rest of Europe
- South America
- Brazil
- Argentina
- Rest of South America
- Middle East and Africa
- Saudi Arabia
- South Africa
- Rest of Middle East and Africa
- Asia-Pacifc
Geography Analysis
Asia-Pacific retained 55.80% of global volume in 2025 and is set to post a 4.32% CAGR through 2031. China alone runs more than 18 million tpa of capacity, augmented by Sinopec's multi-site expansions and the Fujian complex under construction for a 2027 start-up. India's Reliance crude-to-chemicals hub adds 3.5 million tpa BTX capability, elevating the country to net-export status by 2028. Japan and South Korea emphasize yield optimization and specialty derivatives, exporting surplus benzene to Taiwan. Thailand and Malaysia fill regional logistics gaps through PTT Global Chemical's 2.42 million tpa and ChemOne's 656 thousand tpa projects, respectively. Lower cash costs, flexible feed slates, and captive derivatives collectively anchor Asia-Pacific leadership in the benzene market.
In North America, US Gulf Coast refineries and ethylene crackers form the backbone, yet the pivot toward ethane feed reduces benzene co-product output, forcing styrene makers to import. OSHA's 1 ppm exposure limit and litigation premiums raise fixed costs, prompting plant rationalization exemplified by INEOS's Sarnia closure plan. Canada and Mexico contribute modest capacity, relying on imports during maintenance or unplanned outages.
In Europe, energy pricing, REACH compliance, and aging assets compress margins. BASF's Verbund network maintains competitiveness through integration, while independent units review divestment or shutdown options. Import reliance deepens as Middle Eastern and Asian exporters target Antwerp-Rotterdam-Amsterdam terminals. Projects such as SABIC's electrically heated furnace in the Netherlands aim to cut emissions and enhance operational flexibility.
South America's benzene market is dominated by Braskem's main chemicals system in Brazil. Operational disruptions in 2025 trimmed exports and weighed on regional prices. The Transforma Sul and Transforma Rio programs will raise gas feedstock share, likely lowering future benzene co-production and tightening supply. Argentina and other producers contribute minor volumes, so incremental demand may be met by imports.
In the Middle East and Africa, Aramco-Sinopec's Yanbu project and the Amiral complex at Jubail expand integrated aromatics in the Gulf. Export optionality through Red Sea and Gulf terminals positions the region as a swing supplier to Europe and Africa. South African demand remains import-oriented. Logistics risks, such as Red Sea transit disruptions, persist, encouraging buyers to diversify contract portfolios within the benzene market.
- BASF
- Braskem S.A.
- Chevron Phillips Chemical Co. LLC
- China Petrochemical Corporation
- Eastman Chemical Company
- Exxon Mobil Corporation
- Formosa Chemicals & Fibre Corporation
- INEOS
- LG Chem
- LyondellBasell Industries N.V.
- Marathon Petroleum Corp.
- Maruzen Petrochemical
- Mitsubishi Chemical Group Corporation.
- PTT Global Chemical PCL
- Reliance Industries Limited
- SABIC
- Shell
- SIBUR
- TotalEnergies
Additional Benefits:
- The market estimate (ME) sheet in Excel format
- 3 months of analyst support
TABLE OF CONTENTS
1 Introduction
- 1.1 Study Assumptions & Market Definition
- 1.2 Scope of the Study
2 Research Methodology
3 Executive Summary
4 Market Landscape
- 4.1 Market Overview
- 4.2 Market Drivers
- 4.2.1 Increasing demand for styrene-based polymers in packaging and automotive
- 4.2.2 Capacity additions for downstream chemicals by integrated producers in Asia
- 4.2.3 Recovery of construction sector boosting phenol and caprolactam chains
- 4.2.4 Growing adoption of alkylbenzene-based surfactants in emerging markets
- 4.2.5 Growing demand for benzene from pharmaceutical industry
- 4.3 Market Restraints
- 4.3.1 Stringent occupational exposure limits and litigation risk
- 4.3.2 Volatility of crude-oil-linked feedstock prices
- 4.3.3 Competing C4 aromatics routes for downstream derivatives
- 4.4 Value Chain Analysis
- 4.5 Regulatory Landscape
- 4.6 Technological Outlook
- 4.7 Price Analysis
- 4.8 Porter's Five Forces
- 4.8.1 Bargaining Power of Suppliers
- 4.8.2 Bargaining Power of Buyers
- 4.8.3 Threat of New Entrants
- 4.8.4 Threat of Substitutes
- 4.8.5 Degree of Competition
5 Market Size & Growth Forecasts (Volume)
- 5.1 By Derivative
- 5.1.1 Ethylbenzene
- 5.1.2 Cumene
- 5.1.3 Alkylbenzene
- 5.1.4 Cyclohexane
- 5.1.5 Nitrobenzene
- 5.1.6 Other Derivatives (Aniline, Maleic Anhydride, and more)
- 5.2 By End-user Industry
- 5.2.1 Plastics and Polymers
- 5.2.2 Resins & Adhesives
- 5.2.3 Agrochemicals
- 5.2.4 Pharmaceuticals
- 5.2.5 Paints, Coatings, and Solvents
- 5.3 Geography
- 5.3.1 Asia-Pacifc
- 5.3.1.1 China
- 5.3.1.2 India
- 5.3.1.3 Japan
- 5.3.1.4 South Korea
- 5.3.1.5 ASEAN Countries
- 5.3.1.6 Rest of Asia-Pacific
- 5.3.2 North America
- 5.3.2.1 United States
- 5.3.2.2 Canada
- 5.3.2.3 Mexico
- 5.3.3 Europe
- 5.3.3.1 Germany
- 5.3.3.2 United Kingdom
- 5.3.3.3 France
- 5.3.3.4 Italy
- 5.3.3.5 Spain
- 5.3.3.6 Russia
- 5.3.3.7 NORDIC Countries
- 5.3.3.8 Rest of Europe
- 5.3.4 South America
- 5.3.4.1 Brazil
- 5.3.4.2 Argentina
- 5.3.4.3 Rest of South America
- 5.3.5 Middle East and Africa
- 5.3.5.1 Saudi Arabia
- 5.3.5.2 South Africa
- 5.3.5.3 Rest of Middle East and Africa
- 5.3.1 Asia-Pacifc
6 Competitive Landscape
- 6.1 Market Concentration
- 6.2 Strategic Moves
- 6.3 Market Share(%)/Ranking Analysis
- 6.4 Company Profiles (includes Global level Overview, Market level overview, Core Segments, Financials as available, Strategic Information, Market Rank/Share for key companies, Products & Services, and Recent Developments)
- 6.4.1 BASF
- 6.4.2 Braskem S.A.
- 6.4.3 Chevron Phillips Chemical Co. LLC
- 6.4.4 China Petrochemical Corporation
- 6.4.5 Eastman Chemical Company
- 6.4.6 Exxon Mobil Corporation
- 6.4.7 Formosa Chemicals & Fibre Corporation
- 6.4.8 INEOS
- 6.4.9 LG Chem
- 6.4.10 LyondellBasell Industries N.V.
- 6.4.11 Marathon Petroleum Corp.
- 6.4.12 Maruzen Petrochemical
- 6.4.13 Mitsubishi Chemical Group Corporation.
- 6.4.14 PTT Global Chemical PCL
- 6.4.15 Reliance Industries Limited
- 6.4.16 SABIC
- 6.4.17 Shell
- 6.4.18 SIBUR
- 6.4.19 TotalEnergies
7 Market Opportunities & Future Outlook
- 7.1 White-space and Unmet-need Assessment
- 7.2 Increasing focus on the production of bio-based benzene

