PUBLISHER: Mordor Intelligence | PRODUCT CODE: 2121648

PUBLISHER: Mordor Intelligence | PRODUCT CODE: 2121648
Gas Turbine - Market Share Analysis, Industry Trends & Statistics, Growth Forecasts (2026 - 2031)
According to Mordor Intelligence, the gas turbine market size is projected to expand from USD 20.25 billion in 2025 and USD 21.11 billion in 2026 to USD 28.84 billion by 2031, registering a CAGR of 6.44% between 2026 to 2031.
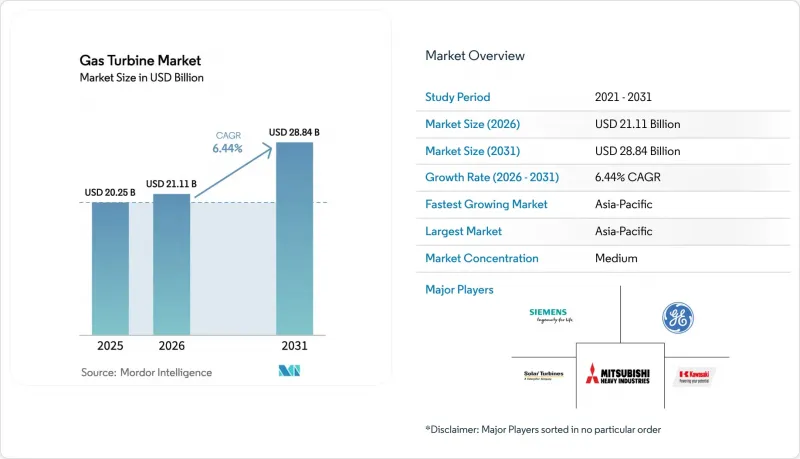
This report is Segmented by Capacity (Below 30 MW, 30 To 120 MW, and Above 120 MW), Operating Cycle (Combined Cycle, Simple/Open Cycle, and Cogeneration/CHP), Fuel Type (Natural Gas, Liquid Fuels, and Other Fuel Types), End-User Industry (Power, Oil and Gas, and Other End-User Industries), and Geography (North America, Europe, Asia-Pacific, South America, and Middle East and Africa).
Global Gas Turbine Market Trends and Insights
Asia-Pacific Coal-to-Gas Transition Accelerating Utility Orders
Large-scale conversions from coal to gas are driving record turbine procurement. Malaysia awarded a 1,400 MW combined-cycle contract in 2024, and Vietnam commissioned more than 2,700 MW of LNG-to-power capacity in 2025. China cleared 12 GW of new gas capacity in 2025 to complement intermittent renewables, with domestic OEMs winning the bulk of orders. Thailand signed a 5,300 MW framework that specifies hydrogen-ready units capable of 30% blends. Singapore brought a 670 MW hydrogen-capable plant online in 2025, strengthening the city-state's decarbonization pathway.
LNG-Linked Island Grids in SEA Driving Mobile Aeroderivative Demand
Island grids are fast-tracking mobile aeroderivative sets to avoid expensive fixed infrastructure. The Bahamas restored post-hurricane supply with four TM2500 units in 2024, leased under 72-hour redeployment clauses. Indonesia's PLN ordered 20 similar units in 2025 for scattered mining and agro-processing hubs. Puerto Rico and several Caribbean nations adopted multi-year leasing pools that integrate rental, fuel logistics, and O&M in single contracts, compressing timelines from three years to under one.
Gas-Price Volatility Post-Ukraine War Curtailing EU Projects
Persistent gas-price swings are eroding project economics. Germany's RWE delayed 1,800 MW of projects in 2024, and Italy's Enel withdrew a 1,200 MW plant in 2025 after failing to secure PPAs above EUR 80 per MWh. Spain redirected capital to batteries, while the UK capacity market cleared at lower prices as imports rose.
Other drivers and restraints analyzed in the detailed report include:
- Petrochemical Cogeneration Build-out in Middle East
- Disaster-Relief Leasing Surge for Aeroderivative Sets in Caribbean
- ESG-Driven Financing Restrictions under EU Taxonomy
For complete list of drivers and restraints, kindly check the Table Of Contents.
Segment Analysis
Mid-range turbines between 30 and 120 MW recorded the fastest growth at a 6.8% CAGR through 2031, reflecting demand for modular projects that avoid multi-year permitting. Above 120 MW machines still represented 58.3% of 2025 installations, but grid-connection bottlenecks and environmental reviews are tempering new orders. The gas turbine market size for the 30 to 120 MW bracket is expected to surpass USD 18 billion by 2031, underpinned by fast-track approvals in Southeast Asia. Regulatory fast-track schemes, such as the Philippines' nine-month permitting window for sub-100 MW plants, underline this momentum.
Project sponsors prefer mid-range sets for incremental expansion. GE's LM6000 secured 18 orders in 2024, citing 12-month delivery schedules. Siemens Energy's SGT-400 continues to dominate emergency back-up throughout the Caribbean disaster-relief segment. Large-frame developments still proceed in Asia-Pacific, but developers increasingly split capacity into multiple 120 MW blocks to mitigate construction risk and align with financing milestones.
Combined-cycle plants controlled 74.9% of the gas turbine market share in 2025 and are forecast to grow at a 7% CAGR to 2031. The gas turbine market size accruing to combined-cycle configurations is projected to add USD 21 billion between 2026 and 2031 as operators pursue 63% net electrical efficiency benchmarks. Simple-cycle machines retain value in peaking and ancillary-service markets, but their share is declining as batteries claim frequency-regulation revenues.
Coupling turbines with desalination is reinforcing combined-cycle economics in the Middle East. UAE's 2,400 MW Hassyan plant pairs power generation with 120 million gallons per day of water production, halving water costs versus standalone reverse-osmosis. Concessional financiers like the Asian Development Bank now use ISO 50001 certification as a gatekeeper for gas-power loans above USD 200 million, further standardizing high-efficiency designs.
Complete Report Scope:
- By Capacity
- Below 30 MW
- 30 to 120 MW
- Above 120 MW
- By Type
- Combined Cycle
- Simple/Open Cycle
- Cogeneration/CHP
- By Fuel Type
- Natural Gas
- Liquid Fuels (Diesel/Kerosene/LPG)
- Other Fuel Types (Hydrogen, Biogas)
- By End-User Industry
- Power
- Oil and Gas
- Other End-user Industries (Industrial, Marine)
- By Geography
- North America
- United States
- Canada
- Mexico
- Europe
- United Kingdom
- Germany
- France
- Italy
- Spain
- Russia
- Rest of Europe
- Asia-Pacific
- China
- India
- Japan
- South Korea
- ASEAN Countries
- Rest of Asia-Pacific
- South America
- Brazil
- Argentina
- Chile
- Rest of South America
- Middle East and Africa
- Saudi Arabia
- United Arab Emirates
- South Africa
- Egypt
- Rest of Middle East and Africa
- North America
Geography Analysis
Asia-Pacific generated 59.5% of global revenue in 2025 and is set to expand at a 7.3% CAGR through 2031, cementing its lead in the gas turbine market. China approved 12 GW of new gas capacity in 2025, with local OEMs securing 70% of orders. India projects 25 GW of additions by 2030, incentivizing joint ventures that localize high-value components. LNG-to-power pipelines totaling 14 GW across Southeast Asia will enter construction before 2028 with multilateral financing support.
North America market growth focused on data-center backup power, LNG export cogeneration, and hydrogen pilots. The United States added 4.8 GW in 2024, and Mexico awarded 2.4 GW of combined-cycle contracts in 2025. Canada's LNG Canada project relies on 1.2 GW of GE turbines for liquefaction, highlighting the role of gas generation in energy exports. Stricter EPA emissions thresholds from 2025 raise capital costs by 8% due to required selective catalytic reduction systems. Europe is facing headwinds from volatile gas prices and ESG financing limits. Germany and Spain deferred combined-cycle projects in 2024, while the UK opted for hydrogen-ready units to meet decarbonization goals. Southern Europe accelerated battery storage approvals, reducing gas peaker prospects.
The Middle East and Africa market is propelled by petrochemical cogeneration and water-plus-power projects. Saudi Arabia commissioned 3.8 GW in 2024, and Egypt placed Africa's largest single turbine order in 2024 for 4.8 GW. South Africa pilots aeroderivative peakers to stabilize coal-heavy grids with African Development Bank support. South America captured 5% of revenue in 2025, leveraging turbines to offset hydropower variability. Brazil and Chile see peaker installations aligned with renewable integration roadmaps.
- General Electric Company
- Siemens Energy AG
- Mitsubishi Heavy Industries Ltd.
- Kawasaki Heavy Industries Ltd.
- Ansaldo Energia SpA
- MAN Energy Solutions SE
- Wartsila Oyj Abp
- Rolls-Royce Holdings plc
- Solar Turbines Incorporated
- Capstone Green Energy Corporation
- Doosan Skoda Power
- IHI Corporation
- Bharat Heavy Electricals Limited
- Harbin Electric Co. Ltd.
- Shanghai Electric Group Co. Ltd.
- OPRA Turbines BV
- Baker Hughes Company
- Vericor Power Systems LLC
- Zorya-Mashproekt
- Nanjing Turbine & Electric Machinery Group
Additional Benefits:
- The market estimate (ME) sheet in Excel format
- 3 months of analyst support
TABLE OF CONTENTS
1 Introduction
- 1.1 Study Assumptions & Market Definition
- 1.2 Scope of the Study
2 Research Methodology
3 Executive Summary
4 Market Landscape
- 4.1 Market Overview
- 4.2 Market Drivers
- 4.2.1 LNG-linked Island Grids in SEA Driving Mobile Aeroderivative Demand
- 4.2.2 Petro-chemical Cogeneration Build-out in Middle East
- 4.2.3 Disaster-Relief Leasing Surge for Aeroderivative Sets in Caribbeans
- 4.3 Market Restraints
- 4.3.1 Gas-price Volatility Post-Ukraine War Curtailing EU Projects
- 4.3.2 Utility-scale Battery Storage Displacing Peaking Turbines (US/Australia)
- 4.3.3 ESG-driven Financing Restrictions under EU Taxonomy
- 4.3.4 Super-alloy Supply-Chain Shortages for Large-Frame Hot-gas-path Parts
- 4.4 Supply-Chain Analysis
- 4.5 Regulatory Landscape
- 4.6 Technological Outlook
- 4.7 Porter's Five Forces Analysis
- 4.7.1 Bargaining Power of Suppliers
- 4.7.2 Bargaining Power of Consumers
- 4.7.3 Threat of New Entrants
- 4.7.4 Threat of Substitute Products and Services
- 4.7.5 Intensity of Competitive Rivalry
5 Market Size & Growth Forecasts
- 5.1 By Capacity
- 5.1.1 Below 30 MW
- 5.1.2 30 to 120 MW
- 5.1.3 Above 120 MW
- 5.2 By Type
- 5.2.1 Combined Cycle
- 5.2.2 Simple/Open Cycle
- 5.2.3 Cogeneration/CHP
- 5.3 By Fuel Type
- 5.3.1 Natural Gas
- 5.3.2 Liquid Fuels (Diesel/Kerosene/LPG)
- 5.3.3 Other Fuel Types (Hydrogen, Biogas)
- 5.4 By End-User Industry
- 5.4.1 Power
- 5.4.2 Oil and Gas
- 5.4.3 Other End-user Industries (Industrial, Marine)
- 5.5 By Geography
- 5.5.1 North America
- 5.5.1.1 United States
- 5.5.1.2 Canada
- 5.5.1.3 Mexico
- 5.5.2 Europe
- 5.5.2.1 United Kingdom
- 5.5.2.2 Germany
- 5.5.2.3 France
- 5.5.2.4 Italy
- 5.5.2.5 Spain
- 5.5.2.6 Russia
- 5.5.2.7 Rest of Europe
- 5.5.3 Asia-Pacific
- 5.5.3.1 China
- 5.5.3.2 India
- 5.5.3.3 Japan
- 5.5.3.4 South Korea
- 5.5.3.5 ASEAN Countries
- 5.5.3.6 Rest of Asia-Pacific
- 5.5.4 South America
- 5.5.4.1 Brazil
- 5.5.4.2 Argentina
- 5.5.4.3 Chile
- 5.5.4.4 Rest of South America
- 5.5.5 Middle East and Africa
- 5.5.5.1 Saudi Arabia
- 5.5.5.2 United Arab Emirates
- 5.5.5.3 South Africa
- 5.5.5.4 Egypt
- 5.5.5.5 Rest of Middle East and Africa
- 5.5.1 North America
6 Competitive Landscape
- 6.1 Market Concentration
- 6.2 Strategic Moves (M&A, Partnerships, PPAs)
- 6.3 Market Share Analysis (Market Rank/Share for key companies)
- 6.4 Company Profiles (includes Global level Overview, Market level overview, Core Segments, Financials as available, Strategic Information, Products & Services, and Recent Developments)
- 6.4.1 General Electric Company
- 6.4.2 Siemens Energy AG
- 6.4.3 Mitsubishi Heavy Industries Ltd.
- 6.4.4 Kawasaki Heavy Industries Ltd.
- 6.4.5 Ansaldo Energia SpA
- 6.4.6 MAN Energy Solutions SE
- 6.4.7 Wartsila Oyj Abp
- 6.4.8 Rolls-Royce Holdings plc
- 6.4.9 Solar Turbines Incorporated
- 6.4.10 Capstone Green Energy Corporation
- 6.4.11 Doosan Skoda Power
- 6.4.12 IHI Corporation
- 6.4.13 Bharat Heavy Electricals Limited
- 6.4.14 Harbin Electric Co. Ltd.
- 6.4.15 Shanghai Electric Group Co. Ltd.
- 6.4.16 OPRA Turbines BV
- 6.4.17 Baker Hughes Company
- 6.4.18 Vericor Power Systems LLC
- 6.4.19 Zorya-Mashproekt
- 6.4.20 Nanjing Turbine & Electric Machinery Group
7 Market Opportunities & Future Outlook
- 7.1 White-space & Unmet-Need Assessment

