PUBLISHER: Mordor Intelligence | PRODUCT CODE: 2122932

PUBLISHER: Mordor Intelligence | PRODUCT CODE: 2122932
Hydrogen Gas - Market Share Analysis, Industry Trends & Statistics, Growth Forecasts (2026 - 2031)
According to Mordor Intelligence, the hydrogen gas market size was valued at 113.91 Million tons in 2025 and is estimated to grow from 118.07 Million tons in 2026 to reach 141.25 Million tons by 2031, at a CAGR of 3.65% during the forecast period (2026-2031).
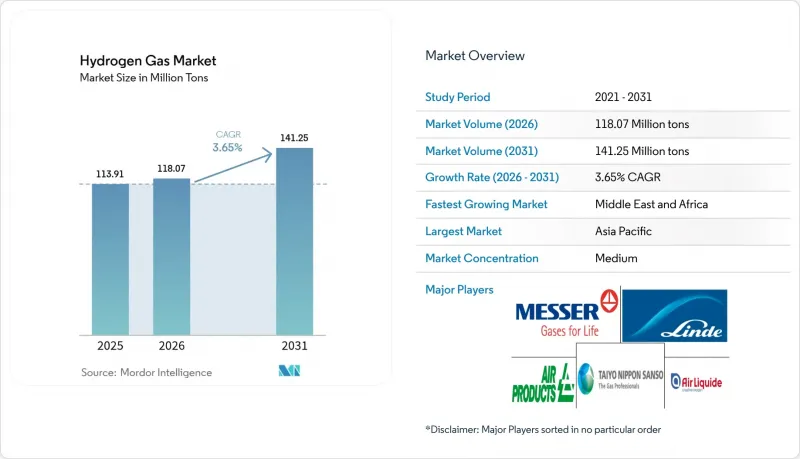
This report is Segmented by Distribution (Pipeline, High-Pressure Tube Trailer, and Cylinder), Application (Ammonia, Methanol, Refining, Direct Reduced Iron (DRI), Fuel-Cell Vehicles (FCVs), and Other Applications), and Geography (Asia Pacific, North America, Europe, South America, and the Middle East and Africa). The Market Sizing and Forecasts are Provided in Terms of Volume (tons).
Global Hydrogen Gas Market Trends and Insights
Refinery Desulfurization Regulations
International Maritime Organization fuel rules and US Tier 3 gasoline standards increase hydrotreater hydrogen demand by 5-8% for each incremental sulfur cut. Gulf Coast, Rotterdam, and Singapore refineries therefore expand on-site steam-methane reformers tied into dedicated pipelines, locking in multi-year merchant contracts. Emerging-market refineries still purchasing tube-trailer gas pay USD 0.50-0.80 more per kg on a delivered basis. ISO 14001 reporting now requires disclosure of hydrogen carbon intensity, which is steering spot purchases toward lower-emission supply. Compliance deadlines through 2026 sustain baseline demand even as electrolyzer retrofits near parity in carbon-priced regions.
Government Incentives for Green H2
Section 45V of the US Inflation Reduction Act offers up to USD 3 per kg for hydrogen below 0.45 kg CO2-eq, stimulating co-located renewable-power electrolyzers. Europe's Hydrogen Bank awarded EUR 720 million of contracts-for-difference in 2024 to narrow the cost gap with grey hydrogen, but auctioned volumes remain a fraction of the 10 Mt annual import target for 2030. Japan, China, and South Korea extend purchase subsidies and feed-in tariffs that underpin multi-megawatt stack orders, driving Chinese alkaline electrolyzer prices under USD 200 per kW according to manufacturer disclosures. These layered incentives bring the hydrogen gas market closer to cost competitiveness in mobility, steel, and fertilizer.
Expensive Storage and Transport Logistics
Compressed storage at 350 bar packs one-tenth the energy density of diesel, so tube-trailer fleets incur delivery premiums above USD 2 per kg on routes exceeding 300 km. Liquefaction consumes 25-35% of hydrogen's lower heating value and needs cryogenic tanks costing about USD 1,000 per kg daily throughput. Liquid-organic carriers cut boil-off losses yet suffer 40% round-trip efficiency losses and costly dehydrogenation catalysts. New hydrogen-grade pipelines run USD 3-5 million per km before right-of-way, limiting deployments in South America and Sub-Saharan Africa, where greenfield projects must bundle production and distribution capex. These costs weigh on near-term economics for the hydrogen gas industry.
Other drivers and restraints analyzed in the detailed report include:
- Rising Fuel-Cell Vehicle Roll-out
- Hydrogen-Gas-Grid Blending Mandates
- Community Opposition to New H2 Pipelines
For complete list of drivers and restraints, kindly check the Table Of Contents.
Segment Analysis
Pipeline networks supplied 58.42% of the hydrogen gas market size in 2025 and are projected to expand at a 4.12% CAGR during the forecast period (2026-2031) as refineries and ammonia plants demand uninterrupted flows. Tube trailers remain essential for 50-500 kg-per-day industrial users lacking spur lines, while cylinder packs shrink in laboratories and telecom backup systems that transition to cartridge formats. Emerging export pipelines reinforce future growth: Saudi Arabia's 1,500-km NEOM line to Aqaba will feed green-ammonia export, and Europe plans to repurpose 11,600 km of gas transmission lines, trimming build costs 60% versus new construction. The Middle East and Africa lead pipeline additions, supporting gigawatt electrolyzers that target delivered costs of USD 1.50-2.00 per kg by 2030.
Tube-trailer economics improve where demand is fragmented; a 300-bar rig carrying 1,000 kg can serve six customers within 200 km, lowering deadhead mileage 20-30% using advanced route optimization. Cylinder packs still appeal to seasonal float-glass and specialty-welding shops, yet five-year hydrostatic tests under ISO 11114 inflate lifetime costs. In the hydrogen gas market, distribution portfolios therefore balance high-volume pipelines with flexible road logistics until regional demand clusters justify new steel.
Complete Report Scope:
- By Distribution
- Pipeline
- High-pressure tube trailer
- Cylinder
- By Application
- Ammonia
- Methanol
- Refining
- Direct Reduced Iron (DRI)
- Fuel-cell Vehicles (FCVs)
- Other Applications
- By Geography
- Asia-Pacific
- China
- India
- Japan
- South Korea
- ASEAN Countries
- Rest of Asia-Pacific
- North America
- United States
- Canada
- Mexico
- Europe
- Germany
- United Kingdom
- France
- Italy
- Russia
- NORDIC Countries
- Rest of Europe
- South America
- Brazil
- Argentina
- Rest of South America
- Middle East and Africa
- Saudi Arabia
- South Africa
- Rest of Middle East and Africa
- Asia-Pacific
Geography Analysis
Asia-Pacific held 34.23% of the 2025 hydrogen gas market, propelled by China's 1,104 refueling stations, Japan's ammonia-import plans, and South Korea's 6.2 Mt 2040 consumption target. China's provincial grants for 10 MW-plus electrolyzers slashed alkaline stack costs below USD 200 per kW, half the European average, positioning Chinese suppliers for export. India's National Hydrogen Mission commits INR 197 billion (USD 2.4 billion) to produce 5 Mt by 2030, focusing on Gujarat and Odisha corridors with sub-INR 2 kWh solar tariffs. ASEAN pilots in Thailand, Singapore, and Malaysia test grid blending and coal-plant ammonia co-firing while awaiting carbon-pricing clarity.
The Middle East and Africa are expected to record the fastest 4.12% CAGR during the forecast period (2026-2031). Projects in Saudi Arabia, UAE, Oman, and Egypt couple 30-40% capacity-factor solar with desalination, reaching projected costs of USD 1.50-2.00 per kg by 2030. The NEOM venture will ship 650 t-per-day hydrogen as ammonia from late 2026, while South Africa's Boegoebaai targets 400,000 t green-ammonia from 2028 despite desalination add-ons of USD 0.30-0.50 per kg.
In North America, the US Department of Energy funded seven regional hubs, each producing 50,000-100,000 t annually for refining, fertilizer, and transport. Canada pursues blue hydrogen with carbon capture in Alberta and green hydrogen via hydropower in Quebec, eyeing EU exports once carbon-border levies finalize. Europe repurposes legacy gas grids; Germany allows 20% blends in select segments, the UK plans a 100% hydrogen village, and France backs a 200 MW Dunkirk electrolyzer supplying ArcelorMittal's DRI pilot. South American ambitions concentrate in Chile's high-wind Magallanes and Brazil's Pecem port, although grid-tie delays push several final decisions into 2026. Collectively, diversified regional pipelines, hub programs, and export projects underpin the hydrogen gas market's global expansion.
- Aditya Birla Chemicals
- Air Liquide
- Air Products and Chemicals, Inc.
- BASF SE
- Equinor ASA
- Gulf Cryo
- Iwatani Corp.
- Kawasaki Heavy Industries, Ltd.
- Linde plc
- MATHESON Tri-Gas, Inc.
- Messer SE & Co. KGaA
- TAIYO NIPPON SANSO CORPORATION
Additional Benefits:
- The market estimate (ME) sheet in Excel format
- 3 months of analyst support
TABLE OF CONTENTS
1 Introduction
- 1.1 Study Assumptions and Market Definition
- 1.2 Scope of the Study
2 Research Methodology
3 Executive Summary
4 Market Landscape
- 4.1 Market Overview
- 4.2 Market Drivers
- 4.2.1 Refinery Desulfurization Regulations
- 4.2.2 Government Incentives for Green H2
- 4.2.3 Rising Fuel-Cell Vehicle Roll-out
- 4.2.4 Hydrogen-Gas-Grid Blending Mandates
- 4.2.5 Surplus-Renewables-Driven Power-to-Gas Economics
- 4.3 Market Restraints
- 4.3.1 Expensive Storage and Transport Logistics
- 4.3.2 Community Opposition to New H2 Pipelines
- 4.3.3 Water-Scarcity Constraints in Arid Regions
- 4.4 Value Chain Analysis
- 4.5 Porter's Five Forces
- 4.5.1 Bargaining Power of Suppliers
- 4.5.2 Bargaining Power of Buyers
- 4.5.3 Threat of New Entrants
- 4.5.4 Threat of Substitutes
- 4.5.5 Competitive Rivalry
5 Market Size and Growth Forecasts (Volume)
- 5.1 By Distribution
- 5.1.1 Pipeline
- 5.1.2 High-pressure tube trailer
- 5.1.3 Cylinder
- 5.2 By Application
- 5.2.1 Ammonia
- 5.2.2 Methanol
- 5.2.3 Refining
- 5.2.4 Direct Reduced Iron (DRI)
- 5.2.5 Fuel-cell Vehicles (FCVs)
- 5.2.6 Other Applications
- 5.3 By Geography
- 5.3.1 Asia-Pacific
- 5.3.1.1 China
- 5.3.1.2 India
- 5.3.1.3 Japan
- 5.3.1.4 South Korea
- 5.3.1.5 ASEAN Countries
- 5.3.1.6 Rest of Asia-Pacific
- 5.3.2 North America
- 5.3.2.1 United States
- 5.3.2.2 Canada
- 5.3.2.3 Mexico
- 5.3.3 Europe
- 5.3.3.1 Germany
- 5.3.3.2 United Kingdom
- 5.3.3.3 France
- 5.3.3.4 Italy
- 5.3.3.5 Russia
- 5.3.3.6 NORDIC Countries
- 5.3.3.7 Rest of Europe
- 5.3.4 South America
- 5.3.4.1 Brazil
- 5.3.4.2 Argentina
- 5.3.4.3 Rest of South America
- 5.3.5 Middle East and Africa
- 5.3.5.1 Saudi Arabia
- 5.3.5.2 South Africa
- 5.3.5.3 Rest of Middle East and Africa
- 5.3.1 Asia-Pacific
6 Competitive Landscape
- 6.1 Market Concentration
- 6.2 Strategic Moves
- 6.3 Market Share(%)/Ranking Analysis
- 6.4 Company Profiles (includes Global Overview, Market Overview, Core Segments, Financials, Strategic Information, Products and Services, Recent Developments)
- 6.4.1 Aditya Birla Chemicals
- 6.4.2 Air Liquide
- 6.4.3 Air Products and Chemicals, Inc.
- 6.4.4 BASF SE
- 6.4.5 Equinor ASA
- 6.4.6 Gulf Cryo
- 6.4.7 Iwatani Corp.
- 6.4.8 Kawasaki Heavy Industries, Ltd.
- 6.4.9 Linde plc
- 6.4.10 MATHESON Tri-Gas, Inc.
- 6.4.11 Messer SE & Co. KGaA
- 6.4.12 TAIYO NIPPON SANSO CORPORATION
7 Market Opportunities and Future Outlook
- 7.1 White-space and Unmet-need Assessment

