PUBLISHER: Mordor Intelligence | PRODUCT CODE: 2123418

PUBLISHER: Mordor Intelligence | PRODUCT CODE: 2123418
United States Automated Material Handling - Market Share Analysis, Industry Trends & Statistics, Growth Forecasts (2026 - 2031)
According to Mordor Intelligence, the United States automated material handling market size is expected to grow from USD 41.81 billion in 2025 to USD 46.27 billion in 2026 and is forecast to reach USD 76.84 billion by 2031 at 10.68% CAGR over 2026-2031.
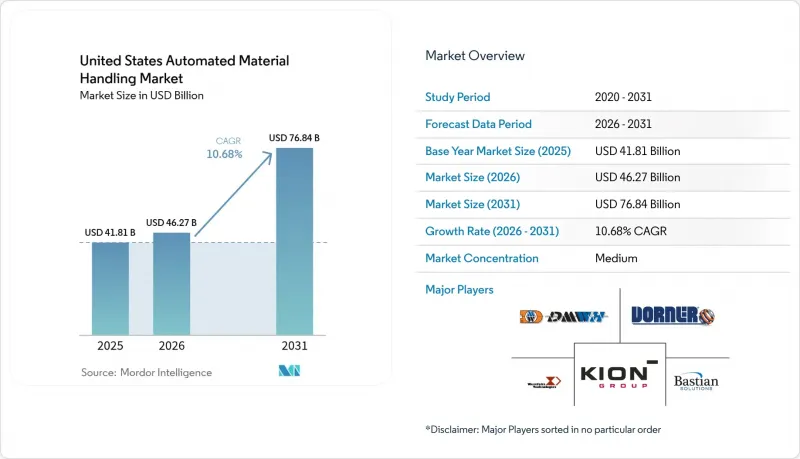
This report is Segmented by Product Type (Hardware, Software, and Services), Equipment Type (AGV, AMR, Laser Guided Vehicle, ASRS, and Sortation System), System Type (Material Transport, Storage, Packaging, and Sorting and Palletizing Systems), End-User Vertical (Airport, Automotive, Food and Beverage, and More). The Market Forecasts are Provided in Terms of Value (USD).
United States Automated Material Handling Market Trends and Insights
Increasing Manufacturing Complexity and Technology Availability
Automotive, aerospace, and electronics plants now juggle tens of thousands of active SKUs, making fixed conveyor layouts obsolete. Flexible automation platforms integrate machine-learning algorithms that re-route totes or pallets in real time, trimming picking errors by 40% while preserving throughput. Digital-twin simulations de-risk capital projects, letting engineers model material-flow scenarios before steel meets concrete; facilities that embrace this approach report 25-35% higher line productivity after go-live. Open software architectures encourage rapid reconfiguration when product lifecycles shrink, safeguarding return on investment as customization proliferates. The result is a virtuous cycle: heightened complexity sparks automation demand, while intelligent systems tame that complexity, allowing manufacturers to scale without proportional labour growth. As component prices fall and integrators package turnkey solutions, even mid-sized plants can deploy advanced robotics once reserved for tier-one OEMs.
Increasing Demand for Improving Order Accuracy and SKU Proliferation
Same-day delivery promises drive fulfilment centers toward 99.9% accuracy, a bar unattainable with manual picking at current wage levels. Vision-guided sorters paired with AI quality checks now process up to 15,000 units per hour and deliver 99.95% precision, slashing returns and boosting margin. Labor savings range from 60-70% because robots operate every shift without overtime premiums. Retailers that automate both picking and pack-out note double-digit jumps in Net Promoter Scores as consumers receive the right goods faster. Furthermore, high accuracy curtails chargebacks from marketplace partners, preserving seller reputations and sustaining growth. The financial logic is compelling: payback periods under two years allow CFOs to green-light multi-site rollouts, embedding automation deep into network strategy.
Gap in Supply-Chain Skills and Workforce Shortage
Deloitte estimates 1.9 million U.S. manufacturing jobs could remain unfilled by 2033, with automation technicians among the scarcest roles. Integrators routinely cite commissioning delays of six to twelve months because local talent pools lack PLC programming and robotics troubleshooting capability. Retirements drain institutional knowledge faster than community-college curricula can replenish it, magnifying the shortfall. Employers respond by launching internal academies and partnering with vocational schools, but these efforts take years to bear fruit. Until the pipeline widens, project timelines will extend, constraining the growth potential of the United States automated material handling market.
Other drivers and restraints analyzed in the detailed report include:
- Emergence of Smart City Logistics and Wide Adoption of Robotics in Warehouse Applications
- Tax Incentives Under Section 179 Accelerated Depreciation for Automation Equipment
- Semiconductor Supply-Chain Volatility Limiting Sensor Availability
For complete list of drivers and restraints, kindly check the Table Of Contents.
Segment Analysis
Hardware maintained 66.35% of the United States automated material handling market share in 2025 because cranes, conveyors, and robots remain the backbone of any automated installation. Software, however, is projected to expand at a 14.74% CAGR as cloud platforms, AI engines, and predictive-maintenance modules become indispensable. The United States automated material handling market size captured by software-centric deals is rising as operators seek unified control towers that telescope across multiple sites.
Warehouse management suites now ingest telemetry from every asset, run machine-learning models to optimize routings, and push updates back to robots in seconds. Facilities that integrate business-intelligence dashboards see 15-25% throughput gains by dialling workflow settings daily. Subscription licenses convert capex to opex, aligning costs with seasonality while ensuring continuous feature updates. Services complete the triad: expert audits, 24-7 remote diagnostics, and phased retrofits preserve uptime and stretch asset lives, reinforcing vendor stickiness in the broader United States automated material handling market.
Automated storage and retrieval systems held a 24.20% revenue share in 2025 because space-constrained DCs require cubic maximization and inventory traceability. Yet autonomous mobile robots headline growth with a 13.08% CAGR, redefining intralogistics flow across greenfield and brownfield sites. AMRs navigate without fixed guide paths, slashing reconfiguration cost when product mixes shift an everyday reality in omnichannel commerce.
Pilot fleets typically start small, but API-first architectures let operators scale to hundreds of units without forklift-heavy redesigns. KION's partnership with Fox Robotics to build autonomous trailer loaders exemplifies a push to automate yard operations, the final frontier in end-to-end flow. Traditional AGVs, laser-guided vehicles, and palletizers remain relevant in heavy or predictable routes, while high-speed sortation maintains a foothold in parcel hubs that prize throughput over flexibility. Overall, the United States automated material handling market continues to favour equipment portfolios that combine fixed precision with mobile agility.
Complete Report Scope:
- By Equipment Type
- Forklifts
- Automated Guided Vehicles (AGVs)
- Conveyor Systems
- Storage and Retrieval Systems
- Cranes and Hoists
- By End-User Industry
- E-commerce and 3PL
- Food and Beverage
- Manufacturing
- Retail (non-e-commerce)
- Pharmaceuticals
- By Capacity Range
- Below 5,000 lbs
- 5,000 - 10,000 lbs
- 10,001 - 20,000 lbs
- Above 20,000 lbs
- By Financing Type
- Operating Lease
- Capital Lease
- Loan / Hire-Purchase
- Sale and Lease-Back
List of Companies Covered in this Report:
- CIT Group Inc.
- Crest Capital LLC
- Element Fleet Management Corp.
- Trust Capital LLC
- DLL Finance LLC
- Pacific Rim Capital Inc.
- CLARK Material Handling Company
- Taylor Leasing and Rental Inc.
- Evolve Bank and Trust
- Toyota Material Handling USA Inc.
- Bank of the West
- HomeTrust Bank
- TCF Bank
- Hanmi Bank
- Bank of America Corp.
- Wells Fargo and Company
Additional Benefits:
- The market estimate (ME) sheet in Excel format
- 3 months of analyst support
TABLE OF CONTENTS
1 INTRODUCTION
- 1.1 Study Assumptions and Market Definition
- 1.2 Scope of the Study
2 RESEARCH METHODOLOGY
3 EXECUTIVE SUMMARY
4 MARKET LANDSCAPE
- 4.1 Market Overview
- 4.2 Market Drivers
- 4.2.1 Rising e-commerce warehouse expansion
- 4.2.2 Growing preference for "as-a-service" models among SMEs
- 4.2.3 Accelerated automation mandates due to labor constraints
- 4.2.4 ESG-linked financing incentives from U.S. banks
- 4.2.5 Secondary market liquidity for used equipment
- 4.2.6 Federal tax advantages under Section 179 deduction
- 4.3 Market Restraints
- 4.3.1 High residual-value uncertainty for AGVs
- 4.3.2 Bank tightening on credit scores post-2024
- 4.3.3 Volatility in benchmark interest rates
- 4.3.4 Cyber-risk premiums embedded in lease contracts
- 4.4 Industry Value-Chain Analysis
- 4.5 Regulatory Landscape
- 4.6 Technological Outlook
- 4.7 Porter's Five Forces Analysis
- 4.7.1 Threat of New Entrants
- 4.7.2 Bargaining Power of Suppliers
- 4.7.3 Bargaining Power of Buyers
- 4.7.4 Threat of Substitutes
- 4.7.5 Competitive Rivalry
5 MARKET SIZE AND GROWTH FORECASTS (VALUE)
- 5.1 By Equipment Type
- 5.1.1 Forklifts
- 5.1.2 Automated Guided Vehicles (AGVs)
- 5.1.3 Conveyor Systems
- 5.1.4 Storage and Retrieval Systems
- 5.1.5 Cranes and Hoists
- 5.2 By End-User Industry
- 5.2.1 E-commerce and 3PL
- 5.2.2 Food and Beverage
- 5.2.3 Manufacturing
- 5.2.4 Retail (non-e-commerce)
- 5.2.5 Pharmaceuticals
- 5.3 By Capacity Range
- 5.3.1 Below 5,000 lbs
- 5.3.2 5,000 - 10,000 lbs
- 5.3.3 10,001 - 20,000 lbs
- 5.3.4 Above 20,000 lbs
- 5.4 By Financing Type
- 5.4.1 Operating Lease
- 5.4.2 Capital Lease
- 5.4.3 Loan / Hire-Purchase
- 5.4.4 Sale and Lease-Back
6 COMPETITIVE LANDSCAPE
- 6.1 Market Concentration
- 6.2 Strategic Moves
- 6.3 Market Share Analysis
- 6.4 Company Profiles (includes Global level Overview, Market level overview, Core Segments, Financials as available, Strategic Information, Market Rank/Share for key companies, Products and Services, and Recent Developments)
- 6.4.1 CIT Group Inc.
- 6.4.2 Crest Capital LLC
- 6.4.3 Element Fleet Management Corp.
- 6.4.4 Trust Capital LLC
- 6.4.5 DLL Finance LLC
- 6.4.6 Pacific Rim Capital Inc.
- 6.4.7 CLARK Material Handling Company
- 6.4.8 Taylor Leasing and Rental Inc.
- 6.4.9 Evolve Bank and Trust
- 6.4.10 Toyota Material Handling USA Inc.
- 6.4.11 Bank of the West
- 6.4.12 HomeTrust Bank
- 6.4.13 TCF Bank
- 6.4.14 Hanmi Bank
- 6.4.15 Bank of America Corp.
- 6.4.16 Wells Fargo and Company
7 MARKET OPPORTUNITIES AND FUTURE OUTLOOK
- 7.1 White-Space and Unmet-Need Assessment

