PUBLISHER: Mordor Intelligence | PRODUCT CODE: 2124847

PUBLISHER: Mordor Intelligence | PRODUCT CODE: 2124847
Indonesia Facility Management - Market Share Analysis, Industry Trends & Statistics, Growth Forecasts (2026 - 2031)
According to Mordor Intelligence, the Indonesia facility management market size is expected to increase from USD 12.86 billion in 2025 to USD 13.59 billion in 2026 and reach USD 17.78 billion by 2031, growing at a CAGR of 5.52% over 2026-2031.
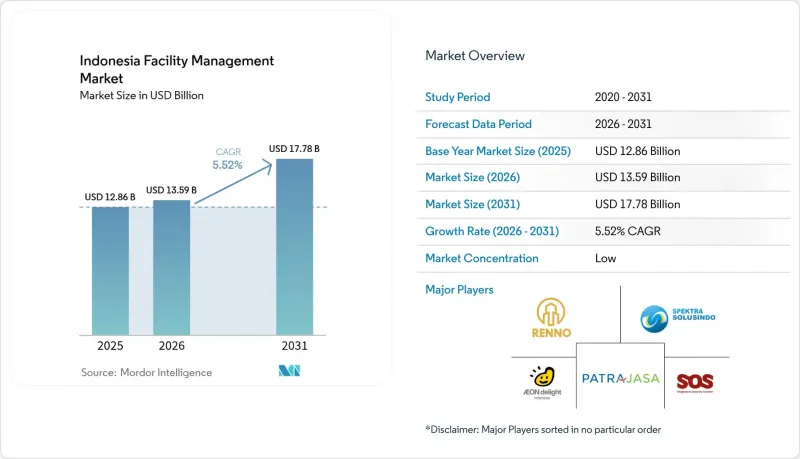
This report is Segmented by Service Type (Hard Services [Asset Management, and More], and Soft Services [Office Support and Security, and More]), Offering Type (In-House, and Outsourced [Single FM, Bundled FM, and More]), and End-User Industry (Commercial. Hospitality, Institutional and Public Infrastructure, Industrial and Process, and More). The Market Forecasts are Provided in Terms of Value (USD).
Indonesia Facility Management Market Trends and Insights
Surge In ESG-Linked Financing Favoring Green-Certified Facilities
Indonesia's commercial banks tied USD 4.8 billion of real-estate loans to EDGE, LEED or GREENSHIP ratings in 2025, lowering borrowing costs by up to 60 basis points. Developers used the savings to fund HVAC retrofits, LED relamping and water-recycling projects that require vendors capable of documenting carbon and energy metrics for quarterly audits. Certified floor space reached 11 million m2 across 385 projects, with 62% located outside Jakarta, demonstrating how secondary-city landlords employ green credentials to court multinational tenants.
Urbanization In Major Metros
Greater Jakarta's density climbed to 15,342 residents per km2 in 2025, accelerating vertical mixed-use towers that stack offices, hotels and residences within a single footprint. Each property depends on integrated facility management to synchronize disparate service-level agreements, driving bundled contracts that replace fragmented vendor rosters. Surabaya's Pakuwon Mall expansion alone added 120,000 m2 of leasable space, supported by a district-cooling plant that trimmed operating costs by 19% relative to standalone chillers.
Margin Pressure on Leading Firms
Average wages for skilled technicians rose 14% in 2025 as automotive and electronics plants absorbed technical labor, compressing operating margins at major vendors to 4.2% from 5.8% a year earlier. Minimum-wage hikes of up to 9% in Jakarta further squeezed profitability, prompting smaller operators to exit low-margin cleaning and security contracts. Integrated providers countered by cross-subsidizing soft services with higher-margin MEP maintenance and energy-management offerings.
Other drivers and restraints analyzed in the detailed report include:
- Infrastructure Pipeline Investment
- Proliferation Of Mixed-Use Mega-Developments In Secondary Cities
- Skilled Labour Shortages
For complete list of drivers and restraints, kindly check the Table Of Contents.
Segment Analysis
Hard services contributed 58.42% of revenue in 2025, reflecting ongoing demand for MEP, HVAC and fire-safety work that must comply with SNI 03-3989 standards. The Indonesia facility management market size for soft services is set to expand faster at 5.87% through 2031 as mixed-use towers outsource cleaning, security and catering. Growth is amplified in Surabaya and Bandung, where recent mega-developments require mechanized cleaning systems and certified security guards.
Asset-management solutions linked to ISO 55000 computerized systems now underpin factories in Cikarang and Karawang, cutting unplanned downtime by 23%. Meanwhile, fire-safety services advanced 6.1% in 2025 after regulators mandated biannual drills for high-rise buildings, creating predictable inspection and training revenue. Robotic scrubbers deployed by one multinational reduced labor hours 34%, demonstrating how technology offsets wage inflation.
Complete Report Scope:
- By Service Type
- Hard Services
- Asset Management
- MEP and HVAC Services
- Fire Systems and Safety
- Other Hard Facility Management Services
- Soft Services
- Office Support and Security
- Cleaning Services
- Catering Services
- Other Soft Facility Management Services
- Hard Services
- By Offering Type
- In-house
- Outsourced
- Single Facility Management
- Bundled Facility Management
- Integrated Facility Management
- By End-User Industry
- Commercial
- Hospitality
- Institutional and Public Infrastructure
- Healthcare
- Industrial and Process
- Other End-User Industries
List of Companies Covered in this Report:
- PT SGS Indonesia (Societe Generale de Surveillance SA)
- OCS Group Holdings Ltd
- PT Shield On Service Tbk (SOS)
- Sodexo Group
- ISS A/S
- PT Patra Jasa
- PT Spektra Solusindo
- Titan Facility Services
- Astra Property Services
- Angkasa Pura Supports
- Colliers
- Renno Indonesia
- AEON Delight Indonesia
- IndoService
- Atalian Global Services
- Cushman & Wakefield Indonesia
- CBRE Indonesia
- Jones Lang LaSalle Indonesia
- PT Adhi Persada Gedung (APG FM)
- PT Ciriajasa Etsa
Additional Benefits:
- The market estimate (ME) sheet in Excel format
- 3 months of analyst support
TABLE OF CONTENTS
1 INTRODUCTION
- 1.1 Study Assumptions and Market Definition
- 1.2 Scope of the Study
2 RESEARCH METHODOLOGY
3 EXECUTIVE SUMMARY
4 MARKET LANDSCAPE
- 4.1 Market Overview
- 4.1.1 Current Occupancy Rates
- 4.1.2 Profitability Rates of Major FM Players
- 4.1.3 Workforce Indicators - Labor Participation
- 4.1.4 Facility Management Market Share (%), by Service Type
- 4.1.5 Facility Management Market Share (%), by Hard Services
- 4.1.6 Facility Management Market Share (%), by Soft Services
- 4.1.7 Urbanization and Population Growth in Major Metros
- 4.1.8 Sector Investment Priorities in Indonesia's Infrastructure Pipeline
- 4.1.9 Regulatory Drivers Specific to Labor and Safety Standards
- 4.2 Market Drivers
- 4.2.1 Urbanization in Major Metros
- 4.2.2 Rising Occupancy Optimization
- 4.2.3 Infrastructure Pipeline Investment
- 4.2.4 Labor and Safety Regulation
- 4.2.5 Surge in ESG-Linked Financing Favoring Green-Certified Facilities
- 4.2.6 Proliferation of Mixed-Use Mega-Developments in Secondary Cities
- 4.3 Market Restraints
- 4.3.1 Margin Pressure on Leading Firms
- 4.3.2 Skilled Labor Shortages
- 4.3.3 Dependency on Imported Building Automation Hardware
- 4.3.4 Fragmented Provincial Regulatory Oversight
- 4.4 Industry Value Chain Analysis
- 4.5 PESTEL Analysis
- 4.6 Regulatory and Legislative Framework for Market Entrants
- 4.7 Impact of Macroeconomic Factors on the Market
- 4.8 Porter's Five Forces Analysis
- 4.8.1 Bargaining Power of Suppliers
- 4.8.2 Bargaining Power of Buyers
- 4.8.3 Threat of New Entrants
- 4.8.4 Threat of Substitute Services
- 4.8.5 Intensity of Competitive Rivalry
- 4.9 Investment and Funding Analysis
5 MARKET SIZE AND GROWTH FORECASTS (VALUE)
- 5.1 By Service Type
- 5.1.1 Hard Services
- 5.1.1.1 Asset Management
- 5.1.1.2 MEP and HVAC Services
- 5.1.1.3 Fire Systems and Safety
- 5.1.1.4 Other Hard Facility Management Services
- 5.1.2 Soft Services
- 5.1.2.1 Office Support and Security
- 5.1.2.2 Cleaning Services
- 5.1.2.3 Catering Services
- 5.1.2.4 Other Soft Facility Management Services
- 5.1.1 Hard Services
- 5.2 By Offering Type
- 5.2.1 In-house
- 5.2.2 Outsourced
- 5.2.2.1 Single Facility Management
- 5.2.2.2 Bundled Facility Management
- 5.2.2.3 Integrated Facility Management
- 5.3 By End-User Industry
- 5.3.1 Commercial
- 5.3.2 Hospitality
- 5.3.3 Institutional and Public Infrastructure
- 5.3.4 Healthcare
- 5.3.5 Industrial and Process
- 5.3.6 Other End-User Industries
6 COMPETITIVE LANDSCAPE
- 6.1 Market Concentration
- 6.2 Strategic Moves and Partnerships
- 6.3 Market Share Analysis
- 6.4 Company Profiles (includes Global Level Overview, Market Level Overview, Core Segments, Financials as available, Strategic Information, Market Rank/Share, Products and Services, Recent Developments)
- 6.4.1 PT SGS Indonesia (Societe Generale de Surveillance SA)
- 6.4.2 OCS Group Holdings Ltd
- 6.4.3 PT Shield On Service Tbk (SOS)
- 6.4.4 Sodexo Group
- 6.4.5 ISS A/S
- 6.4.6 PT Patra Jasa
- 6.4.7 PT Spektra Solusindo
- 6.4.8 Titan Facility Services
- 6.4.9 Astra Property Services
- 6.4.10 Angkasa Pura Supports
- 6.4.11 Colliers
- 6.4.12 Renno Indonesia
- 6.4.13 AEON Delight Indonesia
- 6.4.14 IndoService
- 6.4.15 Atalian Global Services
- 6.4.16 Cushman & Wakefield Indonesia
- 6.4.17 CBRE Indonesia
- 6.4.18 Jones Lang LaSalle Indonesia
- 6.4.19 PT Adhi Persada Gedung (APG FM)
- 6.4.20 PT Ciriajasa Etsa
7 MARKET OPPORTUNITIES AND FUTURE OUTLOOK
- 7.1 White-space and Unmet-Need Assessment
- 7.2 Technology-Led Integrated FM (IoT, BMS, AI-Based Predictive Maintenance)
- 7.3 ESG-Compliant FM Solutions Demand
- 7.4 Future Service-Model Shifts (Outcome-Based Contracts)

