PUBLISHER: Mordor Intelligence | PRODUCT CODE: 2125289

PUBLISHER: Mordor Intelligence | PRODUCT CODE: 2125289
Alternating Current (AC) Electric Drives - Market Share Analysis, Industry Trends & Statistics, Growth Forecasts (2026 - 2031)
According to Mordor Intelligence, the AC electric drives market size was valued at USD 16.19 billion in 2025 and estimated to grow from USD 17.12 billion in 2026 to reach USD 22.6 billion by 2031, at a CAGR of 5.72% during the forecast period (2026-2031).
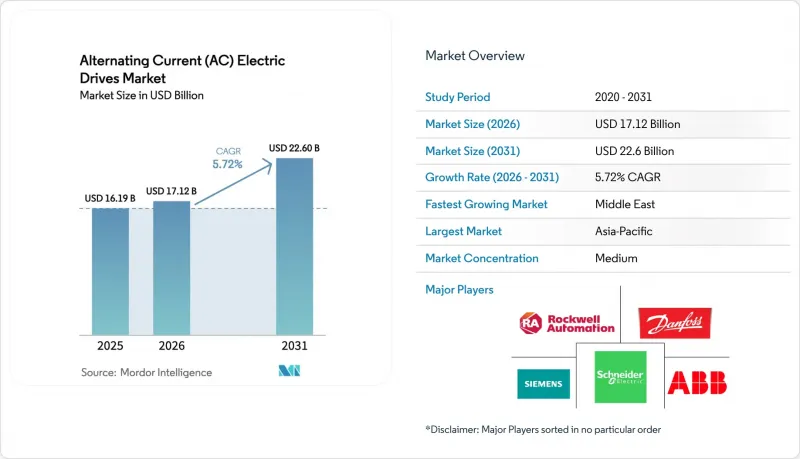
This report is Segmented by Voltage (Low Voltage, and Medium Voltage and Others), Power Rating (Up To 1 MW, 1 MW - 3 MW, Above 3 MW), Application (Pumps, Fans, Compressors, and More), End User Industry (Oil and Gas, Chemical and Petrochemical, Food and Beverage, Water and Wastewater, and More), and Geography. The Market Forecasts are Provided in Terms of Value (USD).
Global Alternating Current (AC) Electric Drives Market Trends and Insights
Increasing Automation in Manufacturing Industries
Smart-factory investments accelerate the adoption of AC electric drives in the market because executives view energy-efficiency gains as decisive cost levers. ABB released the ACS8080 medium-voltage platform in November 2024, which runs at 98% efficiency while cutting harmonic distortion by 50%. Variable-speed retrofits on fans alone reduce electricity use by up to 30%, freeing up the budget for further automation upgrades. Real-time data transmitted from drives to plant historians supports predictive quality control and reduces unplanned downtime. Governments in China, India, and Indonesia incentivize robotics through tax credits, thereby broadening the addressable installed base for intelligent drives.
Rising Government Regulations and Demand for Efficient Devices
Minimum-energy-performance standards now govern roughly two-thirds of global motor shipments. The European Union's Eco-design Directive and the United States Department of Energy's rules require factories to demonstrate quantifiable savings, making AC electric drives' market penetration virtually mandatory in new build lines. The share of electric power in final energy consumption is projected to rise from 29% in 2022 to 52% by 2050, intensifying scrutiny of every motor-driven system. Utilities also reward demand-response participation, allowing facilities equipped with variable-speed drives to monetize flexible load capacity.
High Initial Installation and Maintenance Costs
Total installed cost includes engineering, harmonic-filter banks, cooling upgrades, and operator training, sometimes reaching 2-3X the drive list price. Smaller firms defer projects when payback exceeds two fiscal years. In retrofit scenarios, rewiring panels and verifying power-quality compliance further inflate budgets. Service teams must periodically replace DC-link capacitors and fan assemblies, creating unfamiliar lifecycle obligations for maintenance departments accustomed to simple starters.
Other drivers and restraints analyzed in the detailed report include:
- Rapid Expansion of HVAC Installations in Commercial Buildings
- Declining Cost per Kilowatt of High-Power IGBT Modules
- Shortage of Skilled Technicians for Drive Programming and Tuning
For complete list of drivers and restraints, kindly check the Table Of Contents.
Segment Analysis
Low-voltage units captured the lion's share of 57.74% in 2025 because most industrial motors draw less than 690 V. However, project developers are consolidating loads, preferring one 4 MW motor over four 1 MW units to simplify maintenance. The AC electric drives market now observes medium-voltage quotations rising at a 7.52% CAGR through 2031, as petrochemical, desalination, and mining projects double down on multi-megawatt pumps. The ACS8080 release illustrates how higher power density and lower harmonics make these drives practical for brownfield sites. Regional oil refineries are adopting 6.6 kV VFDs to reduce steam-turbine auxiliary systems, thereby slashing process-heat emissions under net-zero roadmaps.
In the Asia-Pacific region, local panel builders package medium-voltage cabinets with ring-main units to meet turnkey EPC bids. European players differentiate through integral active-front-end converters that meet stringent grid-code flicker limits. Meanwhile, North American utilities are approving regenerative drive configurations that return braking energy to the network, thereby monetizing power quality improvements. These dynamics indicate an inflection point where medium-voltage penetration may displace low-voltage incumbents in power-hungry verticals by the decade's close.
Systems up to 1 MW still account for 47.10% of 2025 shipments, as OEMs in the food, beverage, and discrete manufacturing sectors typically specify standardized frames for conveyors and mixers. Yet, the AC electric drives market sees above-3 MW installations growing fastest at a 7.26% CAGR, as hydrogen electrolyzer plants, floating LNG vessels, and large-scale carbon-capture units demand precise control of giant compressors. Modern SiC inverters now exceed 7 kHz switching frequency at these ratings without requiring oversized air conditioning, allowing for indoor placement and reduced environmental sealing costs.
Original equipment manufacturers bundle 5 MW drives with active-magnetic-bearing compressors, eliminating lube-oil circuits and boosting plant uptime. In metals and mining, replacing hydraulic couplings with high-power variable-speed drives reduces mechanical stress during mill start-up, thereby extending gearbox life. Service providers capitalize on the ongoing digital transformation by offering cloud-delivered harmonic audits and software patches, making large-scale ownership less daunting for operators previously deterred by complexity.
Complete Report Scope:
- By Voltage
- Low Voltage
- Medium Voltage and Others
- By Power Rating
- Up to 1 MW
- 1 MW - 3 MW
- Above 3 MW
- By Application
- Pumps
- Fans
- Compressors
- Conveyors
- Extruders
- Other Application
- By End User Industry
- Oil and Gas
- Chemical and Petrochemical
- Food and Beverage
- Water and Wastewater
- Power Generation
- Metals and Mining
- Pulp and Paper
- HVAC
- Discrete Industries
- Other End User Industry
- By Geography
- North America
- United States
- Canada
- Mexico
- Europe
- Germany
- United Kingdom
- France
- Russia
- Rest of Europe
- Asia-Pacific
- China
- Japan
- India
- South Korea
- Australia
- Rest of Asia-Pacific
- Middle East and Africa
- Middle East
- Saudi Arabia
- United Arab Emirates
- Rest of Middle East
- Africa
- South Africa
- Egypt
- Rest of Africa
- Middle East
- South America
- Brazil
- Argentina
- Rest of South America
- North America
Geography Analysis
The Asia-Pacific region captured 35.29% of the revenue in 2025, reflecting cross-sector industrialization and supportive government robotics schemes. China's dominance spans both production and consumption, with local brands cultivating mass-market offerings that shorten lead times. India's Production Linked Incentive scheme expands demand in cement, steel, and automotive verticals, while Japan champions power-device miniaturization, exporting technology modules to global OEMs.
North America and Europe remain mature yet dynamic. The U.S. Inflation Reduction Act offers tax credits that enhance internal rates of return for energy efficiency retrofits, solidifying the AC electric drives market as a key enabler of decarbonization pathways. European utilities implement dynamic grid-support tariffs that reward facilities that throttle motor loads in response to renewable energy intermittency. Consequently, buyers favor drives with regenerative and low-harmonic capabilities.
The Middle East is on a 6.62% CAGR trajectory, energized by mega-projects such as Saudi Arabia's NEOM and United Arab Emirates desalination complexes. Integrated petrochemical hubs specify multi-megawatt drives for ethylene crackers and seawater intake pumps. African and South American markets are gaining momentum through mining expansion and water infrastructure investments; however, adoption is tempered by financing constraints and limited after-sales service networks.
- ABB Ltd
- Siemens AG
- Schneider Electric SE
- Danfoss A/S
- Rockwell Automation Inc.
- WEG S.A.
- Yaskawa Electric Corporation
- Toshiba International Corporation
- Parker Hannifin Corporation
- Fuji Electric Co., Ltd.
- Mitsubishi Electric Corporation
- Hitachi, Ltd.
- Emerson Electric Co.
- Nidec Corporation
- Invertek Drives Ltd.
- Eaton Corporation plc
- Bonfiglioli Riduttori S.p.A.
- SEW-EURODRIVE GmbH and Co KG
- Lenze SE
- Nord Drivesystems Group
Additional Benefits:
- The market estimate (ME) sheet in Excel format
- 3 months of analyst support
TABLE OF CONTENTS
1 INTRODUCTION
- 1.1 Study Assumptions and Market Definition
- 1.2 Scope of the Study
2 RESEARCH METHODOLOGY
3 EXECUTIVE SUMMARY
4 MARKET LANDSCAPE
- 4.1 Market Overview
- 4.2 Market Drivers
- 4.2.1 Increasing Automation in Manufacturing Industries
- 4.2.2 Rising Government Regulations and Demand for Energy Efficient Devices
- 4.2.3 Rapid Expansion of HVAC Installations in Commercial Buildings
- 4.2.4 Declining Cost per Kilowatt of High-Power IGBT Modules
- 4.2.5 Surge in Variable Frequency Drive Retrofits in Aging Industrial Plants
- 4.2.6 Integration of AC Drives with IIoT Platforms for Predictive Maintenance
- 4.3 Market Restraints
- 4.3.1 High Initial Installation and Maintenance Costs
- 4.3.2 Harmonics and Power Quality Concerns Limiting Adoption
- 4.3.3 Shortage of Skilled Technicians for Drive Programming and Tuning
- 4.3.4 Supply Chain Volatility in Semiconductor Components Affecting Lead Times
- 4.4 Industry Value Chain Analysis
- 4.5 Regulatory Landscape
- 4.6 Technological Outlook
- 4.7 Impact of Macroeconomic Factors
- 4.8 Porter's Five Forces Analysis
- 4.8.1 Bargaining Power of Suppliers
- 4.8.2 Bargaining Power of Buyers/Consumers
- 4.8.3 Threat of New Entrants
- 4.8.4 Threat of Substitutes
- 4.8.5 Intensity of Competitive Rivalry
5 MARKET SIZE AND GROWTH FORECASTS (VALUE)
- 5.1 By Voltage
- 5.1.1 Low Voltage
- 5.1.2 Medium Voltage and Others
- 5.2 By Power Rating
- 5.2.1 Up to 1 MW
- 5.2.2 1 MW - 3 MW
- 5.2.3 Above 3 MW
- 5.3 By Application
- 5.3.1 Pumps
- 5.3.2 Fans
- 5.3.3 Compressors
- 5.3.4 Conveyors
- 5.3.5 Extruders
- 5.3.6 Other Application
- 5.4 By End User Industry
- 5.4.1 Oil and Gas
- 5.4.2 Chemical and Petrochemical
- 5.4.3 Food and Beverage
- 5.4.4 Water and Wastewater
- 5.4.5 Power Generation
- 5.4.6 Metals and Mining
- 5.4.7 Pulp and Paper
- 5.4.8 HVAC
- 5.4.9 Discrete Industries
- 5.4.10 Other End User Industry
- 5.5 By Geography
- 5.5.1 North America
- 5.5.1.1 United States
- 5.5.1.2 Canada
- 5.5.1.3 Mexico
- 5.5.2 Europe
- 5.5.2.1 Germany
- 5.5.2.2 United Kingdom
- 5.5.2.3 France
- 5.5.2.4 Russia
- 5.5.2.5 Rest of Europe
- 5.5.3 Asia-Pacific
- 5.5.3.1 China
- 5.5.3.2 Japan
- 5.5.3.3 India
- 5.5.3.4 South Korea
- 5.5.3.5 Australia
- 5.5.3.6 Rest of Asia-Pacific
- 5.5.4 Middle East and Africa
- 5.5.4.1 Middle East
- 5.5.4.1.1 Saudi Arabia
- 5.5.4.1.2 United Arab Emirates
- 5.5.4.1.3 Rest of Middle East
- 5.5.4.2 Africa
- 5.5.4.2.1 South Africa
- 5.5.4.2.2 Egypt
- 5.5.4.2.3 Rest of Africa
- 5.5.4.1 Middle East
- 5.5.5 South America
- 5.5.5.1 Brazil
- 5.5.5.2 Argentina
- 5.5.5.3 Rest of South America
- 5.5.1 North America
6 COMPETITIVE LANDSCAPE
- 6.1 Market Concentration
- 6.2 Strategic Moves
- 6.3 Market Share Analysis
- 6.4 Company Profiles (includes Global level Overview, Market level overview, Core Segments, Financials as available, Strategic Information, Market Rank/Share for key companies, Products and Services, and Recent Developments)
- 6.4.1 ABB Ltd
- 6.4.2 Siemens AG
- 6.4.3 Schneider Electric SE
- 6.4.4 Danfoss A/S
- 6.4.5 Rockwell Automation Inc.
- 6.4.6 WEG S.A.
- 6.4.7 Yaskawa Electric Corporation
- 6.4.8 Toshiba International Corporation
- 6.4.9 Parker Hannifin Corporation
- 6.4.10 Fuji Electric Co., Ltd.
- 6.4.11 Mitsubishi Electric Corporation
- 6.4.12 Hitachi, Ltd.
- 6.4.13 Emerson Electric Co.
- 6.4.14 Nidec Corporation
- 6.4.15 Invertek Drives Ltd.
- 6.4.16 Eaton Corporation plc
- 6.4.17 Bonfiglioli Riduttori S.p.A.
- 6.4.18 SEW-EURODRIVE GmbH and Co KG
- 6.4.19 Lenze SE
- 6.4.20 Nord Drivesystems Group
7 MARKET OPPORTUNITIES AND FUTURE OUTLOOK
- 7.1 White-Space and Unmet-Need Assessment

