PUBLISHER: Mordor Intelligence | PRODUCT CODE: 2125365

PUBLISHER: Mordor Intelligence | PRODUCT CODE: 2125365
Asia-Pacific Programmatic Advertising - Market Share Analysis, Industry Trends & Statistics, Growth Forecasts (2026 - 2031)
According to Mordor Intelligence, the Asia-Pacific programmatic advertising market size is expected to grow from USD 210.22 billion in 2025 to USD 258.17 billion in 2026 and is forecast to reach USD 720.31 billion by 2031 at 22.8% CAGR over 2026-2031.
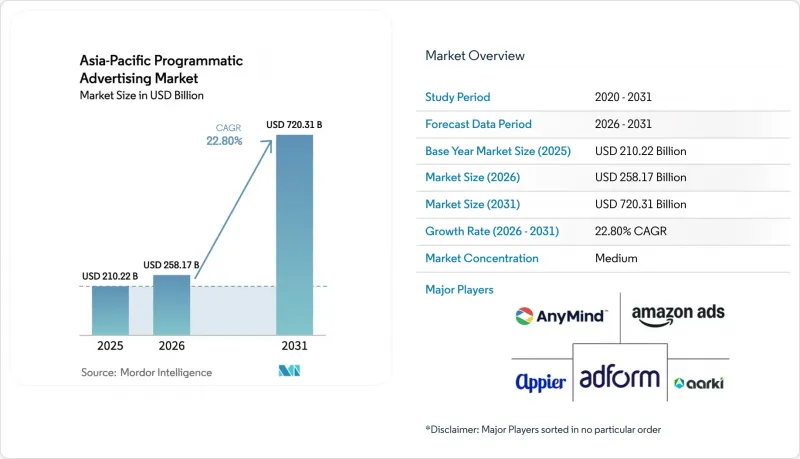
This report is Segmented by Trading Platform (Real-Time Bidding, Private Marketplace Guaranteed, and More), Advertising Media (Digital Display, Mobile Display, and More), Enterprise Size (Small and Mid-Sized Enterprises and Large Enterprises), Industry Vertical (E-Commerce and Retail, BFSI, and More), and Country. The Market Forecasts are Provided in Terms of Value (USD).
Asia-Pacific Programmatic Advertising Market Trends and Insights
Rapid shift of ad budgets to digital channels
Digital media captured a larger share of advertising spend across Asia-Pacific in 2025 as brands pursued measurable, audience-level outcomes that traditional media struggled to deliver. Programmatic platforms benefited as marketers adopted attribution tools that optimize cross-channel journeys in real time. Markets with historically limited linear TV reach, such as Indonesia and Vietnam, leapfrogged directly into mobile-led programmatic models. Regulators reinforced the shift by mandating transparency and data-access standards that favor automated trading. As a result, programmatic now attracts even brand-building budgets that once defaulted to television, widening the addressable pool of spend.
Mobile-first ecosystem fuels in-app inventory
Mobile devices generate more impressions than desktops across every major APAC market, making in-app ad space the prime real estate for the Asia-Pacific programmatic advertising market. Higher engagement rates and richer behavioral data raise bid density and effective CPMs. Partnerships such as AnyMind Group with InMobi yielded 4.3X year-over-year revenue gains for publishers by automating mediation across demand sources. Advertisers are layering geo-location and app-usage signals to serve real-time offers near stores, while publishers roll out rewarded video and playable formats that drive completion rates above 90%. The depth of mobile data also supports privacy-compliant look-alike modeling that compensates for cookie deprecation on browsers.
Fragmented privacy regulations add compliance cost
Divergent data-protection laws force platforms to maintain market-specific consent flows, data shores, and reporting templates, inflating overheads and delaying campaign launches. Larger vendors absorb the burden through dedicated legal teams, while smaller players risk fines or exit less-profitable markets. Cross-border campaigns must often partition user data, reducing scale advantages. Advertisers, wary of penalties, favor partners with audited compliance credentials, concentrating spend and potentially limiting innovation from startups.
Other drivers and restraints analyzed in the detailed report include:
- AI and machine learning transform optimization
- Government 5G roll-outs create premium inventory
- Talent shortage outside top metros hampers scaling
For complete list of drivers and restraints, kindly check the Table Of Contents.
Segment Analysis
Real-Time Bidding represents the largest slice of the Asia-Pacific programmatic advertising market at 46.45% revenue share in 2025, reflecting its flexibility and dynamic pricing benefits. The segment's scale stems from open exchange liquidity and sophisticated bid-shading tools that minimize overpayment. However, inventory quality concerns and brand-safety requirements have led premium advertisers to commit budgets through Automated Guaranteed, which is growing at a 24.06% CAGR. The Asia-Pacific programmatic advertising market share for Automated Guaranteed is rising as publishers package high-visibility placements with fixed rates, ensuring predictable delivery during peak events. Private Marketplace Guaranteed straddles both models, letting buyers access curated impressions with preferential terms, while Unreserved Fixed-Rate remains a niche option for campaigns prioritizing rate stability over reach.
Hybrid buying strategies are emerging: brands start with a guaranteed block to secure prime slots, then chase incremental reach via RTB as frequency caps are met. Platform integrations, such as X deploying Magnite to monetize remnant social inventory, illustrate how publishers blend direct and auction channels to maximize yield. The outcome is a trading landscape where buyers flex between certainty and efficiency, broadening revenue streams across platform types.
Mobile Display holds 49.10% of the Asia-Pacific programmatic advertising market size due to smartphone ubiquity and superior engagement metrics. Deep in-app data and first-party identifiers reinforce mobile's targeting edge, while rewarded and playable ads drive performance for gaming and commerce apps. Connected TV/OTT, though smaller today, is scaling at a 24.5% CAGR as viewers migrate from linear TV to streaming. Programmatic pipes now plug into local broadcasters and over-the-top services, letting brands execute audience buys across large-screen environments once reserved for upfront deals. Digital Display on desktop maintains pockets of influence in office-centric segments, whereas pDOOH is reinventing outdoor with dynamic scheduling tied to audience movement patterns.
Samsung's healthcare pDOOH campaign with Hivestack synchronized mobile retargeting, showcasing omnichannel storytelling that boosts recall and lifts foot traffic. As broadband penetration widens, CTV ad loads rise, and household co-viewing provides incremental reach. Advertisers, therefore, allocate budgets across screens, reinforcing omnichannel measurement tools that stitch exposures into unified frequency caps.
Complete Report Scope:
- By Trading Platform
- Real-Time Bidding (RTB)
- Private Marketplace Guaranteed
- Automated Guaranteed
- Unreserved Fixed-Rate
- By Advertising Media
- Digital Display (Web)
- Mobile Display (In-App and Web)
- Connected TV/OTT
- Digital Out-of-Home
- By Enterprise Size
- Small and Mid-sized Enterprises (SMEs)
- Large Enterprises
- By Industry Vertical
- E-commerce and Retail
- Media and Entertainment
- BFSI
- Travel and Hospitality
- Automotive
- Other Industry Verticals
- By Country
- China
- Japan
- India
- South Korea
- Australia
- Thailand
- Singapore
- Malaysia
- Rest of Asia-Pacific
List of Companies Covered in this Report:
- Amazon.com LLC (Amazon Advertising)
- Appier Inc.
- Aarki, Inc.
- Adform A/S
- AnyMind Group Pte. Ltd.
- Criteo S.A.
- Digital Turbine, Inc.
- FreakOut Holdings, Inc.
- Google LLC
- Hivestack Inc.
- Index Exchange Inc.
- InMobi Pte. Ltd.
- Integral Ad Science Holding Corp.
- Komli Media India Private Ltd.
- LoopMe Ltd.
- Magnite, Inc.
- MediaMath, Inc.
- Moloco, Inc.
- PubMatic, Inc.
- Smaato, Inc.
- The Trade Desk, Inc.
- Xandr LLC
Additional Benefits:
- The market estimate (ME) sheet in Excel format
- 3 months of analyst support
TABLE OF CONTENTS
1 INTRODUCTION
- 1.1 Study Assumptions and Market Definitions
- 1.2 Scope of the Study
2 RESEARCH METHODOLOGY
3 EXECUTIVE SUMMARY
4 MARKET LANDSCAPE
- 4.1 Market Overview
- 4.2 Industry Stakeholder Analysis
- 4.3 Porter's Five Forces Analysis
- 4.3.1 Bargaining Power of Suppliers
- 4.3.2 Bargaining Power of Buyers/Consumers
- 4.3.3 Threat of New Entrants
- 4.3.4 Threat of Substitute Products
- 4.3.5 Intensity of Competitive Rivalry
- 4.4 Industry Value Chain Analysis
- 4.5 Regulatory Landscape
- 4.6 Technological Outlook
- 4.7 Impact of Macroeconomic Factors
5 MARKET DYNAMICS
- 5.1 Market Drivers
- 5.1.1 Rapid shift of Asia Pacific ad budgets from traditional to digital channels
- 5.1.2 Mobile-first user base fuelling in-app inventory growth
- 5.1.3 Government-led 5G roll-outs expanding high-quality ad slots
- 5.1.4 Rising adoption of AI/ML for real-time campaign optimisation
- 5.1.5 Brand-safety algorithms tailored for Asian languages and cultures
- 5.1.6 Emergence of programmatic digital out-of-home networks in tier-2 Asian cities
- 5.2 Market Restraints
- 5.2.1 Fragmented data-privacy regulations across Asia Pacific markets
- 5.2.2 Shortage of skilled programmatic talent outside top metro areas
- 5.2.3 Browser and OEM-level restrictions on device IDs in China and India
- 5.2.4 Limited premium local inventory for vernacular content in South-East Asia
6 MARKET SIZE AND GROWTH FORECASTS (VALUES)
- 6.1 By Trading Platform
- 6.1.1 Real-Time Bidding (RTB)
- 6.1.2 Private Marketplace Guaranteed
- 6.1.3 Automated Guaranteed
- 6.1.4 Unreserved Fixed-Rate
- 6.2 By Advertising Media
- 6.2.1 Digital Display (Web)
- 6.2.2 Mobile Display (In-App and Web)
- 6.2.3 Connected TV/OTT
- 6.2.4 Digital Out-of-Home
- 6.3 By Enterprise Size
- 6.3.1 Small and Mid-sized Enterprises (SMEs)
- 6.3.2 Large Enterprises
- 6.4 By Industry Vertical
- 6.4.1 E-commerce and Retail
- 6.4.2 Media and Entertainment
- 6.4.3 BFSI
- 6.4.4 Travel and Hospitality
- 6.4.5 Automotive
- 6.4.6 Other Industry Verticals
- 6.5 By Country
- 6.5.1 China
- 6.5.2 Japan
- 6.5.3 India
- 6.5.4 South Korea
- 6.5.5 Australia
- 6.5.6 Thailand
- 6.5.7 Singapore
- 6.5.8 Malaysia
- 6.5.9 Rest of Asia-Pacific
7 COMPETITIVE LANDSCAPE
- 7.1 Market Concentration
- 7.2 Strategic Moves
- 7.3 Market Share Analysis
- 7.4 Company Profiles (includes Global level Overview, Market level overview, Core Segments, Financials as available, Strategic Information, Market Rank/Share for key companies, Products and Services, and Recent Developments)
- 7.4.1 Amazon.com LLC (Amazon Advertising)
- 7.4.2 Appier Inc.
- 7.4.3 Aarki, Inc.
- 7.4.4 Adform A/S
- 7.4.5 AnyMind Group Pte. Ltd.
- 7.4.6 Criteo S.A.
- 7.4.7 Digital Turbine, Inc.
- 7.4.8 FreakOut Holdings, Inc.
- 7.4.9 Google LLC
- 7.4.10 Hivestack Inc.
- 7.4.11 Index Exchange Inc.
- 7.4.12 InMobi Pte. Ltd.
- 7.4.13 Integral Ad Science Holding Corp.
- 7.4.14 Komli Media India Private Ltd.
- 7.4.15 LoopMe Ltd.
- 7.4.16 Magnite, Inc.
- 7.4.17 MediaMath, Inc.
- 7.4.18 Moloco, Inc.
- 7.4.19 PubMatic, Inc.
- 7.4.20 Smaato, Inc.
- 7.4.21 The Trade Desk, Inc.
- 7.4.22 Xandr LLC
8 MARKET OPPORTUNITIES AND FUTURE OUTLOOK
- 8.1 White-space and Unmet-Need Assessment

