PUBLISHER: Mordor Intelligence | PRODUCT CODE: 2125557

PUBLISHER: Mordor Intelligence | PRODUCT CODE: 2125557
United States Disposable Tableware - Market Share Analysis, Industry Trends & Statistics, Growth Forecasts (2026 - 2031)
According to Mordor Intelligence, the United States disposable tableware market size is USD 7.58 billion in 2026 and is projected to reach USD 9.14 billion by 2031, reflecting a 3.82% CAGR over the forecast period.
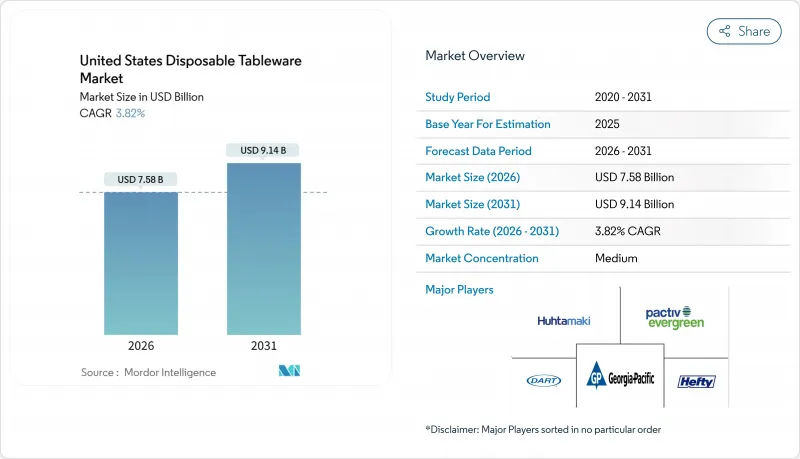
This report is Segmented by Product Type (Plates, Bowls, Cups & Lids, Cutlery, Trays & Containers, Napkins & Others), Material (Plastic, Paper, Bagasse, Bioplastics, Aluminum), End-User (Household, Food-Service (QSR, Restaurants), Catering, Institutional, Others), Distribution (Offline, Online), and Geography (Northeast, Midwest, South, West). The Market Forecasts are in Value (USD).
United States Disposable Tableware Market Trends and Insights
Rising Demand for Convenient Food-Service Solutions from QSRs
Quick-service formats keep the United States disposable tableware market on a stable footing because large networks rely on standardized, transit-ready packaging that moves quickly through drive-thru and delivery channels. Policy actions in major states have discouraged foam and certain single-use items, which pushes operators to align on compliant alternatives across multi-state footprints. This pattern reduces SKU complexity and favours paper, moulded fibre, and certified-compostable solutions in regions with strong enforcement. The combination of regulatory changes and scale purchasing reinforces consistent demand for plates, bowls, cups, lids, cutlery, and containers in the United States disposable tableware market.
Growth of E-commerce Meal-Kit & Food-Delivery Services
Online ordering, direct channels, and aggregator delivery require containers that keep food intact under stacking, transit, and varied hold times. Operators prioritize leak resistance, lid integrity, and tamper-evident packaging for main dishes, sides, and beverages, which leads to a higher use of trays, clamshells, bowls, and portion cups. Brands with multi-state operations select compliant packaging sets to avoid last-minute changes when local rules tighten, especially in the West and Northeast. Infrastructure access influences material picks, since compostable items need reliable collection and industrial processing to deliver intended end-of-life benefits. These conditions keep performance-focused single-use formats central to delivery-led growth in the United States disposable tableware market.
Volatility in Pulp & Paper Input Prices
Fiber supply, energy costs, and logistics conditions drive variability in production costs for paper and moulded-fibre items. Integrated producers with captive pulp or large-scale contracts tend to manage volatility more effectively than smaller converters. Recent investments in Southern and Midwestern capacity indicate structural confidence in fibre-based demand, which supports regional supply depth and shorter lead times. Buyers balance cost variability with multi-year contracts and diversification by substrate to stabilize operations. This environment adds planning complexity and can slow switching decisions within the United States disposable tableware market.
Other drivers and restraints analyzed in the detailed report include:
- Increasing On-the-Go Consumption & Outdoor Events
- Expansion of Biodegradable and Compostable Product Lines
- Emerging Re-Use Subscription Models in Venues
For complete list of drivers and restraints, kindly check the Table Of Contents.
Segment Analysis
Plates accounted for a 34.23% share of the United States disposable tableware market size in 2025, and trays and containers are projected to advance at a 4.94% CAGR through 2031. Delivery-centric models reward stackable footprints and tight lid seals that maintain temperature and texture under transit conditions. Multi-unit operators favour standardized sizes to simplify pick, pack, and order assembly. Beverage programs sustain steady volume for cups and lids across cold and hot occasions. These patterns keep procurement focused on predictable performance and fit across dayparts and menu builds in the United States disposable tableware market.
Delivery-only expansions illustrate the operational shift toward sealed containers, multi-compartment trays, and tamper-evident closures, especially in secondary metros with rising off-premise traffic. Regulatory transitions away from foam in key states encourage national brands to align on compliant containers to avoid sudden changes when rules tighten. These constraints support the relative outperformance of transit-optimized formats versus traditional plate-only setups. As a result, trays, clamshells, bowls, and portion-cup systems gain momentum across ordering channels in the United States disposable tableware market.
Plastic retained 47.92% of the United States disposable tableware market share in 2025, while bioplastics are projected to grow at a 5.13% CAGR through 2031. PFAS restrictions in food-contact packaging are accelerating portfolio updates and barrier innovations that support compliant performance in grease and moisture applications. Vendors are removing PFAS and scaling alternative substrates, including moulded fibre and certified-compostable lines, to serve public-sector bids and large private accounts. Fiber-based capacity investments and egg-carton platform expansions provide supply-side reinforcement for moulded pulp and paperboard formats. This set of changes supports a durable shift toward compliant materials in the United States disposable tableware market.
Producers with integrated networks and regional plants are positioned to navigate feedstock volatility with shorter lead times and stronger quality control. New and expanded facilities in the South and Midwest indicate long-term confidence in fibre-based demand backed by policy tailwinds. As multi-state brands unify specifications, plastics remain in use where allowed, while fibre and compostable options gain traction in restricted jurisdictions. This balanced approach supports compliance while preserving operational continuity. The net effect is gradual mix evolution rather than abrupt displacement in the United States disposable tableware market.
Complete Report Scope:
- By Product Type
- Plates
- Bowls
- Cups & Lids
- Cutlery
- Trays & Containers
- Napkins & Others
- By Material Type
- Plastic
- Paper & Paperboard
- Bagasse / Molded Fiber
- Bioplastics (PLA, PHA)
- Aluminum Foil
- By End-User
- Household
- Food-service-QSR
- Food-service -Full-service Restaurants
- Catering & Banqueting
- Institutional (Schools, Hospitals)
- Others (Airlines, Events)
- By Distribution Channel
- Super/Hypermarkets
- Cash & Carry
- Food-service Distributors
- E-commerce Retail
- Online-Direct-to-Business Portals
- By Region
- Northeast
- Midwest
- South
- West
List of Companies Covered in this Report:
- Dart Container Corporation
- Huhtamaki (Oscar Mayer Chinet)
- Pactiv Evergreen Inc.
- Georgia-Pacific LLC (Dixie)
- Reynolds Consumer Products (Hefty)
- Graphic Packaging International
- Genpak LLC
- Solo Cup Company
- Novolex Holdings (Eco-Products)
- Vegware Ltd
- World Centric
- BioPak
- Lollicup USA Inc.
- Sabert Corporation
- Anchor Packaging
- AJM Packaging Corporation
- D&W Fine Pack
- Fabri-Kal
- Be Green Packaging
- GreenGood USA
Additional Benefits:
- The market estimate (ME) sheet in Excel format
- 3 months of analyst support
TABLE OF CONTENTS
1 Introduction
- 1.1 Study Assumptions & Market Definition
- 1.2 Scope of the Study
2 Research Methodology
3 Executive Summary
4 Market Landscape
- 4.1 Market Overview
- 4.2 Market Drivers
- 4.2.1 Rising demand for convenient food-service solutions from QSRs
- 4.2.2 Growth of e-commerce meal-kit & food-delivery services
- 4.2.3 Increasing on-the-go consumption & outdoor events
- 4.2.4 Expansion of biodegradable/compostable product lines
- 4.2.5 Surge in ghost-kitchen proliferation in Tier-2 cities
- 4.2.6 Corporate zero-waste catering programs
- 4.3 Market Restraints
- 4.3.1 Stringent state-level bans on EPS & single-use plastics
- 4.3.2 Volatility in pulp & paper input prices
- 4.3.3 Emerging re-use subscription models in venues
- 4.3.4 Limited industrial composting infrastructure
- 4.4 Value / Supply-Chain Analysis
- 4.5 Regulatory Landscape
- 4.6 Technological Outlook
- 4.7 Porter's Five Forces Analysis
- 4.7.1 Threat of New Entrants
- 4.7.2 Bargaining Power of Suppliers
- 4.7.3 Bargaining Power of Buyers
- 4.7.4 Threat of Substitutes
- 4.7.5 Competitive Rivalry
5 Market Size & Growth Forecasts (Value)
- 5.1 By Product Type
- 5.1.1 Plates
- 5.1.2 Bowls
- 5.1.3 Cups & Lids
- 5.1.4 Cutlery
- 5.1.5 Trays & Containers
- 5.1.6 Napkins & Others
- 5.2 By Material Type
- 5.2.1 Plastic
- 5.2.2 Paper & Paperboard
- 5.2.3 Bagasse / Molded Fiber
- 5.2.4 Bioplastics (PLA, PHA)
- 5.2.5 Aluminum Foil
- 5.3 By End-User
- 5.3.1 Household
- 5.3.2 Food-service-QSR
- 5.3.3 Food-service -Full-service Restaurants
- 5.3.4 Catering & Banqueting
- 5.3.5 Institutional (Schools, Hospitals)
- 5.3.6 Others (Airlines, Events)
- 5.4 By Distribution Channel
- 5.4.1 Super/Hypermarkets
- 5.4.2 Cash & Carry
- 5.4.3 Food-service Distributors
- 5.4.4 E-commerce Retail
- 5.4.5 Online-Direct-to-Business Portals
- 5.5 By Region
- 5.5.1 Northeast
- 5.5.2 Midwest
- 5.5.3 South
- 5.5.4 West
6 Competitive Landscape
- 6.1 Market Concentration
- 6.2 Strategic Moves
- 6.3 Market Share Analysis
- 6.4 Company Profiles
- 6.4.1 Dart Container Corporation
- 6.4.2 Huhtamaki (Oscar Mayer Chinet)
- 6.4.3 Pactiv Evergreen Inc.
- 6.4.4 Georgia-Pacific LLC (Dixie)
- 6.4.5 Reynolds Consumer Products (Hefty)
- 6.4.6 Graphic Packaging International
- 6.4.7 Genpak LLC
- 6.4.8 Solo Cup Company
- 6.4.9 Novolex Holdings (Eco-Products)
- 6.4.10 Vegware Ltd
- 6.4.11 World Centric
- 6.4.12 BioPak
- 6.4.13 Lollicup USA Inc.
- 6.4.14 Sabert Corporation
- 6.4.15 Anchor Packaging
- 6.4.16 AJM Packaging Corporation
- 6.4.17 D&W Fine Pack
- 6.4.18 Fabri-Kal
- 6.4.19 Be Green Packaging
- 6.4.20 GreenGood USA
7 Market Opportunities & Future Outlook
- 7.1 Opportunities in customized branded disposable tableware solutions for businesses
- 7.2 Innovation in lightweight, durable, microwave-safe disposable tableware designs

