PUBLISHER: Mordor Intelligence | PRODUCT CODE: 2125563

PUBLISHER: Mordor Intelligence | PRODUCT CODE: 2125563
United States Hydrogen Generation - Market Share Analysis, Industry Trends & Statistics, Growth Forecasts (2026 - 2031)
According to Mordor Intelligence, the United States hydrogen generation market size is projected to expand from USD 35.25 billion in 2025 and USD 36.58 billion in 2026 to USD 44.16 billion by 2031, registering a CAGR of 3.84% between 2026 to 2031.
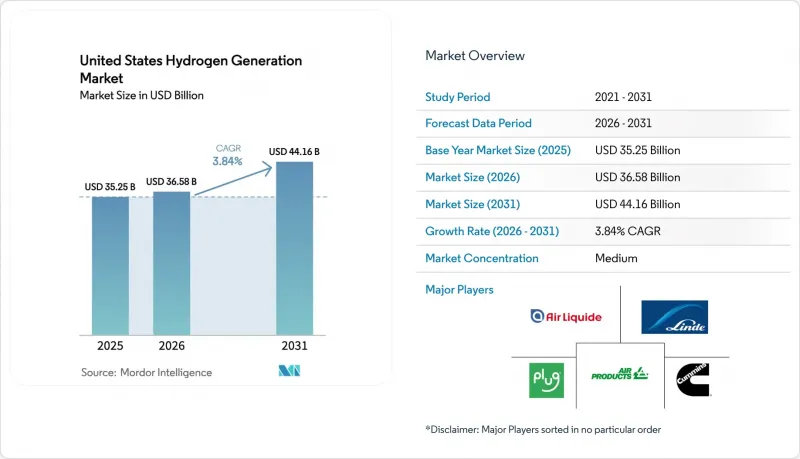
This report is Segmented by Source (Grey Hydrogen, Blue Hydrogen, Green Hydrogen, Turquoise Hydrogen, and Pink Hydrogen), Technology (Steam Methane Reforming, Coal Gasification, Auto-Thermal Reforming, Partial Oxidation, and Electrolysis), and Application (Oil Refining, Chemical Processing, Iron and Steel, Transportation Fuel, Power and Energy Storage, and Residential and Commercial Heating).
United States Hydrogen Generation Market Trends and Insights
Inflation Reduction Act Production Tax Credits
Section 45V, effective January 2025, offers up to USD 3 per kg for hydrogen with lifecycle emissions below 0.45 kg CO2e per kg H2, verified through the GREET model. The credit is transferable for 10 years, cutting the project's weighted-average cost of capital by roughly 150 basis points. To qualify, developers must co-locate electrolyzers with new renewable assets and match electricity hourly, a requirement that raises capital by 20-30% but guarantees the carbon-intensity threshold. The incentive has prompted dozens of gigawatt-scale electrolyzer announcements, yet progress to final investment decision remains selective as developers navigate procurement bottlenecks and long interconnection queues. The credit's certainty is enabling structured power-purchase agreements where off-peak wind and solar are monetized into low-carbon fuel rather than spilled on the grid.
U.S. Decarbonization Mandates Across Hard-to-Abate Sectors
State policies such as California's 2024 Low Carbon Fuel Standard amendment award compliance credits worth USD 1.20-1.50 per kg for green hydrogen in heavy-duty transport. Steelmakers are testing hydrogen injection in blast furnaces to replace up to 30% of coking coal; Cleveland-Cliffs expects its Indiana Harbor pilot to start in 2026 under a USD 150 million retrofit. Similar trials are underway in cement and glass, reinforcing hydrogen's role where electrification is impractical. Federal procurement guidelines finalized in 2026 now favor low-carbon inputs, nudging public-works contractors toward certified hydrogen. Absent a nationwide carbon price, adoption clusters in coastal and Great Lakes states that combine renewable overbuild with explicit carbon-intensity targets.
High LCOH Versus Incumbent Gray Hydrogen
Unabated SMR delivers hydrogen to Gulf Coast buyers at USD 1.00-1.50 per kg, whereas grid-connected electrolysis costs USD 4.00-6.00 per kg prior to incentives. Even with the full USD 3 credit, delivered green hydrogen often sits at USD 1.50-2.50 per kg, a 50-100% premium that most ammonia and refinery offtakers cannot absorb without explicit carbon pricing. Blue hydrogen narrows the gap at USD 2.00-2.50 per kg before credits but requires available sequestration sites and durable CO2 offtake contracts. Declining electrolyzer capex, now USD 800-900 per kW for PEM, will compress the delta, yet parity with grey hydrogen is generally expected closer to 2030, absent further policy support.
Other drivers and restraints analyzed in the detailed report include:
- Rising Refinery & Ammonia Retrofit Demand for Blue Hydrogen
- DOE Hydrogen Hub Funding Unlocking Regional Projects
- Sparse Hydrogen Pipeline & Storage Infrastructure
For complete list of drivers and restraints, kindly check the Table Of Contents.
Segment Analysis
Grey hydrogen controlled 77.5% of 2025 output due to more than 100 aging SMR facilities clustered around Gulf Coast refineries and Midwest ammonia plants. These units, many long since depreciated, deliver product below USD 1 per kg when natural gas remains near USD 3 per MMBtu, maintaining viability absent federal carbon fees. Blue hydrogen capacity is rising as operators bolt carbon capture onto existing reformers; ExxonMobil's Baytown upgrade will sequester 1.3 million t/yr CO2 from 2026, and CF Industries' Donaldsonville scheme targets 2 million t/yr by 2028. Turquoise hydrogen via methane pyrolysis remains niche, Monolith Materials' Nebraska facility produces 14,000 t/yr, but could scale if the solid carbon black by-product wins long-term tire-industry contracts. Pink hydrogen pilots from Exelon and Constellation illustrate nuclear-powered electrolysis potential, yet licensing frameworks for coupling nuclear plants and hydrogen offtake are still evolving.
Green hydrogen occupied only 3-4% of 2025 volumes, yet its 32.9% CAGR positions it to reach 15-20% penetration by 2031. Plug Power's 120 MW hydropower-backed plant in Rochester, online since December 2025, produces 50 t/day at roughly USD 2.50 per kg pre-credit. California's mandate for 100% zero-emission drayage trucks by 2035 underpins a dozen refueling stations planned by Air Liquide and Shell around the Los Angeles basin. Overall, the United States hydrogen generation market size for green pathways could exceed USD 9 billion by 2031 if announced projects reach nameplate capacity, while grey revenues plateau amid tightening disclosure rules.
Complete Report Scope:
- By Source
- Grey Hydrogen
- Blue Hydrogen
- Green Hydrogen
- Turquoise Hydrogen
- Pink Hydrogen
- By Technology
- Steam Methane Reforming (SMR)
- Coal Gasification
- Auto-Thermal Reforming (ATR)
- Partial Oxidation (POX)
- Electrolysis (Alkaline Electrolysis, Proton Exchange Membrane (PEM), Solid Oxide Electrolysis (SOE))
- By Application
- Oil Refining
- Chemical Processing (Ammonia, Methanol)
- Iron and Steel (DRI, H2-BF)
- Transportation Fuel (FCEV, Marine, Aviation)
- Power and Energy Storage
- Residential and Commercial Heating
List of Companies Covered in this Report:
- Air Products and Chemicals Inc.
- Linde plc
- Air Liquide SA
- Plug Power Inc.
- Cummins Inc.
- Engie SA
- FuelCell Energy Inc.
- Messer Group GmbH
- Bloom Energy Corp.
- Nikola Corp.
- Chart Industries Inc.
- Taiyo Nippon Sanso Holdings Corp.
- ITM Power plc
- McPhy Energy SA
- Enapter AG
Additional Benefits:
- The market estimate (ME) sheet in Excel format
- 3 months of analyst support
TABLE OF CONTENTS
1 Introduction
- 1.1 Study Assumptions & Market Definition
- 1.2 Scope of the Study
2 Research Methodology
3 Executive Summary
4 Market Landscape
- 4.1 Market Overview
- 4.2 Market Drivers
- 4.2.1 Inflation Reduction Act (IRA) production tax credits
- 4.2.2 U.S. decarbonization mandates across hard-to-abate sectors
- 4.2.3 Rising refinery & ammonia retrofit demand for blue hydrogen
- 4.2.4 DOE "Hydrogen Hub" funding unlocking regional projects
- 4.2.5 Curtailment-driven offtake for stranded renewable power
- 4.3 Market Restraints
- 4.3.1 High LCOH versus incumbent gray hydrogen
- 4.3.2 Sparse hydrogen pipeline & storage infrastructure
- 4.3.3 Volatile natural-gas input prices for SMR-based producers
- 4.3.4 Water-use permitting risks for utility-scale electrolysis
- 4.4 Supply-Chain Analysis
- 4.5 Regulatory Landscape
- 4.6 Technological Outlook
- 4.7 Porter's Five Forces
- 4.7.1 Threat of New Entrants
- 4.7.2 Bargaining Power of Suppliers
- 4.7.3 Bargaining Power of Buyers
- 4.7.4 Threat of Substitutes
- 4.7.5 Industry Rivalry
- 4.8 PESTLE Analysis
5 Market Size & Growth Forecasts
- 5.1 By Source
- 5.1.1 Grey Hydrogen
- 5.1.2 Blue Hydrogen
- 5.1.3 Green Hydrogen
- 5.1.4 Turquoise Hydrogen
- 5.1.5 Pink Hydrogen
- 5.2 By Technology
- 5.2.1 Steam Methane Reforming (SMR)
- 5.2.2 Coal Gasification
- 5.2.3 Auto-Thermal Reforming (ATR)
- 5.2.4 Partial Oxidation (POX)
- 5.2.5 Electrolysis (Alkaline Electrolysis, Proton Exchange Membrane (PEM), Solid Oxide Electrolysis (SOE))
- 5.3 By Application
- 5.3.1 Oil Refining
- 5.3.2 Chemical Processing (Ammonia, Methanol)
- 5.3.3 Iron and Steel (DRI, H2-BF)
- 5.3.4 Transportation Fuel (FCEV, Marine, Aviation)
- 5.3.5 Power and Energy Storage
- 5.3.6 Residential and Commercial Heating
6 Competitive Landscape
- 6.1 Market Concentration
- 6.2 Strategic Moves (M&A, Partnerships, PPAs)
- 6.3 Market Share Analysis (Market Rank/Share for key companies)
- 6.4 Company Profiles (includes Global level Overview, Market level overview, Core Segments, Financials as available, Strategic Information, Products & Services, and Recent Developments)
- 6.4.1 Air Products and Chemicals Inc.
- 6.4.2 Linde plc
- 6.4.3 Air Liquide SA
- 6.4.4 Plug Power Inc.
- 6.4.5 Cummins Inc.
- 6.4.6 Engie SA
- 6.4.7 FuelCell Energy Inc.
- 6.4.8 Messer Group GmbH
- 6.4.9 Bloom Energy Corp.
- 6.4.10 Nikola Corp.
- 6.4.11 Chart Industries Inc.
- 6.4.12 Taiyo Nippon Sanso Holdings Corp.
- 6.4.13 ITM Power plc
- 6.4.14 McPhy Energy SA
- 6.4.15 Enapter AG
7 Market Opportunities & Future Outlook
- 7.1 White-space & Unmet-need Assessment

