PUBLISHER: Mordor Intelligence | PRODUCT CODE: 2125665

PUBLISHER: Mordor Intelligence | PRODUCT CODE: 2125665
Medium Voltage Switchgear - Market Share Analysis, Industry Trends & Statistics, Growth Forecasts (2026 - 2031)
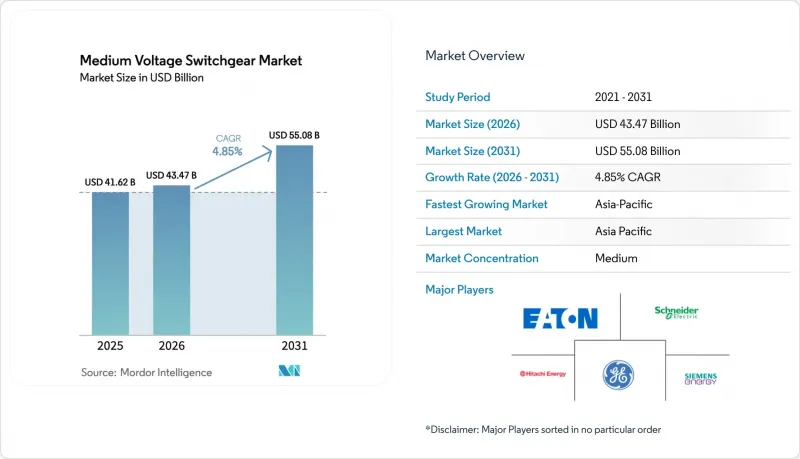
According to Mordor Intelligence, the medium voltage switchgear market size is expected to grow from USD 41.62 billion in 2025 to USD 43.47 billion in 2026 and is forecast to reach USD 55.08 billion by 2031 at 4.85% CAGR over 2026-2031.
This report is Segmented by Insulation (Gas Insulated Switchgear, Air Insulated Switchgear, and Others), Current Type (AC Switchgear and DC Switchgear), Installation (Indoor and Outdoor), End-User (Utilities, Residential, Commercial, and Industrial), and Geography (North America, Europe, Asia-Pacific, South America, and Middle East and Africa).
Global Medium Voltage Switchgear Market Trends and Insights
T&D Infrastructure Investments
Utilities are ramping up capital outlays to replace aging assets and ease capacity bottlenecks. The U.S. spent USD 50.9 billion on distribution assets in 2023, with substation equipment absorbing USD 6.1 billion. Washington followed with USD 10 billion for grid hardening and another USD 12.7 billion across GRIP and transmission facilitation programs in 2024. ASEAN members have earmarked USD 290 billion for cross-border interconnections through 2035. Because each new substation typically installs 4-12 medium-voltage bays, these allocations funnel directly into the medium-voltage switchgear market. Modular factory-built yards are shortening construction schedules by 20-30%, allowing owners to energize capacity sooner and cut overrun risk.
Renewable-Integration Upgrade Cycle
Variable renewables now compel grid operators to handle bidirectional power and quicker fault clearing. India's cumulative renewable base hit 203 GW in 2024, and meeting its 500 GW 2030 target requires INR 5.75 trillion (USD 69 billion) of grid upgrades. China installed 300 GW of new renewables in 2024 and budgeted USD 546 billion for network expansion. IEEE-2800 is pushing for IEC 61850-ready protection schemes, while Europe's 111 GW offshore wind fleet requires marine-rated gear. The International Energy Agency foresees 1,200 GW of variable renewables on grids by 2030, translating into a 40% rise in medium-voltage switchgear at collection points.
SF6 Environmental Restrictions
The EU bans SF6 in <=24 kV gear from January 2026 and in 24-52 kV equipment by 2030. ABB's AirPlus and Siemens Energy's Blue GIS reduce global-warming potential 99% but add 8-12% to cost. Vacuum interrupters, dominant in Japan, remove gas altogether yet top out at 40.5 kV. The United States still relies on voluntary SF6 curbs, letting OEMs ship legacy designs to unregulated regions.
Other drivers and restraints analyzed in the detailed report include:
- Urban Reliability & Micro-Substation Build-Out
- Smart-Grid & Digital Substation Roll-Outs
- High Capex of GIS vs AIS
For complete list of drivers and restraints, kindly check the Table Of Contents.
Segment Analysis
Alternative insulation platforms are expanding at a 10.5% CAGR, far faster than the mature gas-insulated and the cost-oriented air-insulated lines. The European SF6 prohibition for <=24 kV gear from 2026 and for up to 52 kV by 2030 is the primary catalyst. Solid-dielectric and vacuum technologies eliminate gas leakage and double maintenance intervals to every 10 years. Vacuum circuit breakers already command 70% of Japan's medium-voltage market.
Air-insulated gear keeps its cost edge, especially in rural or industrial lots where footprint is secondary. Gas-insulated lines remain the choice for data centers, offshore installations, and dense cities because they occupy up to 40% less floor space. Clean-air GIS, launched by Hitachi Energy in 2024, secured its first 145 kV order in Germany. The premium for SF6-free designs is shrinking as economies of scale build, but capital-tight utilities in developing regions still rely on AIS. Even so, the ongoing substitution means the medium-voltage switchgear market will see rapid share shifts toward clean alternatives over the forecast horizon.
AC equipment retained 86.7% share of the 2025 medium-voltage switchgear market size, reflecting its entrenched role in long-distance transmission. Yet DC switchgear is rising 6.3% annually as hyperscale cloud firms adopt 380 VDC buses to eliminate conversion losses. The U.S. NEVI program's 500,000 fast chargers also require medium-voltage DC interface gear.
Solar-plus-storage developers are coupling PV arrays with batteries on a shared DC bus, improving round-trip efficiency 3-5 percentage points. India's 15 GW of DC-coupled solar-storage illustrates the opportunity. Though DC bays cost 15-20% more than AC, efficiency savings and smaller footprints offset the premium in data centers, EV charging hubs, and renewables. Eaton's 1,500 VDC portfolio with 2-millisecond solid-state interruption lowers a past technical barrier.
Complete Report Scope:
- By Insulation
- Gas Insulated Switchgear (GIS)
- Air Insulated Switchgear (AIS)
- Others
- By Current Type
- AC Switchgear
- DC Switchgear
- By Installation
- Indoor
- Outdoor
- By End-User
- Utilities
- Residential
- Commercial
- Industrial
- By Geography
- North America
- United States
- Canada
- Mexico
- Europe
- Germany
- United Kingdom
- France
- Italy
- Spain
- Russia
- Rest of Europe
- Asia-Pacific
- China
- India
- Japan
- South Korea
- Australia and New Zealand
- Rest of Asia-Pacific
- South America
- Brazil
- Argentina
- Chile
- Rest of South America
- Middle East and Africa
- Saudi Arabia
- United Arab Emirates
- South Africa
- Egypt
- Rest of Middle East and Africa
- North America
Geography Analysis
Asia-Pacific generated 40.3% of 2025 revenue and is forecast to grow at a 6.8% CAGR through 2031. China's USD 546 billion grid plan covers everything from ultra-high-voltage lines to district-level automation. India is channeling INR 5.75 trillion (USD 69 billion) into evacuation corridors for its 500 GW renewable ambition. ASEAN is investing USD 290 billion to stitch together a regional supergrid.
Washington's USD 13 billion modernization package, plus Canada's net-zero-electricity goal by 2035, gives the region strong forward visibility. Data-center clustering in Northern Virginia and the Pacific Northwest adds a concentrated pocket of demand for SF6-free GIS. Europe's roadmap revolves around integrating 300 GW of offshore wind by 2050 and decarbonizing distribution networks per the Green Deal. Germany alone earmarked EUR 20 billion for north-south corridors, while the United Kingdom plans GBP 58 billion in network upgrades.
The Middle East and Africa are smaller but are accelerating. Saudi Arabia's USD 500 billion NEOM project and the UAE's USD 163 billion grid program prioritize compact, digital gear for smart-city campuses. South America benefits from Brazil's 7,000 km transmission expansion and Chile's mining electrification initiatives, while Australia integrates 5 GW of new renewables annually and scales battery storage to balance its high variable-renewable system.
- Hitachi Energy
- Siemens Energy
- Schneider Electric
- Eaton Corp plc
- General Electric
- Mitsubishi Electric
- Toshiba Corp.
- CHINT Group
- Hyosung Heavy Industries
- BHEL
- Powell Industries
- Lucy Group
- Fuji Electric
- Efacec Power Solutions
- CG Power & Industrial Solutions
- NOJA Power
- Ormazabal
- Hyundai Electric
- Meidensha Corp.
- Legrand SA
- Schweitzer Engineering Labs (SEL)
Additional Benefits:
- The market estimate (ME) sheet in Excel format
- 3 months of analyst support
TABLE OF CONTENTS
1 Introduction
- 1.1 Study Assumptions & Market Definition
- 1.2 Scope of the Study
2 Research Methodology
3 Executive Summary
4 Market Landscape
- 4.1 Market Overview
- 4.2 Market Drivers
- 4.2.1 T&D infrastructure investments
- 4.2.2 Renewable-integration upgrade cycle
- 4.2.3 Urban reliability & micro-substation build-out
- 4.2.4 Smart-grid & digital substation roll-outs
- 4.2.5 Data-centre led demand for compact GIS
- 4.2.6 Undergrounding projects in dense cities
- 4.3 Market Restraints
- 4.3.1 SF6 environmental restrictions
- 4.3.2 High capex of GIS v AIS
- 4.3.3 Supply-chain lead-time spikes post-2023
- 4.3.4 Solid-state protection cannibalising MV bays
- 4.4 Supply-Chain Analysis
- 4.5 Regulatory Landscape
- 4.6 Technological Outlook
- 4.7 Porter's Five Forces
- 4.7.1 Bargaining Power of Suppliers
- 4.7.2 Bargaining Power of Consumers
- 4.7.3 Threat of New Entrants
- 4.7.4 Threat of Substitutes
- 4.7.5 Intensity of Competitive Rivalry
5 Market Size & Growth Forecasts
- 5.1 By Insulation
- 5.1.1 Gas Insulated Switchgear (GIS)
- 5.1.2 Air Insulated Switchgear (AIS)
- 5.1.3 Others
- 5.2 By Current Type
- 5.2.1 AC Switchgear
- 5.2.2 DC Switchgear
- 5.3 By Installation
- 5.3.1 Indoor
- 5.3.2 Outdoor
- 5.4 By End-User
- 5.4.1 Utilities
- 5.4.2 Residential
- 5.4.3 Commercial
- 5.4.4 Industrial
- 5.5 By Geography
- 5.5.1 North America
- 5.5.1.1 United States
- 5.5.1.2 Canada
- 5.5.1.3 Mexico
- 5.5.2 Europe
- 5.5.2.1 Germany
- 5.5.2.2 United Kingdom
- 5.5.2.3 France
- 5.5.2.4 Italy
- 5.5.2.5 Spain
- 5.5.2.6 Russia
- 5.5.2.7 Rest of Europe
- 5.5.3 Asia-Pacific
- 5.5.3.1 China
- 5.5.3.2 India
- 5.5.3.3 Japan
- 5.5.3.4 South Korea
- 5.5.3.5 Australia and New Zealand
- 5.5.3.6 Rest of Asia-Pacific
- 5.5.4 South America
- 5.5.4.1 Brazil
- 5.5.4.2 Argentina
- 5.5.4.3 Chile
- 5.5.4.4 Rest of South America
- 5.5.5 Middle East and Africa
- 5.5.5.1 Saudi Arabia
- 5.5.5.2 United Arab Emirates
- 5.5.5.3 South Africa
- 5.5.5.4 Egypt
- 5.5.5.5 Rest of Middle East and Africa
- 5.5.1 North America
6 Competitive Landscape
- 6.1 Market Concentration
- 6.2 Strategic Moves (M&A, Partnerships, PPAs)
- 6.3 Market Share Analysis (Market Rank/Share for key companies)
- 6.4 Company Profiles (includes Global level Overview, Market level overview, Core Segments, Financials as available, Strategic Information, Products & Services, and Recent Developments)
- 6.4.1 Hitachi Energy
- 6.4.2 Siemens Energy
- 6.4.3 Schneider Electric
- 6.4.4 Eaton Corp plc
- 6.4.5 General Electric
- 6.4.6 Mitsubishi Electric
- 6.4.7 Toshiba Corp.
- 6.4.8 CHINT Group
- 6.4.9 Hyosung Heavy Industries
- 6.4.10 BHEL
- 6.4.11 Powell Industries
- 6.4.12 Lucy Group
- 6.4.13 Fuji Electric
- 6.4.14 Efacec Power Solutions
- 6.4.15 CG Power & Industrial Solutions
- 6.4.16 NOJA Power
- 6.4.17 Ormazabal
- 6.4.18 Hyundai Electric
- 6.4.19 Meidensha Corp.
- 6.4.20 Legrand SA
- 6.4.21 Schweitzer Engineering Labs (SEL)
7 Market Opportunities & Future Outlook
- 7.1 White-space & Unmet-Need Assessment

