PUBLISHER: Mordor Intelligence | PRODUCT CODE: 2125726

PUBLISHER: Mordor Intelligence | PRODUCT CODE: 2125726
Ceiling Lights & Chandeliers - Market Share Analysis, Industry Trends & Statistics, Growth Forecasts (2026 - 2031)
According to Mordor Intelligence, the ceiling lights & chandeliers market size was valued at USD 40.05 billion in 2025 and estimated to grow from USD 42.18 billion in 2026 to reach USD 54.69 billion by 2031, at a CAGR of 5.33% during the forecast period (2026-2031).
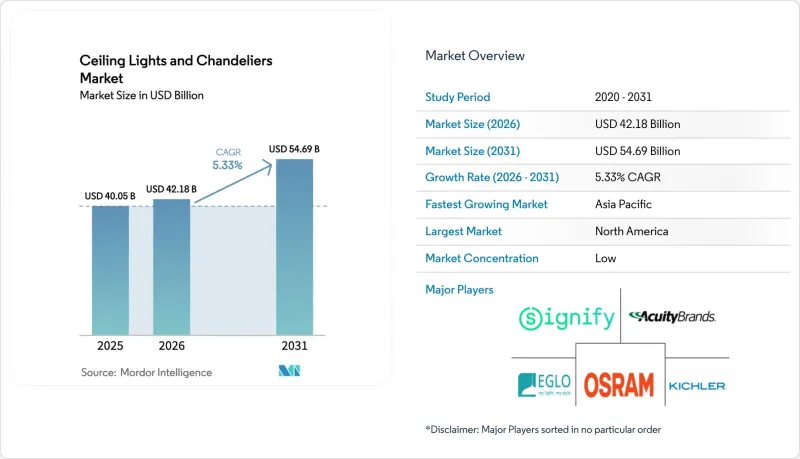
This report Segments Into Product Type (Ceiling Lights, Chandeliers), Lighting Technology (LED, Fluorescent, and More), Material (Metal, Crystal and More), End-User (Residential, Commercial), Distribution Channel (Offline/Showrooms and Specialty Stores, DIY and Home-Improvement Chains and More), and Geography (North America, Europe, and More). The Market Forecasts are Provided in Terms of Value (USD).
Global Ceiling Lights & Chandeliers Market Trends and Insights
Rising home aesthetics and interior design
Lighting has shifted from a purely functional commodity to a defining design element, encouraging homeowners to replace basic fixtures with statement pieces that deliver both ambience and efficiency. Residential lighting still consumes roughly 10% of household electricity, and ENERGY STAR now lists more than 60,000 certified models that blend design and low wattage . Americans spend close to 90% of their time indoors, so improved visual environments consistently rank among the top five home improvement projects. Around 3.7 million United States households upgraded lighting in 2024, underlining steady replacement demand.
Urbanization and Rising Residential Construction
Rapid city growth across Asia-Pacific, the Middle East, and Latin America fuels new-build demand for ceiling-mounted illumination. United Nations data shows 56.2% of the global population lived in urban areas in 2024, with the share tracking toward 68.4% by 2050. Countries will need roughly 2.5 billion new housing units, each requiring multiple fixtures. In the United States, privately owned housing starts hit an annualized 1.56 million in 2024, a 7.2% rise that directly lifts fixture sales.
High Cost of Premium and Fixtures Designer
Statement chandeliers can cost several multiples of standard flush mounts, limiting penetration in price-sensitive segments. Household spending on durable goods is highly elastic above certain thresholds, and tariffs have lifted landed costs for imported components by up to 25% since 2024. Top-income United States households spend 4.7 times more on home furnishings than middle-income peers, illustrating the income asymmetry that caps addressable volume.
Other drivers and restraints analyzed in the detailed report include:
- Technological Advances in Smart and Energy-Efficient Lighting
- Growth in Hospitality and Commercial Real Estate Sectors
- Energy Regulations and Compliance Standards
For complete list of drivers and restraints, kindly check the Table Of Contents.
Segment Analysis
Ceiling lights represented 62.20% of 2025 revenue and remain the default choice across living rooms, kitchens, corridors, and commercial settings. Average United States homes host 12.3 fixtures, two-thirds of which are ceiling mounted . Flush and surface mounts ship in the highest volumes, but pendants show faster growth, reflecting consumer interest in bespoke aesthetics. Chandeliers occupy a smaller slice yet are projected to post a 6.12% CAGR, bolstered by rising installations in dining rooms and hotel lobbies. Imports of decorative fixtures climbed 18.3% in 2024, confirming a resilient appetite for standout designs even when traditional categories mature.
Second-order effects ripple through the ceiling lights & chandeliers market as design expectations converge with smart-home functionality. Leading chandelier makers now experiment with embedded Bluetooth-mesh drivers and tunable-white LEDs, features previously reserved for utilitarian luminaires. New United States single-family builds featuring at least one chandelier rose to 68% in 2024, up 12 points from 2020. These shifts foreshadow a future where decorative form and networked intelligence coexist, widening consumer choice and nudging average selling prices higher.
LED captured 53.51% of sales in 2025 and is on track to exceed 80% penetration by 2030, displacing fluorescent and halogen incumbents. Efficacy gains of nearly 90% over incandescent lamps deliver compelling paybacks for both homeowners and facility managers. Crucially, smart or connected LEDs register an 10.95% medium-term CAGR, reinforcing the ceiling lights & chandeliers market as an IoT on-ramp. Network-ready drivers, integrated sensors, and firmware upgrades transform fixtures into data points for occupancy analytics and asset management.
Fluorescent lighting maintains a presence in certain commercial and institutional applications, though its market share continues to decline as LED retrofits offer compelling returns on investment with payback periods typically under two years.
Complete Report Scope:
- By Product Type
- Ceiling Lights
- Flush/Surface Mount
- Semi-Flush
- Recessed Downlights
- Pendant & Drop Lights
- Chandeliers
- Traditional
- Transitional
- Modern / Contemporary
- Ceiling Lights
- By Lighting Technology
- LED
- Fluorescent
- Incandescent & Halogen
- HID & Others
- By Material
- Metal
- Crystal
- Glass
- Wood & Natural Materials
- Plastics & Composites
- By End-user
- Residential
- Commercial
- Offices and Co-Working Spaces
- Hospitality (Hotels, Resorts, Restaurants)
- Retail & Shopping Malls
- Healthcare Facilities
- Educational Institutions
- Industrial
- By Distribution Channel
- Offline/Showrooms & Specialty Stores
- DIY and Home-Improvement Chains
- Online/E-commerce Platforms
- By Geography
- North America
- Canada
- United States
- Mexico
- South America
- Brazil
- Peru
- Chile
- Argentina
- Rest of South America
- Asia-Pacific
- India
- China
- Japan
- Australia
- South Korea
- South East Asia (Singapore, Malaysia, Thailand, Indonesia, Vietnam, and Philippines)
- Rest of Asia Pacific
- Europe
- United Kingdom
- Germany
- France
- Spain
- Italy
- BENELUX (Belgium, Netherlands, and Luxembourg)
- NORDICS (Denmark, Finland, Iceland, Norway, and Sweden)
- Rest of Europe
- Middle East And Africa
- United Arab Emirates
- Saudi Arabia
- South Africa
- Nigeria
- Rest of Middle East And Africa
- North America
Geography Analysis
North America retains the greatest chunk of the ceiling lights & chandeliers market revenue with 34.50% of market share in 2025. United States households spent USD 457 billion on improvements in 2024, with lighting upgrades a large beneficiary . Around 2.1 billion ceiling fixtures are installed nationally, and replacement rates sit near 8.3% each year. Canadian policy leans heavily on energy performance, advancing LED share beyond United States levels. Mexico's domestic factories saw lighting output rise 12.7% in 2024 as exporters diversified away from Asia.
Asia-Pacific is the fastest-growing territory, set for 8.78% CAGR to 2031. China added 106 million new urban residents between 2020-2024, swelling demand for residential fixtures. India needs 25 million additional homes by 2030, and lighting typically equals 2.7% of construction budgets. Japan's domestic LED output climbed 15.3% in 2024 as renovation cycles accelerated. Korea reached 78% LED penetration in 2024 on the back of stringent energy codes. Singapore's Green Mark program pushes Southeast Asian developers toward efficient luminaires.
Europe remains influential owing to its design heritage and tight regulation. The Ecodesign Directive fully phased out most halogen lamps by 2024, focusing sales on high-efficacy LEDs. Eurostat shows households spend EUR 213 (USD 187.21) yearly on lighting products and power, with daylight variability shaping regional differences. The UK cites lighting as 18% of commercial electricity load, spurring retrofit projects. Germany's fixture manufacturing rose 3.7% in 2024 as suppliers pivoted to premium lines. France's strict light-pollution rules strengthen demand for controlled-beam optics.
- Signify (Philips Lighting)
- OSRAM GmbH
- Eglo Leuchten GmbH
- Kichler Lighting LLC
- Hubbell Lighting Inc.
- Generation Brands (Visual Comfort & Co.)
- Zumtobel Group
- FLOS S.p.A.
- Hudson Valley Lighting Group
- Artemide S.p.A.
- Feilo Sylvania
- Panasonic Life Solutions
- Cree Lighting
- Lutron Electronics
- Hinkley Lighting
- Savoy House
- Schonbek Worldwide Lighting
- Currey & Company
- Foscarini*
Additional Benefits:
- The market estimate (ME) sheet in Excel format
- 3 months of analyst support
TABLE OF CONTENTS
1 Introduction
- 1.1 Study Assumptions & Market Definition
- 1.2 Scope of the Study
2 Research Methodology
3 Executive Summary
4 Market Landscape
- 4.1 Market Overview
- 4.2 Market Drivers
- 4.2.1 Increasing Demand for Home Aesthetics & Interior Design
- 4.2.2 Urbanization and Rising Residential Construction
- 4.2.3 Technological Advancements (Smart & Energy-Efficient Lighting)
- 4.2.4 Growth in Hospitality and Commercial Real Estate Sectors
- 4.2.5 Expanding E-Commerce and Online Retail Channels
- 4.3 Market Restraints
- 4.3.1 High Cost of Premium and Designer Fixtures
- 4.3.2 Energy Regulations and Compliance Standards
- 4.3.3 Installation Complexity and Maintenance Issues
- 4.3.4 Volatility in Raw Material Prices (Glass, Crystal, Metal)
- 4.4 Value / Supply-Chain Analysis
- 4.5 Regulatory Outlook
- 4.6 Technological Outlook
- 4.7 Porter's Five Forces
- 4.7.1 Bargaining Power Suppliers
- 4.7.2 Bargaining Power Buyers
- 4.7.3 Threat of New Entrants
- 4.7.4 Threat of Substitutes
- 4.7.5 Competitive Rivalry
5 Market Size & Growth Forecasts (Value, USD)
- 5.1 By Product Type
- 5.1.1 Ceiling Lights
- 5.1.1.1 Flush/Surface Mount
- 5.1.1.2 Semi-Flush
- 5.1.1.3 Recessed Downlights
- 5.1.1.4 Pendant & Drop Lights
- 5.1.2 Chandeliers
- 5.1.2.1 Traditional
- 5.1.2.2 Transitional
- 5.1.2.3 Modern / Contemporary
- 5.1.1 Ceiling Lights
- 5.2 By Lighting Technology
- 5.2.1 LED
- 5.2.2 Fluorescent
- 5.2.3 Incandescent & Halogen
- 5.2.4 HID & Others
- 5.3 By Material
- 5.3.1 Metal
- 5.3.2 Crystal
- 5.3.3 Glass
- 5.3.4 Wood & Natural Materials
- 5.3.5 Plastics & Composites
- 5.4 By End-user
- 5.4.1 Residential
- 5.4.2 Commercial
- 5.4.2.1 Offices and Co-Working Spaces
- 5.4.2.2 Hospitality (Hotels, Resorts, Restaurants)
- 5.4.2.3 Retail & Shopping Malls
- 5.4.2.4 Healthcare Facilities
- 5.4.2.5 Educational Institutions
- 5.4.3 Industrial
- 5.5 By Distribution Channel
- 5.5.1 Offline/Showrooms & Specialty Stores
- 5.5.2 DIY and Home-Improvement Chains
- 5.5.3 Online/E-commerce Platforms
- 5.6 By Geography
- 5.6.1 North America
- 5.6.1.1 Canada
- 5.6.1.2 United States
- 5.6.1.3 Mexico
- 5.6.2 South America
- 5.6.2.1 Brazil
- 5.6.2.2 Peru
- 5.6.2.3 Chile
- 5.6.2.4 Argentina
- 5.6.2.5 Rest of South America
- 5.6.3 Asia-Pacific
- 5.6.3.1 India
- 5.6.3.2 China
- 5.6.3.3 Japan
- 5.6.3.4 Australia
- 5.6.3.5 South Korea
- 5.6.3.6 South East Asia (Singapore, Malaysia, Thailand, Indonesia, Vietnam, and Philippines)
- 5.6.3.7 Rest of Asia Pacific
- 5.6.4 Europe
- 5.6.4.1 United Kingdom
- 5.6.4.2 Germany
- 5.6.4.3 France
- 5.6.4.4 Spain
- 5.6.4.5 Italy
- 5.6.4.6 BENELUX (Belgium, Netherlands, and Luxembourg)
- 5.6.4.7 NORDICS (Denmark, Finland, Iceland, Norway, and Sweden)
- 5.6.4.8 Rest of Europe
- 5.6.5 Middle East And Africa
- 5.6.5.1 United Arab Emirates
- 5.6.5.2 Saudi Arabia
- 5.6.5.3 South Africa
- 5.6.5.4 Nigeria
- 5.6.5.5 Rest of Middle East And Africa
- 5.6.1 North America
6 Competitive Landscape
- 6.1 Market Concentration
- 6.2 Strategic Moves
- 6.3 Market Share Analysis
- 6.4 Company Profiles {includes Global level Overview, Market level overview, Core Segments, Financials as available, Strategic Information, Market Rank/Share for key companies, Products & Services, and Recent Developments}
- 6.4.1 Signify (Philips Lighting)
- 6.4.2 OSRAM GmbH
- 6.4.3 Eglo Leuchten GmbH
- 6.4.4 Kichler Lighting LLC
- 6.4.5 Hubbell Lighting Inc.
- 6.4.6 Generation Brands (Visual Comfort & Co.)
- 6.4.7 Zumtobel Group
- 6.4.8 FLOS S.p.A.
- 6.4.9 Hudson Valley Lighting Group
- 6.4.10 Artemide S.p.A.
- 6.4.11 Feilo Sylvania
- 6.4.12 Panasonic Life Solutions
- 6.4.13 Cree Lighting
- 6.4.14 Lutron Electronics
- 6.4.15 Hinkley Lighting
- 6.4.16 Savoy House
- 6.4.17 Schonbek Worldwide Lighting
- 6.4.18 Currey & Company
- 6.4.19 Foscarini*
7 Market Opportunities & Future Outlook
- 7.1 White-space & Unmet-Need Assessment

