PUBLISHER: Mordor Intelligence | PRODUCT CODE: 2154741

PUBLISHER: Mordor Intelligence | PRODUCT CODE: 2154741
Hydrogen Gas Generator - Market Share Analysis, Industry Trends & Statistics, Growth Forecasts (2026 - 2031)
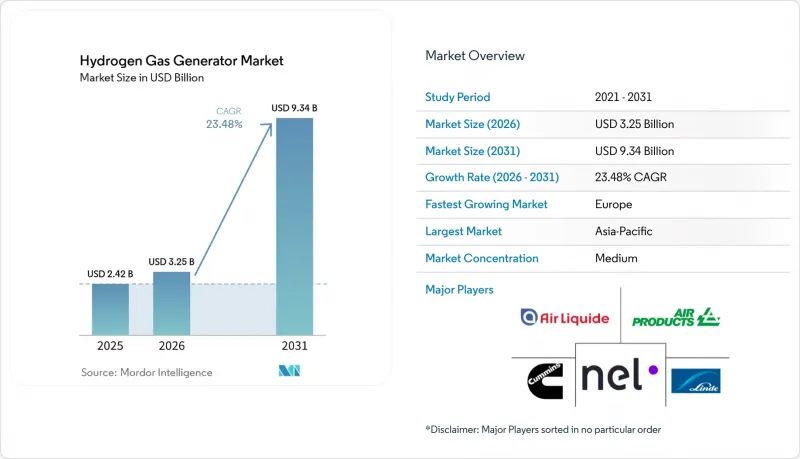
According to Mordor Intelligence, the hydrogen gas generator market size is projected to expand from USD 2.42 billion in 2025 and USD 3.25 billion in 2026 to USD 9.34 billion by 2031, registering a CAGR of 23.48% between 2026 and 2031.
Global Hydrogen Gas Generator Market Trends and Insights
Industrial Decarbonization and Low-Carbon Hydrogen Procurement
Industrial buyers are increasingly including carbon-intensity requirements in hydrogen supply decisions, not only price and volume. This gives the Hydrogen gas generator market a clearer demand signal where procurement rules are binding. The EU regulation on environmental sustainability requirements applies to relevant public procurement procedures launched from June 30, 2026, and includes electrolyzers among covered net-zero technologies. This changes the addressable opportunity for lower-carbon equipment in the European Hydrogen gas generator market. China's 15th Five-Year Energy Plan set a target of 2 million tonnes of annual renewable hydrogen production by 2030 and introduced a 2026 pilot program for ammonia, methanol, and steel users. These programs can shorten procurement timelines for large alkaline and PEM systems. Suppliers with manufacturing capacity and firm delivery schedules are therefore better placed to serve projects that are moving from early planning to equipment orders.
Onsite Supply for Refining, Chemicals, and Electronics
Refineries, chemical plants, and semiconductor facilities use onsite generation to reduce exposure to delivered-gas supply risks. Plug Power completed installation of 100 MW of PEM electrolyzers at Galp's Sines Refinery in January 2026, with expected output of 15,000 tonnes of renewable hydrogen per year and annual emissions reductions of 110,000 tonnes of CO2e. Refining applications require substantial output, while semiconductor applications require closely controlled purity and dependable uptime. This difference supports demand across the capacity range in the Hydrogen gas generator market. Large process sites favor systems that can be embedded in existing operations and supported over many years. Smaller electronics and laboratory sites favor integrated purification, monitoring, and responsive service arrangements.
High Capital Cost and Green-Hydrogen Cost Premium
The cost premium for renewable hydrogen remains the main barrier to broader adoption in the Hydrogen gas generator market. ACER reported that renewable hydrogen in Europe costs 4 times more than conventional hydrogen in 2024. The gap is expected to narrow where renewable resources, carbon pricing, and imported gas costs support the business case. It is likely to remain wider where domestic gas is inexpensive and blue hydrogen has a clear cost advantage. Projects without subsidies, firm offtake contracts, or carbon pricing face more difficult financing conditions. Lenders also need confidence in long-term electrolyzer performance, which makes warranties and operating evidence important to project financing.
Other drivers and restraints analyzed in the detailed report include:
- Electrolyzer Cost and Efficiency Improvements
- Hydrogen Mobility and Refueling Infrastructure
- Hydrogen Storage, Transport, and Safety Complexity
For complete list of drivers and restraints, kindly check the Table Of Contents.
Segment Analysis
Gray hydrogen held 71.8% of the Hydrogen gas generator market share in 2025 because steam methane reforming remained established at refinery, ammonia, and methanol facilities. Its installed base and lower current cost continue to shape purchasing decisions. Black and brown hydrogen remain concentrated in locations that rely on coal and lignite gasification. Blue hydrogen retains a near-term role in North America and the Middle East, where gas supply and carbon storage options support industrial projects. Green hydrogen is forecast to record the fastest growth at a 33.6% CAGR through 2031 as procurement commitments support larger electrolyzer orders.
The European Hydrogen Bank's third auction awarded more than EUR 1 billion, equivalent to USD 1.09 billion, to 9 projects in 7 European Economic Area countries in February 2026. The selected projects represent 1.1 GW of electrolyzer capacity and more than 1.3 million tonnes of hydrogen in their first 10 years. India's National Green Hydrogen Mission is targeting at least 5 million metric tonnes of annual green hydrogen production capacity by 2030. The EU target for 42% renewable hydrogen use in industry by 2030 gives developers a clearer basis for equipment commitments. These commitments strengthen the transition toward lower-emissions production pathways in the Hydrogen gas generator market.
Complete Report Scope:
- By Hydrogen Type
- Green Hydrogen
- Gray Hydrogen
- Black/Brown Hydrogen
- Blue Hydrogen
- By Type
- Onsite
- Portable
- By Capacity
- Less than 5 Nm3/h
- 5-15 Nm3/h
- 15-100 Nm3/h
- 100-2,000 Nm3/h
- Greater than 2,000 Nm3/h
- By Geography
- North America
- United States
- Canada
- Mexico
- Europe
- Germany
- France
- Italy
- Spain
- United Kingdom
- Poland
- Russia
- Rest of Europe
- Asia-Pacific
- China
- India
- Japan
- South Korea
- Australia
- Indonesia
- Vietnam
- Thailand
- Rest of Asia-Pacific
- South America
- Brazil
- Argentina
- Chile
- Rest of South America
- Middle East and Africa
- Saudi Arabia
- United Arab Emirates
- Egypt
- South Africa
- Morocco
- Rest of Middle East and Africa
- North America
Geography Analysis
Asia-Pacific held 47.1% of the Hydrogen gas generator market share in 2025, supported by China's large electrolyzer manufacturing base and the hydrogen programs of Japan and South Korea. China's 2026 energy plan targets 2 million tonnes of annual renewable hydrogen production by 2030 and expands use beyond fuel cell vehicles to industrial customers. Japan's demand includes hydrogen and ammonia co-firing as well as onsite production models. India adds to regional demand through the National Green Hydrogen Mission and large green ammonia project planning. South Korea's fuel cell vehicle deployment supports demand for station-format generation.
Europe is forecast to grow at a 26.8% CAGR through 2031, the highest regional rate in the Hydrogen gas generator market. The European Hydrogen Bank auction committed more than EUR 1 billion, equivalent to USD 1.09 billion, to 9 projects that total 1.1 GW of electrolyzer capacity. The Hamburg Green Hydrogen Hub selected Siemens Energy to supply a 100 MW electrolyzer for an annual output of 10,000 tonnes of green hydrogen. Spain's Moeve project adds a 300 MW supply agreement to the regional pipeline. Regulatory requirements under RED III and the Net-Zero Industry Act improve demand visibility across European markets.
North American activity is supported by federal clean-hydrogen cost goals and investment in Gulf Coast refinery applications and regional hubs. Chile has advanced export-oriented projects because the Atacama Desert has strong renewable resources. Brazil and Argentina are developing capacity under national decarbonization programs. Saudi Arabia, the UAE, Egypt, Morocco, and South Africa are developing export projects, although infrastructure and offtake agreements have progressed more slowly than early announcements.
- Air Products and Chemicals, Inc.
- Asahi Kasei Corporation
- Cummins Inc.
- Enapter AG
- EPOCH Energy Technology Corp.
- HyGear B.V.
- Idroenergy S.r.l.
- ITM Power plc
- John Cockerill S.A.
- L'Air Liquide S.A.
- Linde plc
- McPhy Energy S.A.
- MVS Engineering Pvt. Ltd.
- Nel ASA
- Peak Scientific Instruments Ltd.
- Plug Power Inc.
- Siemens Energy AG
- Teledyne Energy Systems, Inc.
- thyssenkrupp nucera AG & Co. KGaA
- Toshiba Corporation
Additional Benefits:
- The market estimate (ME) sheet in Excel format
- 3 months of analyst support
TABLE OF CONTENTS
1 INTRODUCTION
- 1.1 Study Assumptions and Market Definition
- 1.2 Scope of the Study
2 RESEARCH METHODOLOGY
3 EXECUTIVE SUMMARY
4 MARKET LANDSCAPE
- 4.1 Market Overview
- 4.2 Market Drivers
- 4.2.1 Industrial Decarbonization and Low-Carbon Hydrogen Procurement
- 4.2.2 Onsite Supply for Refining, Chemicals, and Electronics
- 4.2.3 Electrolyzer Cost and Efficiency Improvements
- 4.2.4 Hydrogen Mobility and Refueling Infrastructure
- 4.2.5 Distributed Hydrogen for Grid-Resilient Power
- 4.2.6 Hydrogen Purity Requirements in Semiconductor and Laboratory Applications
- 4.3 Market Restraints
- 4.3.1 High Capital Cost and Green-Hydrogen Cost Premium
- 4.3.2 Hydrogen Storage, Transport, and Safety Complexity
- 4.3.3 Stack Degradation, Water Quality, and Balance-of-Plant Maintenance
- 4.3.4 Interconnection Delays and Intermittent Renewable Power Availability
- 4.4 Supply-Chain Analysis
- 4.5 Porter's Five Forces Analysis
- 4.5.1 Bargaining Power of Suppliers
- 4.5.2 Bargaining Power of Buyers
- 4.5.3 Threat of New Entrants
- 4.5.4 Threat of Substitutes
- 4.5.5 Competitive Rivalry
- 4.6 Technology Outlook
- 4.7 Regulatory Landscape
- 4.8 Investment Analysis
5 MARKET SIZE AND GROWTH FORECASTS
- 5.1 By Hydrogen Type
- 5.1.1 Green Hydrogen
- 5.1.2 Gray Hydrogen
- 5.1.3 Black/Brown Hydrogen
- 5.1.4 Blue Hydrogen
- 5.2 By Type
- 5.2.1 Onsite
- 5.2.2 Portable
- 5.3 By Capacity
- 5.3.1 Less than 5 Nm3/h
- 5.3.2 5-15 Nm3/h
- 5.3.3 15-100 Nm3/h
- 5.3.4 100-2,000 Nm3/h
- 5.3.5 Greater than 2,000 Nm3/h
- 5.4 By Geography
- 5.4.1 North America
- 5.4.1.1 United States
- 5.4.1.2 Canada
- 5.4.1.3 Mexico
- 5.4.2 Europe
- 5.4.2.1 Germany
- 5.4.2.2 France
- 5.4.2.3 Italy
- 5.4.2.4 Spain
- 5.4.2.5 United Kingdom
- 5.4.2.6 Poland
- 5.4.2.7 Russia
- 5.4.2.8 Rest of Europe
- 5.4.3 Asia-Pacific
- 5.4.3.1 China
- 5.4.3.2 India
- 5.4.3.3 Japan
- 5.4.3.4 South Korea
- 5.4.3.5 Australia
- 5.4.3.6 Indonesia
- 5.4.3.7 Vietnam
- 5.4.3.8 Thailand
- 5.4.3.9 Rest of Asia-Pacific
- 5.4.4 South America
- 5.4.4.1 Brazil
- 5.4.4.2 Argentina
- 5.4.4.3 Chile
- 5.4.4.4 Rest of South America
- 5.4.5 Middle East and Africa
- 5.4.5.1 Saudi Arabia
- 5.4.5.2 United Arab Emirates
- 5.4.5.3 Egypt
- 5.4.5.4 South Africa
- 5.4.5.5 Morocco
- 5.4.5.6 Rest of Middle East and Africa
- 5.4.1 North America
6 COMPETITIVE LANDSCAPE
- 6.1 Market Concentration
- 6.2 Strategic Moves
- 6.3 Market Share Analysis
- 6.4 Company Profiles (includes Global Level Overview, Market Level Overview, Core Segments, Financials as available, Strategic Information, Products and Services, Recent Developments)
- 6.4.1 Air Products and Chemicals, Inc.
- 6.4.2 Asahi Kasei Corporation
- 6.4.3 Cummins Inc.
- 6.4.4 Enapter AG
- 6.4.5 EPOCH Energy Technology Corp.
- 6.4.6 HyGear B.V.
- 6.4.7 Idroenergy S.r.l.
- 6.4.8 ITM Power plc
- 6.4.9 John Cockerill S.A.
- 6.4.10 L'Air Liquide S.A.
- 6.4.11 Linde plc
- 6.4.12 McPhy Energy S.A.
- 6.4.13 MVS Engineering Pvt. Ltd.
- 6.4.14 Nel ASA
- 6.4.15 Peak Scientific Instruments Ltd.
- 6.4.16 Plug Power Inc.
- 6.4.17 Siemens Energy AG
- 6.4.18 Teledyne Energy Systems, Inc.
- 6.4.19 thyssenkrupp nucera AG & Co. KGaA
- 6.4.20 Toshiba Corporation
7 MARKET OPPORTUNITIES AND FUTURE OUTLOOK
- 7.1 White-Space and Unmet-Need Assessment

