PUBLISHER: Mordor Intelligence | PRODUCT CODE: 2157035

PUBLISHER: Mordor Intelligence | PRODUCT CODE: 2157035
Metro Dense Wave Division Multiplexing (DWDM) - Market Share Analysis, Industry Trends & Statistics, Growth Forecasts (2026 - 2031)
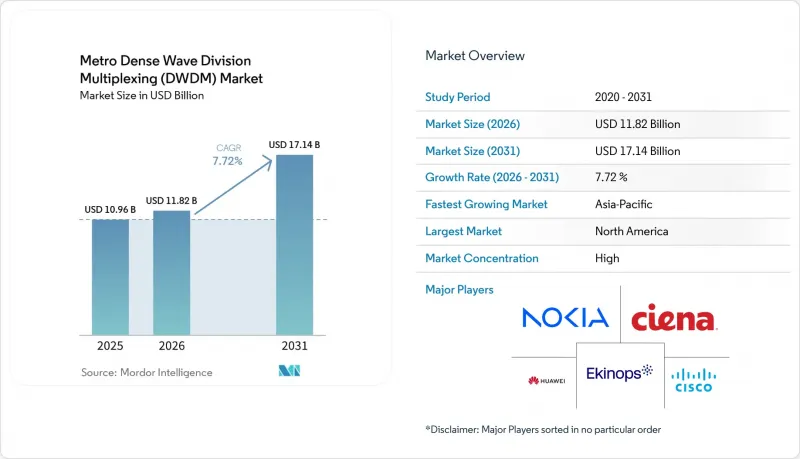
According to Mordor Intelligence, the metro dense wave division multiplexing (DWDM) market size is expected to grow from USD 10.96 billion in 2025 to USD 11.82 billion in 2026, and is forecast to reach USD 17.14 billion by 2031, at a 7.72% CAGR over 2026-2031.
Global Metro Dense Wave Division Multiplexing (DWDM) Market Trends and Insights
Hyperscale and AI Data Center Interconnect Demand
Distributed AI training is changing the role of the Metro DWDM market from carrier aggregation toward compute interconnection. Hyperscalers are distributing computing capacity across multiple sites because individual locations face power and land constraints. This approach requires low-latency, high-capacity wavelengths between facilities that can be 5-80 km apart. Meta adopted 800ZR+ modules in an IP-over-DWDM configuration for geographically distributed GPU clusters. The deployment shows that the distributed computing clusters require capacity across metropolitan locations. Demand volumes are increasing, but dark fiber remains an alternative for hyperscalers and can limit wavelength-service margins in the Metro DWDM market.
5G xHaul and Mobile Edge Capacity Expansion
5G densification increases transport requirements because networks need more cell sites, tighter fronthaul latency, and higher capacity at each site. The Metro DWDM market benefits where mobile operators combine fronthaul, midhaul, and backhaul into shared transport networks. O-RAN Alliance Working Group 9 specifications define open xHaul transport across these network functions. China had deployed 4.76 million 5G base stations by the end of 2025, creating a large base for continuing midhaul upgrades in major cities. Distributed unit aggregation is concentrating more capacity at fewer metro nodes. That configuration supports upgrades from 100G to 400G coherent transport in existing rings, rather than small additions of lower-speed ports.
Integration Complexity in Disaggregated Multivendor Networks
Disaggregated optical networks separate the optical line system from the transponder layer, allowing operators to purchase layers from different suppliers. This flexibility also increases integration work and can slow deployments in the Metro DWDM market. Optical performance must be qualified when wavelengths from one supplier operate across another supplier's line system. An Optica paper on multivendor IPoDWDM evaluated performance and control-plane validation in these environments. The OpenROADM model provides a framework for interoperability, but controllers may need to manage several model versions. Smaller operators can face greater software and operational burdens due to limited capacity for testing and integration.
Other drivers and restraints analyzed in the detailed report include:
- Migration to 400G, 800G, and 1.6T Coherent Optics
- Fiber Scarcity and Capacity Scaling on Existing Routes
- Fiber-Duct and Rights-of-Way Constraints in Dense Urban Corridors
For complete list of drivers and restraints, kindly check the Table Of Contents.
Segment Analysis
Hardware accounted for 82.65% of revenue in 2025, making it the leading component category. That position reflected extensive operator investment in coherent line cards, muxponders, transponders, and in-line amplifiers. These systems form the physical layer for transmitting large volumes of traffic over metropolitan fiber routes. Coherent line cards for 400G and 800G transmission lead new hardware procurement. Operators are replacing older 10G and 40G infrastructure with systems that offer substantially improved spectral efficiency. The scale of existing carrier networks means equipment refreshes continue to create hardware demand. Installation and network-management services also accompany many hardware upgrades. These services help operators install, configure, and maintain new optical capacity.
Software is projected to record an 11.53% CAGR through 2031, the highest rate among components in the Metro DWDM market. Software-defined optical platforms enable dynamic wavelength routing across complex transport networks. They also provide automated performance monitoring that can identify operational issues more quickly. Centralized traffic engineering gives network teams more control over available capacity. Ciena highlighted agentic AI network automation in its March 2026 optical portfolio. Nokia's application-focused solutions likewise reflect the need to align optical systems with specific network uses. Open interfaces increase the importance of software that can operate across equipment layers. As a result, control-plane capabilities can carry more weight in procurement decisions.
The 400 Gbps tier held 31.85% of revenue in 2025, the largest share among transmission-capacity categories. Its position reflected the maturity of 400G coherent technology across operator metro cores and data center interconnect applications. The Metro DWDM market size for the 400 Gbps tier benefited from deployments made during the preceding 3 years. This technology offers a proven upgrade path for operators that need greater capacity on established routes. Up-to-100 Gbps systems still operate in legacy access rings and long-tail enterprise networks. The 200 Gbps category serves selected regional requirements where the demand profile remains narrower. Investment is shifting toward higher capacities as traffic loads rise. This leaves 400G as a large installed base and above-400 Gbps as the next investment focus.
Above-400 Gbps solutions are projected to register a 12.43% CAGR through 2031. The category includes 800G and 1.6T architectures used for high-capacity metropolitan and data center deployments. These systems help operators expand traffic capacity without adding the same amount of new fiber infrastructure. Ciena announced 800 Gbps C-band and L-band coherent pluggables with its 2 nm silicon platform. Nokia also announced 1.6T IP-over-DWDM products for data center interconnect deployments. Higher-rate products are becoming increasingly relevant as distributed computing drives more traffic across facilities. Broader 800G deployment also puts 400G pricing under pressure per gigabit. Vendors are accelerating work on 800G and 1.6T products to maintain technology leadership.
Complete Report Scope:
- By Component
- Hardware
- Software
- Services
- By Transmission Capacity
- Up to 100 Gbps
- 200 Gbps
- 400 Gbps
- Above 400 Gbps
- By Application
- Data Center Interconnect
- Mobile Backhaul and Fronthaul
- Broadband and Access Network Aggregation
- Other Applications
- By End-User
- Communication Service Providers
- Cloud and Data Center Providers
- Enterprises
- Government and Public Sector
- By Geography
- North America
- United States
- Canada
- Mexico
- South America
- Brazil
- Argentina
- Rest of South America
- Europe
- Germany
- United Kingdom
- France
- Italy
- Spain
- Rest of Europe
- Asia-Pacific
- China
- Japan
- South Korea
- India
- Australia and New Zealand
- Rest of Asia-Pacific
- Middle East
- Saudi Arabia
- United Arab Emirates
- Rest of Middle East
- Africa
- South Africa
- Nigeria
- Rest of Africa
- North America
Geography Analysis
North America held 35.11% of the Metro DWDM market share in 2025. The region benefits from a high concentration of hyperscale data center campuses. The United States is the main source of demand, with data center interconnect serving as a major application. Ciena entered 2026 with approximately USD 5.0 billion in backlog and described itself as essentially sold out, reflecting accumulated customer demand. Canada adds domestic interconnect investment related to data sovereignty requirements. Mexico is benefiting from data center development in Queretaro that is tied to nearshoring activity.
Asia-Pacific is projected to register an 8.92% CAGR through 2031, the fastest rate among geographic areas. China's 4.76 million 5G base stations deployed by the end of 2025 support ongoing midhaul optical upgrades. India is the fastest-expanding country within the regional Metro DWDM market. Ciena stated that Vodafone Idea deployed WaveLogic 6 Extreme technology in India in March 2026, supporting up to 1.6 Tbps per wavelength. Data center investment, fiberization programs, and mobile-network capacity upgrades support regional demand.
Japan and South Korea continue to need capacity for 5G-Advanced upgrades. Southeast Asia and Australia are replacing legacy SONET and SDH systems with coherent DWDM infrastructure. Europe has mature demand in its Western markets, while Eastern Europe is expanding with support from EU cohesion funding. Infrastructure-sharing obligations under the European Electronic Communications Code are relevant to network planning in Europe. Saudi Arabia and the UAE are adding metro capacity through large infrastructure programs. South Africa and Nigeria lead a developing African market, supported by investments in submarine cable landings.
- Huawei Technologies Co., Ltd.
- Ciena Corporation
- Nokia Corporation
- Cisco Systems, Inc.
- ZTE Corporation
- Fujitsu Limited
- NEC Corporation
- ADTRAN Holdings, Inc.
- Ribbon Communications Inc.
- Juniper Networks, Inc.
- FiberHome Telecommunication Technologies Co., Ltd.
- Ekinops SA
- Coherent Corp.
- Lumentum Holdings Inc.
- Tejas Networks Limited
- Padtec Holding S.A.
- PacketLight Networks Ltd.
- Mitsubishi Electric Corporation
- Smartoptics Group AS
Additional Benefits:
- The market estimate (ME) sheet in Excel format
- 3 months of analyst support
TABLE OF CONTENTS
1 INTRODUCTION
- 1.1 Study Assumptions and Market Definition
- 1.2 Scope of the Study
2 RESEARCH METHODOLOGY
3 EXECUTIVE SUMMARY
4 MARKET LANDSCAPE
- 4.1 Market Overview
- 4.2 Market Drivers
- 4.2.1 5G xHaul and Mobile Edge Capacity Expansion
- 4.2.2 Hyperscale and AI Data Center Interconnect Demand
- 4.2.3 Migration to 400G, 800G, and 1.6T Coherent Optics
- 4.2.4 Fiber Scarcity and Capacity Scaling on Existing Routes
- 4.2.5 IP-over-DWDM and Router-Embedded Coherent Pluggables
- 4.2.6 Metro Edge Sustainability and Power-per-Bit Reduction
- 4.3 Market Restraints
- 4.3.1 Fiber-Duct and Rights-of-Way Constraints in Dense Urban Corridors
- 4.3.2 Integration Complexity in Disaggregated Multivendor Networks
- 4.3.3 High Skills Requirement for Optical Planning and Operations
- 4.3.4 Pluggable Optics Cannibalization of Standalone Transport Hardware
- 4.4 Industry Value Chain Analysis
- 4.5 Regulatory Landscape
- 4.6 Technological Outlook
- 4.7 Porter's Five Forces Analysis
- 4.7.1 Bargaining Power of Suppliers
- 4.7.2 Bargaining Power of Buyers
- 4.7.3 Threat of New Entrants
- 4.7.4 Threat of Substitutes
- 4.7.5 Competitive Rivalry
- 4.8 Impact of Macroeconomic Factors on the Market
5 MARKET SIZE AND GROWTH FORECASTS (VALUE)
- 5.1 By Component
- 5.1.1 Hardware
- 5.1.2 Software
- 5.1.3 Services
- 5.2 By Transmission Capacity
- 5.2.1 Up to 100 Gbps
- 5.2.2 200 Gbps
- 5.2.3 400 Gbps
- 5.2.4 Above 400 Gbps
- 5.3 By Application
- 5.3.1 Data Center Interconnect
- 5.3.2 Mobile Backhaul and Fronthaul
- 5.3.3 Broadband and Access Network Aggregation
- 5.3.4 Other Applications
- 5.4 By End-User
- 5.4.1 Communication Service Providers
- 5.4.2 Cloud and Data Center Providers
- 5.4.3 Enterprises
- 5.4.4 Government and Public Sector
- 5.5 By Geography
- 5.5.1 North America
- 5.5.1.1 United States
- 5.5.1.2 Canada
- 5.5.1.3 Mexico
- 5.5.2 South America
- 5.5.2.1 Brazil
- 5.5.2.2 Argentina
- 5.5.2.3 Rest of South America
- 5.5.3 Europe
- 5.5.3.1 Germany
- 5.5.3.2 United Kingdom
- 5.5.3.3 France
- 5.5.3.4 Italy
- 5.5.3.5 Spain
- 5.5.3.6 Rest of Europe
- 5.5.4 Asia-Pacific
- 5.5.4.1 China
- 5.5.4.2 Japan
- 5.5.4.3 South Korea
- 5.5.4.4 India
- 5.5.4.5 Australia and New Zealand
- 5.5.4.6 Rest of Asia-Pacific
- 5.5.5 Middle East
- 5.5.5.1 Saudi Arabia
- 5.5.5.2 United Arab Emirates
- 5.5.5.3 Rest of Middle East
- 5.5.6 Africa
- 5.5.6.1 South Africa
- 5.5.6.2 Nigeria
- 5.5.6.3 Rest of Africa
- 5.5.1 North America
6 COMPETITIVE LANDSCAPE
- 6.1 Market Concentration
- 6.2 Strategic Moves
- 6.3 Market Share Analysis
- 6.4 Company Profiles (includes Global Level Overview, Market Level Overview, Core Segments, Financials as available, Strategic Information, Market Rank/Share, Products and Services, Recent Developments)
- 6.4.1 Huawei Technologies Co., Ltd.
- 6.4.2 Ciena Corporation
- 6.4.3 Nokia Corporation
- 6.4.4 Cisco Systems, Inc.
- 6.4.5 ZTE Corporation
- 6.4.6 Fujitsu Limited
- 6.4.7 NEC Corporation
- 6.4.8 ADTRAN Holdings, Inc.
- 6.4.9 Ribbon Communications Inc.
- 6.4.10 Juniper Networks, Inc.
- 6.4.11 FiberHome Telecommunication Technologies Co., Ltd.
- 6.4.12 Ekinops SA
- 6.4.13 Coherent Corp.
- 6.4.14 Lumentum Holdings Inc.
- 6.4.15 Tejas Networks Limited
- 6.4.16 Padtec Holding S.A.
- 6.4.17 PacketLight Networks Ltd.
- 6.4.18 Mitsubishi Electric Corporation
- 6.4.19 Smartoptics Group AS
7 MARKET OPPORTUNITIES AND FUTURE OUTLOOK
- 7.1 White-Space and Unmet-Need Assessment

