PUBLISHER: Mordor Intelligence | PRODUCT CODE: 2157147

PUBLISHER: Mordor Intelligence | PRODUCT CODE: 2157147
Refrigerated Container Shipping - Market Share Analysis, Industry Trends & Statistics, Growth Forecasts (2026 - 2031)
According to Mordor Intelligence, the refrigerated container shipping market is projected to expand from USD 9.99 billion in 2025 to USD 10.48 billion in 2026 and reach USD 12.64 billion by 2031, registering a 3.81% CAGR between 2026 and 2031.
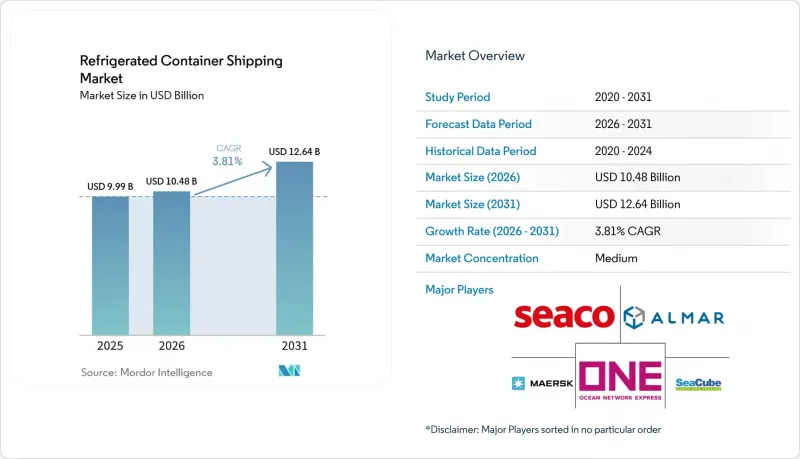
Growth is anchored in Asia-Pacific's expanding protein trade and in regulatory tailwinds that favor low-GWP refrigeration technology, yet recent rerouting around the Suez Canal has tightened effective capacity and pushed spot rates higher, exposing shippers to cost volatility. This report is Segmented by Transportation Mode (Seaways, and More), by Container Size (Small, Large, High Cube), by Temperature Range (Chilled, Frozen), by Application (Horticulture, Dairy, Meat/Fish/Poultry, Processed Food, and More), and by Geography (North America, South America, Asia-Pacific, Europe, Middle East and Africa). The Market Forecasts are Provided in Terms of Market Value (USD).
Global Refrigerated Container Shipping Market Trends and Insights
Growing Trade Relations
Preferential tariff frameworks such as RCEP allow Chinese exporters to ship 92% of fruits and vegetables under reduced duties, prompting an 18.7% year-on-year rise in fresh-produce exports during early 2026. Express reefer loops linking Guangxi to Ho Chi Minh City cut transit by up to two days and deliver 60-70% cost savings versus air, steering reefer demand from long-haul point-to-point models toward nimble intra-Asia feeders. Mexico's USD 10 billion produce trade leverages USMCA customs streamlining, reinforcing north-south reefer corridors into North America. The gravitational pull of tariff optimization and compressed lead times is realigning fleets, with carriers redeploying boxes toward regional hub-and-spoke networks and away from congested mainline passages.
Increased Demand for Perishable Goods
China's cold-chain logistics volume rose to 381.4 million tons in 2025, a 4.5% gain driven by online grocery platforms that promise same-day delivery. Infrastructure build-outs in lower-tier cities now enable Chilean cherries to traverse 20-day routes under controlled atmospheres without jeopardizing shelf life. Fresh chilled fish imports rocketed by 97% in volume as buyers sourced lower-cost Southeast Asian supplies, illustrating a barbell market where commodity flows chase efficiency while premium cargo pays for guaranteed plug points. This bifurcation forces the refrigerated container shipping market to tailor capacity, pricing, and service levels to two distinct value pools.
High Cost of Maintaining Reefers
Variable-speed fans and advanced compressors can trim energy use by up to 20%, yet overhaul and calibration still absorb 10-20% of annual unit revenue. EU F-gas and the United States AIM Act mandates accelerate the switch to natural refrigerants such as R744, pushing capital requirements higher and straining small operators. China's December 2025 directive promoting low-carbon cold chains likewise retires legacy trucks, compressing payback windows but promising longer-term efficiency dividends.
Other drivers and restraints analyzed in the detailed report include:
- Rising Demand for Temperature-Sensitive Pharmaceuticals
- Shift Toward Protein-Rich Diets in Emerging Asia
- Volatile Reefer Freight Rates Linked to Fuel Surcharges
For complete list of drivers and restraints, kindly check the Table Of Contents.
Segment Analysis
Seaways commanded 81.69% market share in 2025, retaining primacy for intercontinental lanes where the refrigerated container shipping market benefits from cost-per-kilogram efficiency. Rail-sea intermodal, however, is forecast to grow at a 4.55% CAGR as China-ASEAN express loops shave up to two days off door-to-door schedules. The refrigerated container shipping market size for non-maritime modes remains modest. Still, it attracts investment in plug-point rail ramps and electric urban trucks, signaling a pivot toward agile, blended networks. Equipment harmonization and real-time orchestration become critical because cold-chain integrity can falter during mode transfers.
The modal shift accelerates when geopolitical tensions disrupt the oceans. Cape detours on Asia-Europe strings push shippers toward Central Asian rail corridors despite higher tariffs, and electric truck penetration surpassing 35% in China by mid-2025 unlocks zero-emission last-mile loops in polluted megacities. Yet constraints persist: limited chassis pools, urban delivery curfews, and scarce genset fuel infrastructure in secondary ports risk service gaps unless carriers coordinate across stakeholders.
High cube units held 47.79% market share in 2025 and are expanding at 4.01% CAGR. Their 13% extra volume lowers per-kilogram freight on dense trade lanes, explaining why newbuild orders favor the format even at a 5-15% premium. The refrigerated container shipping market for standard 40-ft boxes endures where bridge clearances, inland rail tunnels, or yard-handling gear restrict 9 ft 6 inches of height. Small boxes retain relevance for e-grocery and pharmaceutical sample flows that prize flexibility over scale.
CIMC sold 92,000 TEU of reefers in H1 2025, more than doubling year-on-year, while Singamas accelerated custom builds for energy storage and multi-temperature designs. These investments underscore how size segmentation has evolved beyond dimensional categories into a spectrum of insulation grades, door configurations, and IoT packages that tailor total-cost-of-ownership to cargo needs.
Complete Report Scope:
- By Transportation Mode
- Seaways
- Others
- By Container Size
- Small Containers
- Large Containers
- High Cube Containers
- By Temperature Range
- Chilled
- Frozen
- By Application
- Horticulture (Fresh Fruits and Vegetables)
- Dairy Products (Milk, Ice-cream, Butter, etc.)
- Meat, Fish, and Poultry
- Processed Food Products
- Pharma and Lifesciences
- Other Application
- By Region
- North America
- United States
- Canada
- Mexico
- South America
- Brazil
- Peru
- Chile
- Argentina
- Rest of South America
- Asia-Pacific
- India
- China
- Japan
- Australia
- South Korea
- South East Asia
- Rest of Asia-Pacific
- Europe
- United Kingdom
- Germany
- France
- Spain
- Italy
- BENELUX (Belgium, Netherlands, and Luxembourg)
- NORDICS (Denmark, Finland, Iceland, Norway, and Sweden)
- Rest of Europe
- Middle East and Africa
- United Arab Emirates
- Saudi Arabia
- South Africa
- Egypt
- Rest of Middle East And Africa
- North America
Geography Analysis
Asia-Pacific generated 41.02% of 2025 revenue and is advancing at 4.10% CAGR. China's 277 million m3 of cold storage, up 5.53% during 2025, supports urban distribution to lower-tier cities, absorbing flows of Chilean cherries and Southeast Asian fish. Electric trucks already account for 35.8% of China's refrigerated road fleet, reducing last-mile emissions and setting benchmarks that other emerging markets aim to emulate.
North America wrestles with softer import demand: NRF forecasted inbound boxes in Q1 2026 at 7% below the prior year, directly trimming reefer volumes tied to produce and consumer staples. Europe, meanwhile, faces longer Cape detours, but terminal upgrades at Le Havre and Hapag-Lloyd's new Damietta hub mitigate some capacity crunch by speeding reefer plug-point turnover.
Latin America's export model accounts for 40% of cold-chain demand. Polarport Veracruz volumes jumped 57% in early 2025, straining socket availability and genset logistics. Brazil's beef and Chile's salmon rely almost exclusively on maritime reefers, exposing regional economies to freight shocks yet also anchoring charter demand even when dry-cargo markets soften.
Middle East and Africa contribute modest volumes yet carry oversized risk. AIS spoofing incidents in the Strait of Hormuz and Suez transits suspensions in 2026 amplified war-risk premiums to USD 1,500 per TEU, forcing carriers to recalc service rotations. South African citrus bound for Europe and Asia must now budget wider buffers, while East African seafood exporters pivot to charter flights when maritime dwell exceeds shelf life.
- A.P. Moller-Maersk
- MSC Mediterranean Shipping Co. S.A.
- CMA CGM Group
- China International Marine Containers (CIMC) Group
- Hapag-Lloyd AG
- Ocean Network Express Pte. Ltd.
- ZIM Integrated Shipping Services Ltd.
- Triton International Ltd.
- Seaco Srl
- SeaCube Container Leasing Ltd.
- Singamas Container Holdings Ltd.
- BSL Containers Ltd.
- Almar Container Group
- Textainer Group Holdings Ltd.
- Daikin Reefer
- Carrier Transicold Container Refrigeration
- Thermo King Marine
- Klinge Corp.
- Hyundai Translead
- Dong Fang International Container (DFIC)
- Polar Leasing Inc.
- C & C Reefer Services
Additional Benefits:
- The market estimate (ME) sheet in Excel format
- 3 months of analyst support
TABLE OF CONTENTS
1 Introduction
- 1.1 Study Assumptions and Market Definition
- 1.2 Scope of the Study
2 Research Methodology
3 Executive Summary
4 Market Landscape
- 4.1 Market Overview
- 4.2 Market Drivers
- 4.2.1 Growing Trade Relations
- 4.2.2 Increased Demand for Perishable Goods
- 4.2.3 Rising Demand for Temperature-Sensitive Pharmaceuticals
- 4.2.4 Booming Cross-Border E-Grocery and Meal-Kit Subscriptions
- 4.2.5 Shift Toward Protein-Rich Diets in Emerging Asia
- 4.2.6 Climate-Change-Driven Fisheries Relocation
- 4.3 Market Restraints
- 4.3.1 High Cost of Maintaining Reefers
- 4.3.2 Volatile Reefer Freight Rates Linked to Fuel Surcharges
- 4.3.3 Port Congestion-Induced Spoilage Risk
- 4.3.4 Rising Cyber-Attacks on Reefer Telemetry
- 4.4 Value / Supply-Chain Analysis
- 4.5 Regulatory Landscape
- 4.6 Technological Outlook (IoT, AI-based monitoring, natural refrigerants)
- 4.7 Porter's Five Forces Analysis
- 4.7.1 Bargaining Power of Suppliers
- 4.7.2 Bargaining Power of Buyers/Consumers
- 4.7.3 Threat of New Entrants
- 4.7.4 Threat of Substitutes
- 4.7.5 Intensity of Competitive Rivalry
- 4.8 Pricing Analysis
- 4.9 Impact of COVID-19 and Subsequent Supply-Chain Shocks
5 Market Size and Growth Forecasts (Value, USD)
- 5.1 By Transportation Mode
- 5.1.1 Seaways
- 5.1.2 Others
- 5.2 By Container Size
- 5.2.1 Small Containers
- 5.2.2 Large Containers
- 5.2.3 High Cube Containers
- 5.3 By Temperature Range
- 5.3.1 Chilled
- 5.3.2 Frozen
- 5.4 By Application
- 5.4.1 Horticulture (Fresh Fruits and Vegetables)
- 5.4.2 Dairy Products (Milk, Ice-cream, Butter, etc.)
- 5.4.3 Meat, Fish, and Poultry
- 5.4.4 Processed Food Products
- 5.4.5 Pharma and Lifesciences
- 5.4.6 Other Application
- 5.5 By Region
- 5.5.1 North America
- 5.5.1.1 United States
- 5.5.1.2 Canada
- 5.5.1.3 Mexico
- 5.5.2 South America
- 5.5.2.1 Brazil
- 5.5.2.2 Peru
- 5.5.2.3 Chile
- 5.5.2.4 Argentina
- 5.5.2.5 Rest of South America
- 5.5.3 Asia-Pacific
- 5.5.3.1 India
- 5.5.3.2 China
- 5.5.3.3 Japan
- 5.5.3.4 Australia
- 5.5.3.5 South Korea
- 5.5.3.6 South East Asia
- 5.5.3.7 Rest of Asia-Pacific
- 5.5.4 Europe
- 5.5.4.1 United Kingdom
- 5.5.4.2 Germany
- 5.5.4.3 France
- 5.5.4.4 Spain
- 5.5.4.5 Italy
- 5.5.4.6 BENELUX (Belgium, Netherlands, and Luxembourg)
- 5.5.4.7 NORDICS (Denmark, Finland, Iceland, Norway, and Sweden)
- 5.5.4.8 Rest of Europe
- 5.5.5 Middle East and Africa
- 5.5.5.1 United Arab Emirates
- 5.5.5.2 Saudi Arabia
- 5.5.5.3 South Africa
- 5.5.5.4 Egypt
- 5.5.5.5 Rest of Middle East And Africa
- 5.5.1 North America
6 Competitive Landscape
- 6.1 Market Concentration
- 6.2 Strategic Moves (MandA, fleet expansions, green retrofits)
- 6.3 Market Share Analysis
- 6.4 Company Profiles (Includes Global Level Overview, Market Level Overview, Core Segments, Financials as Available, Strategic Information, Market Rank/Share for Key Companies, Products and Services, and Recent Developments)
- 6.4.1 A.P. Moller-Maersk
- 6.4.2 MSC Mediterranean Shipping Co. S.A.
- 6.4.3 CMA CGM Group
- 6.4.4 China International Marine Containers (CIMC) Group
- 6.4.5 Hapag-Lloyd AG
- 6.4.6 Ocean Network Express Pte. Ltd.
- 6.4.7 ZIM Integrated Shipping Services Ltd.
- 6.4.8 Triton International Ltd.
- 6.4.9 Seaco Srl
- 6.4.10 SeaCube Container Leasing Ltd.
- 6.4.11 Singamas Container Holdings Ltd.
- 6.4.12 BSL Containers Ltd.
- 6.4.13 Almar Container Group
- 6.4.14 Textainer Group Holdings Ltd.
- 6.4.15 Daikin Reefer
- 6.4.16 Carrier Transicold Container Refrigeration
- 6.4.17 Thermo King Marine
- 6.4.18 Klinge Corp.
- 6.4.19 Hyundai Translead
- 6.4.20 Dong Fang International Container (DFIC)
- 6.4.21 Polar Leasing Inc.
- 6.4.22 C & C Reefer Services
7 Market Opportunities and Future Outlook
- 7.1 White-space and Unmet-need Assessment

