PUBLISHER: Mordor Intelligence | PRODUCT CODE: 2187210

PUBLISHER: Mordor Intelligence | PRODUCT CODE: 2187210
Beer - Market Share Analysis, Industry Trends & Statistics, Growth Forecasts (2027 - 2032)
According to Mordor Intelligence, the beer market size is expected to grow from USD 0.85 trillion in 2026 to USD 0.89 trillion in 2027 and is forecast to reach USD 1.13 trillion by 2032 at 4.88% CAGR over 2027-2032.
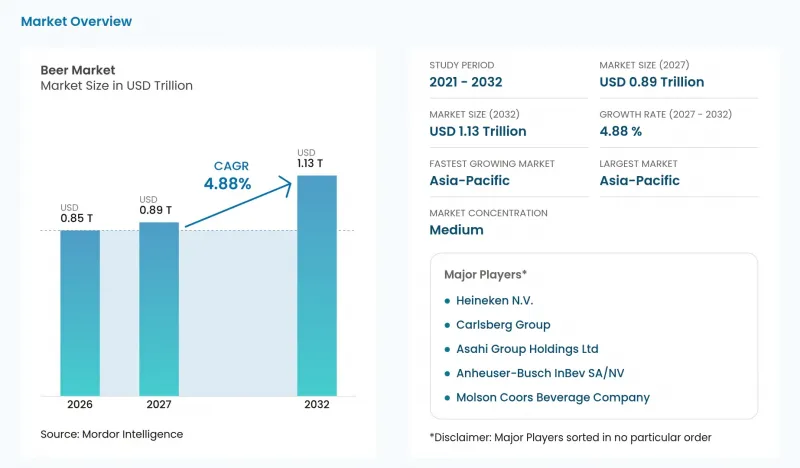
This report is segmented by Product Type (Lager, Ale, and more), Category (Standard and Premium), Packaging Type (Bottles, Cans, and more), Distribution Channel (On-Trade and Off-Trade), and Geography (Asia-Pacific, Europe, North America, Middle East and Africa, and South America). The market forecasts are provided in terms of value (USD), based on availability.
Global Beer Market Trends and Insights
Growing Number of Breweries Leading to High Prevalence of Craft Beer
A broader brewery base creates more potential points of supply for differentiated beer. Brazil recorded 1,954 registered breweries in 2025, the highest number in its historical series. Within craft beer, Aviator Brewing Company opened a new campus in Fuquay-Varina, North Carolina, in April 2025, with a fully automated 60-barrel, 4-vessel brewhouse. A record registration count in Brazil points to a broad supplier base, while Aviator's larger campus shows an established craft brewer adding capacity. For buyers seeking differentiated beer, supplier breadth and expanded craft production can support demand through both choice and availability.
Growing Tourism and Hospitality Impact Positive Growth
Expanding travel activity gives beer suppliers more potential hospitality occasions to address. The World Travel & Tourism Council reported that global travel and tourism GDP grew 4.1% to USD 11.6 trillion in 2025. NielsenIQ's June 2026 report, drawing on its US Hotels Beverage Study 2025, found that 37% of consumers expected to drink beer during US hotel stays over the following 12 months. Wine and cocktails drew expectations of 34% and 30%, respectively, in the same measure. For hotel operators, beer's lead among these alcoholic categories identifies a specific guest occasion around which to develop beverage sales as tourism expands.
Stringent Government Regulations
Statutory charges can constrain beer economics before a brewer changes its production process or commercial offer. From February 1, 2026, the United Kingdom uprated all Alcohol Duty rates by 3.66% in line with Retail Price Index inflation, including rates for non-draught beer and qualifying draught beer. The increase added a tax burden even where a brewer's production process and underlying costs were unchanged. Absorbing that burden reduces the revenue available after duty, while recovering it through price creates a harder affordability proposition for buyers. Including qualifying draught products broadens that pricing trade-off beyond packaged beer, leaving brewers exposed to the statutory increase across both formats.
Other drivers and restraints analyzed in the detailed report include:
- Product Innovation in Terms of Ingredient and Alcohol Content
- Health Conscious Consumer Accelerating Demand For Gluten Free Beer
- Health-Conscious Consumption Trends Limiting Beer Demand
For complete list of drivers and restraints, kindly check the Table Of Contents.
Segment Analysis
Lager was the largest product segment, accounting for 87.08% of global producer beer sales value in 2026. In Brazil, lager accounted for 99.57% of declared beer production volume in 2025. Heineken N.V. announced the opening of its Passos brewery in Brazil on November 6, 2025, with initial capacity of up to 5 million hectoliters annually to serve the Heineken and Amstel brands. The investment targeted a premium brand proposition that includes Heineken lager. With lager making up nearly all declared Brazilian production, a premium proposition built on Heineken lager competes inside lager rather than against another beer type.
Non/low-alcohol beer is the fastest-growing product segment, with a forecast 5.1% CAGR over 2027-2032. Anheuser-Busch InBev SA/NV reported 27% organic revenue growth for its no-alcohol beer portfolio in the second quarter of 2026 versus a year earlier. That gives brand owners a commercial basis for developing revenue around alcohol avoidance within beer. Other beer types provide a separate served-occasion opportunity, with UK on-trade stout value sales increasing 24.4% between 2024 and 2025. These distinct propositions let suppliers pursue beer demand through both alcohol specifications and a particular style's appeal in hospitality settings.
Standard beer represented a 79.24% beer market share in 2026, making it the largest category segment. Carlsberg Group's mainstream core beer accounted for 49% of its total beverage volume in 2025. The company defines core beer as its strong local mainstream brands. Local mainstream brands give a diversified brewer a substantial beer-volume base to defend alongside its soft-drink and other beverage operations.
Premium beer is the fastest-growing category segment, with a forecast 5.2% CAGR over 2027-2032. Carlsberg Group reported 1% organic growth in premium beer volume in the first half of 2026 year on year. China Resources Beer reported over 10% year-on-year volume growth across its combined sub-premium-and-above beer range during the same half. In its 2025 annual report, Carlsberg Breweries Group described premium beer as accretive to revenue per hectoliter and margins. A shift toward that premium portfolio can therefore lift revenue faster than volume, even when its volume growth is modest.
Complete Report Scope:
- By Product Type
- Ale
- Lager
- Non/Low-Alcohol Beer
- Other Beer Types
- By Category
- Standard
- Premium
- By Packaging Type
- Bottles
- Cans
- Others
- By Distribution Channel
- On-Trade
- Off-Trade
- Specialty/Liquor Stores
- Others Off Trade Channels
- By Geography
- North America
- United States
- Canada
- Mexico
- Rest of North America
- Europe
- Germany
- France
- United Kingdom
- Spain
- Netherlands
- Italy
- Rest of Europe
- Asia-Pacific
- China
- India
- Japan
- Australia
- South Korea
- Rest of Asia-Pacific
- South America
- Brazil
- Argentina
- Rest of South America
- Middle East and Africa
- United Arab Emirates
- South Africa
- Saudi Arabia
- Rest of Middle East and Africa
- North America
Geography Analysis
Asia-Pacific held a 30.26% beer market share in 2026 and was the largest and fastest-growing region, with a forecast 5.3% CAGR over 2027-2032. Heineken N.V.'s Asia Pacific business recorded 24.3 million hectoliters of beer volume in the first half of 2026, up 6.6% organically from the first half of 2025. Vietnam, India, and Indonesia led its beer-volume growth, giving the company several national contributors within the region. Heineken's regional net revenue grew 10.5% organically and operating profit rose 17.7% organically in the same half, with Vietnam, Myanmar, and Indonesia contributing strongly to profit, extending its growth case from volume to earnings.
In North America, brewery packaging investment can give established beer brands a platform for further commercial development. In March 2025, FIFCO USA unveiled a USD 28 million can line in Rochester, New York, with reported capacity above 15 million cases annually for beer and other beverage brands. After its September 2026 sale to Saothair Capital Partners, the business announced that it would return to the North American Breweries name. In Europe, the European Union's share of beer consumed in pubs, bars, and restaurants stabilized in 2025 after years of decline. These examples suggest different commercial priorities, with American packaging capability and European venue participation offering distinct ways to earn from established beer demand.
South America's beer opportunities can depend on household purchasing power, as illustrated by Brazil's cyclical demand pressures. Heineken N.V. reported weaker Brazilian beer-category momentum in 2025 as real disposable income declined and subsidies to lower-income households were withdrawn, describing the factors as predominantly cyclical. For brewers in that country, a commercially viable offer needs to fit the resources households can devote to beer while demand is under pressure. In the Middle East and Africa, Heineken reported beer-category expansion in Ethiopia and South Africa in 2025, driven by rising penetration, consumption, and premiumization. The contrast makes affordability during cyclical weakness a different commercial task from expanding participation and higher-tier beer consumption in these African operating markets.
- Heineken N.V.
- Carlsberg Group
- Asahi Group Holdings Ltd
- Molson Coors Beverage Company
- Kirin Holdings Co. Ltd.
- Constellation Brands Inc.
- China Resources Snow Breweries Ltd
- Diageo Plc
- Boston Beer Company Inc.
- Tsingtao Brewery Co. Ltd.
- Anheuser-Busch InBev SA/NV
- Sapporo Holdings Ltd.
- Sierra Nevada Brewing Co.
- Beijing Yanjing Brewery Co., Ltd.
- D.G. Yuengling & Son Inc.
- Thai Beverage Public Company Limited
- B9 Beverages Limited
- Inbrew Beverages Private Limited
- San Miguel Corporation
Additional Benefits:
- The market estimate (ME) sheet in Excel format
- 3 months of analyst support
TABLE OF CONTENTS
1 INTRODUCTION
- 1.1 Study Assumptions and Market Definition
- 1.2 Scope of the Study
2 RESEARCH METHODOLOGY
3 EXECUTIVE SUMMARY
4 MARKET LANDSCAPE
- 4.1 Market Overview
- 4.2 Market Drivers
- 4.2.1 Growing Number of Breweries Leading to High Prevalence of Craft Beer
- 4.2.2 Growing Tourism and Hospitality Impact Positive Growth
- 4.2.3 Product Innovation in Terms of Ingredient and Alcohol Content
- 4.2.4 Health Conscious Consumer Accelerating Demand For Gluten Free Beer
- 4.2.5 Rising Focus on Sustainable and Ethical Beer Production
- 4.2.6 Brewing Industry's Technological Evolution
- 4.3 Market Restraints
- 4.3.1 Stringent Government Regulations
- 4.3.2 Health-Conscious Consumption Trends Limiting Beer Demand
- 4.3.3 Raw Material Cost Inflation and Supply Chain Challenges Impact Beer Production
- 4.3.4 Religious and Cultural Constraints Affecting Beer Market Growth
- 4.4 Industry Value Chain Analysis
- 4.5 Regulatory Landscape
- 4.6 Technological Outlook
- 4.7 Porter's Five Forces Analysis
- 4.7.1 Threat of New Entrants
- 4.7.2 Bargaining Power of Suppliers
- 4.7.3 Bargaining Power of Buyers
- 4.7.4 Threat of Substitutes
- 4.7.5 Competitive Rivalry
- 4.8 Consumer Behavior Analysis
5 MARKET SIZE AND GROWTH FORECASTS (VALUE)
- 5.1 By Product Type
- 5.1.1 Ale
- 5.1.2 Lager
- 5.1.3 Non/Low-Alcohol Beer
- 5.1.4 Other Beer Types
- 5.2 By Category
- 5.2.1 Standard
- 5.2.2 Premium
- 5.3 By Packaging Type
- 5.3.1 Bottles
- 5.3.2 Cans
- 5.3.3 Others
- 5.4 By Distribution Channel
- 5.4.1 On-Trade
- 5.4.2 Off-Trade
- 5.4.2.1 Specialty/Liquor Stores
- 5.4.2.2 Others Off Trade Channels
- 5.5 By Geography
- 5.5.1 North America
- 5.5.1.1 United States
- 5.5.1.2 Canada
- 5.5.1.3 Mexico
- 5.5.1.4 Rest of North America
- 5.5.2 Europe
- 5.5.2.1 Germany
- 5.5.2.2 France
- 5.5.2.3 United Kingdom
- 5.5.2.4 Spain
- 5.5.2.5 Netherlands
- 5.5.2.6 Italy
- 5.5.2.7 Rest of Europe
- 5.5.3 Asia-Pacific
- 5.5.3.1 China
- 5.5.3.2 India
- 5.5.3.3 Japan
- 5.5.3.4 Australia
- 5.5.3.5 South Korea
- 5.5.3.6 Rest of Asia-Pacific
- 5.5.4 South America
- 5.5.4.1 Brazil
- 5.5.4.2 Argentina
- 5.5.4.3 Rest of South America
- 5.5.5 Middle East and Africa
- 5.5.5.1 United Arab Emirates
- 5.5.5.2 South Africa
- 5.5.5.3 Saudi Arabia
- 5.5.5.4 Rest of Middle East and Africa
- 5.5.1 North America
6 COMPETITIVE LANDSCAPE
- 6.1 Market Concentration
- 6.2 Strategic Moves
- 6.3 Market Share Analysis
- 6.4 Company Profiles (includes Global level Overview, Market level overview, Core Segments, Financials as available, Strategic Information, Market Rank/Share for key companies, Products and Services, and Recent Developments)
- 6.4.1 Heineken N.V.
- 6.4.2 Carlsberg Group
- 6.4.3 Asahi Group Holdings Ltd
- 6.4.4 Molson Coors Beverage Company
- 6.4.5 Kirin Holdings Co. Ltd.
- 6.4.6 Constellation Brands Inc.
- 6.4.7 China Resources Snow Breweries Ltd
- 6.4.8 Diageo Plc
- 6.4.9 Boston Beer Company Inc.
- 6.4.10 Tsingtao Brewery Co. Ltd.
- 6.4.11 Anheuser-Busch InBev SA/NV
- 6.4.12 Sapporo Holdings Ltd.
- 6.4.13 Sierra Nevada Brewing Co.
- 6.4.14 Beijing Yanjing Brewery Co., Ltd.
- 6.4.15 D.G. Yuengling & Son Inc.
- 6.4.16 Thai Beverage Public Company Limited
- 6.4.17 B9 Beverages Limited
- 6.4.18 Inbrew Beverages Private Limited
- 6.4.19 San Miguel Corporation
7 MARKET OPPORTUNITIES AND FUTURE OUTLOOK
- 7.1 White-Space and Unmet-Need Assessment

