PUBLISHER: Mordor Intelligence | PRODUCT CODE: 2187250

PUBLISHER: Mordor Intelligence | PRODUCT CODE: 2187250
Renewable Energy - Market Share Analysis, Industry Trends & Statistics, Growth Forecasts (2027 - 2032)
According to Mordor Intelligence, the renewable energy market size is projected to expand from 6.03 Terawatt in 2026 and 6.86 Terawatt in 2027 to 12.9 Terawatt by 2032, registering a CAGR of 13.46% between 2027 and 2032.
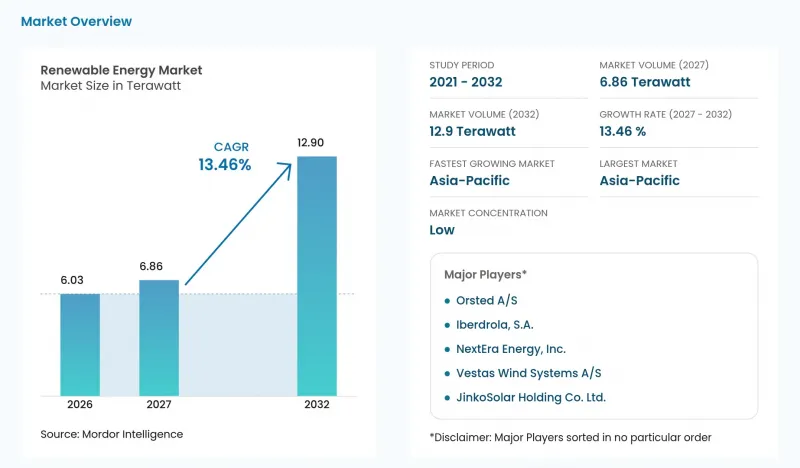
This report is segmented by Technology (Solar Energy, Wind Energy, Hydropower, Bioenergy, Geothermal, and Ocean Energy), End-User (Utilities, Commercial and Industrial, and Residential), and Geography (Asia-Pacific, Europe, North America, South America, and Middle East and Africa). The market forecasts are provided in terms of volume (Terawatt), based on availability.
Global Renewable Energy Market Trends and Insights
Corporate Power-Purchase Agreements Accelerating Utility-scale Builds in North America & Europe
Corporate power-purchase agreements can help developers assemble the contracted revenues needed to finance utility-scale solar projects. Spain recorded more than 2 GW of corporate solar PPAs signed annually from 2023 through 2025. Quinbrook completed the battery financing tranche for the Cleve Hill solar and storage project in Kent, UK, in March 2025. Tesco PLC's offtake covered 65% of solar generation at Cleve Hill, which comprises 373 MW of solar and 150 MW of battery storage. That offtake was among revenue contracts critical to financing, alongside a 15-year solar Contract for Difference and a 15-year battery Capacity Market Agreement. Combining corporate offtake with separate solar and battery revenue contracts can support financing across both assets without treating the corporate PPA as sufficient on its own.
Hyperscale Data-Center Demand Boosting Solar-Wind Procurement in the Nordics & Ireland
Data-center electricity demand offers renewable developers a buyer pool capable of absorbing substantial generation through long-term contracts. Irish data centers consumed 7,663 GWh of metered electricity in 2025, up 10% from 6,973 GWh in 2024. In April 2025, Amazon agreed to buy all electricity from 2 Finnish wind farms under construction, with a combined capacity of 472 MW. OX2 retained ownership under the long-term power-purchase agreement, while Amazon operated data centers in neighboring Sweden. Amazon's purchase of both farms' full output, despite its April 2025 statement that it did not plan a Finnish data center, shows that wind developers can secure offtake from operators with facilities in another country.
Grid Congestion & Curtailment Risks in ERCOT (US) and Inner Mongolia (CN)
Congestion weakens the connection between adding wind capacity and selling the electricity that capacity could generate. In ERCOT, congestion curtailed roughly 4.7% of wind generation in 2025, and Potomac Economics said curtailment had a major impact on wind project economics. CECEP Wind-Power Corporation reported curtailment rates of 7.83% in 2023, 10.56% in 2024 and 13.64% in 2025 for its own Inner Mongolia wind operations. For developers evaluating comparable locations, forgone output reduces the revenue available to support equipment and financing costs. Across CECEP's Inner Mongolia operations, a growing share of potential output went unsold each year.
Other drivers and restraints analyzed in the detailed report include:
- Green-Hydrogen Gigawatt Pipelines Driving Capacity Additions in MENA & Australia
- EU 'REPowerEU' Fast-Track Permitting Cutting Onshore-Wind Lead-Times in Southern Europe
- End-of-Life Blade Waste Regulations Raising Costs in Germany & France
For complete list of drivers and restraints, kindly check the Table Of Contents.
Segment Analysis
Solar energy (PV and CSP) accounted for a 46.42% share of the renewable energy market size in 2026. IRENA reported about 2,391.6 GW of global installed solar energy capacity at year-end 2025, illustrating the largest segment's deployment scale. Solar PV's levelized electricity generation cost held at USD 44/MWh in 2025, equal to its 2024 level. An expanding solar fleet therefore does not guarantee falling generation costs, so the unchanged PV benchmark leaves project economics to support further additions.
Ocean energy (tidal and wave) is the fastest-growing segment, with a forecast CAGR of 35.6% from 2027 to 2032. In February 2026, the UK offered Contracts for Difference to 4 tidal stream projects totaling 20.9 MW, with delivery years of 2028/29 or 2029/30. Those delivery years place potential tidal capacity additions within the forecast period, provided the 4 UK projects move from contract offer to equipment procurement and construction.
Complete Report Scope:
- By Technology
- Solar Energy (PV and CSP)
- Wind Energy (Onshore and Offshore)
- Hydropower (Small, Large, PSH)
- Bioenergy
- Geothermal
- Ocean Energy (Tidal and Wave)
- By End-User
- Utilities
- Commercial and Industrial
- Residential
- By Geography
- North America
- United States
- Canada
- Mexico
- Europe
- United Kingdom
- Germany
- France
- Spain
- Nordic Countries
- Russia
- Rest of Europe
- Asia-Pacific
- China
- India
- Japan
- South Korea
- Malaysia
- Thailand
- Indonesia
- Vietnam
- Australia
- Rest of Asia-Pacific
- South America
- Brazil
- Argentina
- Colombia
- Rest of South America
- Middle East and Africa
- Saudi Arabia
- United Arab Emirates
- South Africa
- Egypt
- Rest of Middle East and Africa
- North America
Geography Analysis
Asia-Pacific held a 58.61% renewable energy market share in 2026 and is the fastest-growing region, with a forecast CAGR of 15.9% from 2027 to 2032. Within that region, Asia added 513.3 GW of renewable capacity in 2025, according to IRENA. Utility-scale geothermal adds another deployment route, illustrated by Energy Development Corporation bringing the Tanawon project in the Philippines into commercial operation in August 2025. By September 29, 2026, India's PM Surya Ghar scheme had enabled approximately 5.01 million rooftop solar installations benefiting 5.95 million households. Household programs such as PM Surya Ghar multiply deployment sites, so installation reach matters alongside equipment volume.
In North America, wind and utility-scale solar supplied 17% of U.S. electricity in 2025, rising to 19% when small-scale solar was included. That additional 2 percentage points gives distributed solar developers a distinct contribution alongside utility-scale generation. Europe's technology mix is illustrated by the EU, where wind supplied 37.5% of renewable electricity in 2025, followed by solar at 27.5% and hydro at 25.9%. Italy's regional authorities conduct the national authorization conference for listed wind projects, giving developers a local approval milestone within an EU renewable generation mix led by wind.
In South America, renewables supplied 86.6% of Brazil's domestic electricity supply in 2025, with hydropower providing 52.2% of that supply, which combines national production and imports. Uruguay requires consumer-site plants generating for self-consumption to register or seek authorization, whether grid-connected or isolated. Within Middle East and Africa, Africa's renewable power capacity grew 15.9% to 82 GW in 2025, driven by Ethiopia, South Africa and Egypt. Middle East renewable capacity grew 28.9% in 2025, led by Saudi Arabia.
- NextEra Energy, Inc.
- Orsted A/S
- Iberdrola, S.A.
- EDF Renewables (EDF S.A.)
- Duke Energy Corporation
- Berkshire Hathaway Energy
- Acciona Energia S.A.
- Engie S.A.
- China Three Gorges Corporation
- Enel Green Power S.p.A.
- Statkraft AS
- Pattern Energy Group
- Invenergy LLC
- RWE Renewables GmbH
- ACWA Power
- EDP Renewables S.A.
- Brookfield Renewable Partners L.P.
- ReNew Energy Global PLC
- Scatec ASA
- First Solar, Inc.
- Vestas Wind Systems A/S
- Siemens Gamesa Renewable Energy S.A.U.
- GE Vernova Inc.
- JinkoSolar Holding Co. Ltd.
- Canadian Solar Inc.
- Longi Green Energy Technology Co., Ltd.
- Goldwind Science & Technology Co., Ltd.
- Trina Solar Co., Ltd.
- Enphase Energy, Inc.
- Sungrow Power Supply Co., Ltd.
- Mitsubishi Power, Ltd.
- Nordex SE
- Vestas Offshore Wind A/S
- Shanghai Electric Group Co., Ltd.
- Hitachi Energy Ltd.
- ABB Ltd.
- Climeon AB
- Pelamis Wave Power Ltd. (in Administration)
- Ocean Power Technologies, Inc.
Additional Benefits:
- The market estimate (ME) sheet in Excel format
- 3 months of analyst support
TABLE OF CONTENTS
1 INTRODUCTION
- 1.1 Study Assumptions and Market Definition
- 1.2 Scope of the Study
2 RESEARCH METHODOLOGY
3 EXECUTIVE SUMMARY
4 MARKET LANDSCAPE
- 4.1 Market Overview
- 4.2 Market Drivers
- 4.2.1 Corporate Power-Purchase Agreements Accelerating Utility-scale Builds in North America & Europe
- 4.2.2 Hyperscale Data-Center Demand Boosting Solar-Wind Procurement in the Nordics & Ireland
- 4.2.3 Green-Hydrogen Gigawatt Pipelines Driving Capacity Additions in MENA & Australia
- 4.2.4 EU 'REPowerEU' Fast-Track Permitting Cutting Onshore-Wind Lead-Times in Southern Europe
- 4.3 Market Restraints
- 4.3.1 Grid Congestion & Curtailment Risks in ERCOT (US) and Inner Mongolia (CN)
- 4.3.2 End-of-Life Blade Waste Regulations Raising Costs in Germany & France
- 4.3.3 Lack of Long-Duration Storage Slowing High VRE Penetration in SE-Asia
- 4.3.4 Local-Content Mandates Inflating Offshore-Wind CAPEX in India & Brazil
- 4.4 Industry Value Chain Analysis
- 4.5 Regulatory Landscape
- 4.6 Technological Outlook
- 4.7 Porter's Five Forces Analysis
- 4.7.1 Threat of New Entrants
- 4.7.2 Bargaining Power of Suppliers
- 4.7.3 Bargaining Power of Buyers
- 4.7.4 Threat of Substitutes
- 4.7.5 Competitive Rivalry
- 4.8 Renewable Energy Mix, 2024
5 MARKET SIZE AND GROWTH FORECASTS (VOLUME)
- 5.1 By Technology
- 5.1.1 Solar Energy (PV and CSP)
- 5.1.2 Wind Energy (Onshore and Offshore)
- 5.1.3 Hydropower (Small, Large, PSH)
- 5.1.4 Bioenergy
- 5.1.5 Geothermal
- 5.1.6 Ocean Energy (Tidal and Wave)
- 5.2 By End-User
- 5.2.1 Utilities
- 5.2.2 Commercial and Industrial
- 5.2.3 Residential
- 5.3 By Geography
- 5.3.1 North America
- 5.3.1.1 United States
- 5.3.1.2 Canada
- 5.3.1.3 Mexico
- 5.3.2 Europe
- 5.3.2.1 United Kingdom
- 5.3.2.2 Germany
- 5.3.2.3 France
- 5.3.2.4 Spain
- 5.3.2.5 Nordic Countries
- 5.3.2.6 Russia
- 5.3.2.7 Rest of Europe
- 5.3.3 Asia-Pacific
- 5.3.3.1 China
- 5.3.3.2 India
- 5.3.3.3 Japan
- 5.3.3.4 South Korea
- 5.3.3.5 Malaysia
- 5.3.3.6 Thailand
- 5.3.3.7 Indonesia
- 5.3.3.8 Vietnam
- 5.3.3.9 Australia
- 5.3.3.10 Rest of Asia-Pacific
- 5.3.4 South America
- 5.3.4.1 Brazil
- 5.3.4.2 Argentina
- 5.3.4.3 Colombia
- 5.3.4.4 Rest of South America
- 5.3.5 Middle East and Africa
- 5.3.5.1 Saudi Arabia
- 5.3.5.2 United Arab Emirates
- 5.3.5.3 South Africa
- 5.3.5.4 Egypt
- 5.3.5.5 Rest of Middle East and Africa
- 5.3.1 North America
6 COMPETITIVE LANDSCAPE
- 6.1 Market Concentration
- 6.2 Strategic Moves
- 6.3 Market Share Analysis
- 6.4 Company Profiles (includes Global level Overview, Market level overview, Core Segments, Financials as available, Strategic Information, Market Rank/Share for key companies, Products and Services, and Recent Developments)
- 6.4.1 NextEra Energy, Inc.
- 6.4.2 Orsted A/S
- 6.4.3 Iberdrola, S.A.
- 6.4.4 EDF Renewables (EDF S.A.)
- 6.4.5 Duke Energy Corporation
- 6.4.6 Berkshire Hathaway Energy
- 6.4.7 Acciona Energia S.A.
- 6.4.8 Engie S.A.
- 6.4.9 China Three Gorges Corporation
- 6.4.10 Enel Green Power S.p.A.
- 6.4.11 Statkraft AS
- 6.4.12 Pattern Energy Group
- 6.4.13 Invenergy LLC
- 6.4.14 RWE Renewables GmbH
- 6.4.15 ACWA Power
- 6.4.16 EDP Renewables S.A.
- 6.4.17 Brookfield Renewable Partners L.P.
- 6.4.18 ReNew Energy Global PLC
- 6.4.19 Scatec ASA
- 6.4.20 First Solar, Inc.
- 6.4.21 Vestas Wind Systems A/S
- 6.4.22 Siemens Gamesa Renewable Energy S.A.U.
- 6.4.23 GE Vernova Inc.
- 6.4.24 JinkoSolar Holding Co. Ltd.
- 6.4.25 Canadian Solar Inc.
- 6.4.26 Longi Green Energy Technology Co., Ltd.
- 6.4.27 Goldwind Science & Technology Co., Ltd.
- 6.4.28 Trina Solar Co., Ltd.
- 6.4.29 Enphase Energy, Inc.
- 6.4.30 Sungrow Power Supply Co., Ltd.
- 6.4.31 Mitsubishi Power, Ltd.
- 6.4.32 Nordex SE
- 6.4.33 Vestas Offshore Wind A/S
- 6.4.34 Shanghai Electric Group Co., Ltd.
- 6.4.35 Hitachi Energy Ltd.
- 6.4.36 ABB Ltd.
- 6.4.37 Climeon AB
- 6.4.38 Pelamis Wave Power Ltd. (in Administration)
- 6.4.39 Ocean Power Technologies, Inc.
7 MARKET OPPORTUNITIES AND FUTURE OUTLOOK
- 7.1 White-Space and Unmet-Need Assessment

