PUBLISHER: Mordor Intelligence | PRODUCT CODE: 2187421

PUBLISHER: Mordor Intelligence | PRODUCT CODE: 2187421
Maritime Freight Transport - Market Share Analysis, Industry Trends & Statistics, Growth Forecasts (2027 - 2032)
According to Mordor Intelligence, the maritime freight transport market size is projected to expand from USD 632.4 billion in 2026 and USD 666.7 billion in 2027 to USD 855.8 billion by 2032, registering a CAGR of 5.12% between 2027 and 2032.
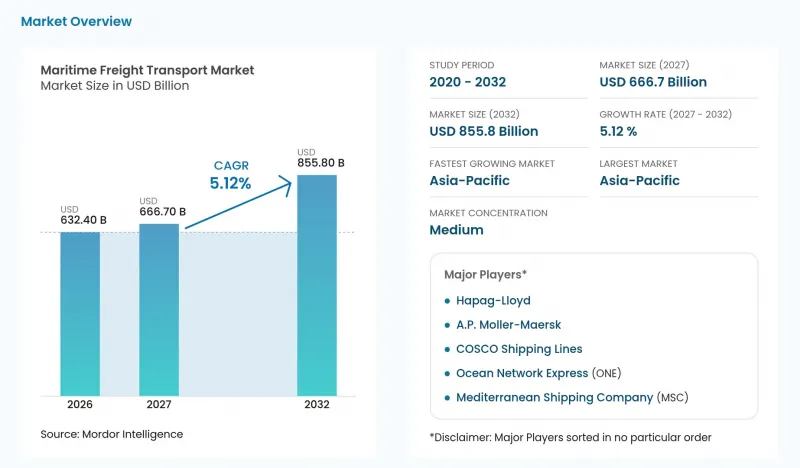
This report is segmented by Cargo Type (Dry Bulk Cargo, Containerized Cargo, and more), End-User Industry (Others, Chemicals & Petrochemicals, and more), and Geography (Asia-Pacific, Europe, and more). The market forecasts are provided in terms of value (USD), based on availability.
Global Maritime Freight Transport Market Trends and Insights
Surge in South-South intra-Asian trade corridors
Regional cargo growth supports shipping networks designed around connections within Asia rather than intercontinental exports alone. Container Trades Statistics Ltd reported that Intra-Far East container trade rose 5% year on year in 2025, becoming the largest lane at more than twice the size of Far East to North America. MSC's SAMBAR service made its maiden call at DaChan Bay on November 14, 2025. It deployed 6 vessels, each with nominal capacity of 4,000 to 5,000 twenty-foot equivalent units (TEUs), on direct connections from China to Vietnam, Thailand, Malaysia and Singapore. The multi-country route gives exporters access to several Southeast Asian destinations within one carrier service. MSC's standalone rotation links more than 10 ports across China, Southeast Asia and South Korea, so vessel employment can draw on several country pairs within the same loop.
Near-shoring drives short-sea feeder demand
Regional manufacturing can support maritime links when nearby production centers depend on ports for their material flows. In February 2025, Ternium reported that its Brownsville port volume had grown more than 400% over the preceding 5 years. The port received, stored and shipped steel slabs processed at Ternium's Pesqueria industrial center in Mexico. Separately, in 2025, Tuxpan Port Terminal began handling containers for Green Tide Logistics' maritime route between Tuxpan, Mexico, and Philadelphia. Where production moves closer to customers, an available regional sea route can offer a transport option for factory-linked cargo. Near-shoring therefore adds sea demand mainly where cargo moves port to port, as with slabs handled at Brownsville and containers handled at Tuxpan, rather than wherever plants relocate.
Chronic port-side infrastructure bottlenecks
Scarce terminal capacity can limit a hub's ability to retain maritime connections even when cargo is available. In the first half of 2026, Rotterdam's container transshipment volume fell 20% because capacity was lacking. The loss illustrates how a port-side constraint can displace connecting freight rather than reflect a shortage of goods needing transport. For carriers using such a hub, adding vessel space alone would not resolve the shore-side limit on handling that cargo. In August 2026, Rotterdam World Gateway accelerated its ongoing Maasvlakte 2 expansion, planning a fourth deep-sea berth and additional capacity before 2030. If handling space is insufficient during construction, connecting services can lose business before the new terminal capacity is available.
Other drivers and restraints analyzed in the detailed report include:
- EU ETS on maritime emissions reshapes fleet economics
- Digital freight platforms enable real-time capacity matching
- Oversupply risk from record container-ship orderbook
For complete list of drivers and restraints, kindly check the Table Of Contents.
Segment Analysis
Dry bulk cargo accounted for a 28.59% share of the maritime freight transport market size in 2026. Within this largest segment, average Capesize spot earnings rose 70% year over year to more than USD 28,000 per day in the first half of 2026. Atlantic exports of iron ore and bauxite on long-haul routes to Asia were particularly supportive. These iron ore and bauxite flows can sustain long-distance Capesize employment across more than one commodity stream. Longer Atlantic-to-Asia voyages require more vessel days per cargo, so a given export volume can sustain more demand for Capesize tonnage.
Liquid bulk cargo is the fastest-growing segment, with a projected CAGR of 5.2% between 2027 and 2032. PETRONAS reported gross liquefied natural gas (LNG) sales of 20.29 million metric tons in the first half of 2026, up 17% from 17.34 million metric tons in the first half of 2025. It also delivered 282 LNG cargoes to key markets from its global portfolio in the first half of 2026. Delivering 282 cargoes in 6 months implies repeated LNG carrier loadings, creating a recurring need for vessel employment beyond a single lifting.
Complete Report Scope:
- By Cargo Type
- Containerized Cargo
- Dry
- Reefer
- Dry Bulk Cargo
- Liquid Bulk Cargo
- General Cargo
- Roll-On/Roll-Off Cargo
- Containerized Cargo
- By End-User Industry
- Electronics & Semiconductors
- Chemicals & Petrochemicals
- Food & Beverage
- Pharmaceuticals & Healthcare
- Retail & E-commerce
- Others
- By Geography
- North America
- United States
- Canada
- Mexico
- South America
- Brazil
- Peru
- Chile
- Argentina
- Rest of South America
- Asia-Pacific
- India
- China
- Japan
- Australia
- South Korea
- South East Asia (Singapore, Malaysia, Thailand, Indonesia, Vietnam, and Philippines)
- Rest of Asia-Pacific
- Europe
- United Kingdom
- Germany
- France
- Spain
- Italy
- BENELUX (Belgium, Netherlands, and Luxembourg)
- NORDICS (Denmark, Finland, Iceland, Norway, and Sweden)
- Rest of Europe
- Middle East and Africa
- UAE
- Saudi Arabia
- South Africa
- Nigeria
- Rest of Middle East And Africa
- North America
Geography Analysis
Asia-Pacific accounted for 37.82% of the maritime freight transport market size in 2026 and is the fastest-growing region, with a projected CAGR of 5.55% between 2027 and 2032. China's ports handled 354 million twenty-foot equivalent units (TEUs) of containers in 2025, up 6.8% from 2024, while Singapore recorded 44.66 million TEUs of container throughput, up 8.6% over the same period. In 2025, Taiwan's international commercial ports handled mainly import-export cargo, which was 83.92% of total cargo throughput. Higher container handling in China and Singapore therefore provides a multi-country operating base for Asia-Pacific freight growth.
Within North America, through September 2026, Los Angeles handled 8.08 million TEUs of loaded and empty containers, up 3.38% from the comparable 2025 period. Within South America, Brazil's Port of Santos handled 36.5 million metric tons of soybean grain and meal and 12.1 million metric tons of sugar in January-July 2026, up 6.7% and 5.3% year over year, respectively. Corn and pulp throughput fell 31.3% and 10.9% to 1.74 million and 4.95 million metric tons, respectively, over the same period. Elsewhere in South America, Colombia's containerized agro-industrial trade in 2025 was led by banana exports, mainly to the United States and Europe, while Buenaventura was a principal import entry point for the sector. A gateway's aggregate activity therefore gives carriers less guidance for vessel deployment than the equipment and commodity flows they expect to handle.
Within Europe, Ireland's Dublin Port handled 6.65 million metric tons in the second quarter of 2026, representing 49% of goods tonnage handled across Ireland's 8 main ports. That concentration makes Dublin a consequential access point for carriers pursuing that national cargo base. Within Middle East and Africa, Mombasa in Kenya handled 8.34 million metric tons of transit cargo in January-June 2026, up 13% year over year, with Uganda accounting for 71% of transit throughput. Uganda's importance makes inland transit reach central to Mombasa's freight proposition, linking an ocean gateway's opportunity to a destination outside its coastal host country.
- Mediterranean Shipping Company (MSC)
- A.P. Moller-Maersk
- COSCO Shipping Lines
- Hapag-Lloyd
- Ocean Network Express (ONE)
- Evergreen Marine Corp.
- HMM Co., Ltd.
- Yang Ming Marine Transport
- ZIM Integrated Shipping
- Pacific International Lines (PIL)
- SITC International
- X-Press Feeders
- Matson Inc.
- Swire Shipping
- NYK Line
- K Line
- MOL Logistics
- CMA CGM
- Wan Hai Lines
- Emirates Shipping Line
Additional Benefits:
- The market estimate (ME) sheet in Excel format
- 3 months of analyst support
TABLE OF CONTENTS
1 INTRODUCTION
- 1.1 Study Assumptions and Market Definition
- 1.2 Scope of the Study
2 RESEARCH METHODOLOGY
3 EXECUTIVE SUMMARY
4 MARKET LANDSCAPE
- 4.1 Market Overview
- 4.2 Market Drivers
- 4.2.1 Surge in South-South intra-Asian trade corridors
- 4.2.2 Near-shoring drives short-sea feeder demand
- 4.2.3 EU ETS on maritime emissions reshapes fleet economics
- 4.2.4 Digital freight platforms enable real-time capacity matching
- 4.2.5 Alternative fuels adoption can lower long-term emissions-compliance OPEX
- 4.2.6 Suez diversions & Panama Canal restrictions can boost ton-miles
- 4.3 Market Restraints
- 4.3.1 Chronic port-side infrastructure bottlenecks
- 4.3.2 Oversupply risk from record container-ship orderbook
- 4.3.3 Escalating maritime cyber-security threats
- 4.3.4 Inflation-driven bunker price volatility
- 4.4 Industry Value Chain Analysis
- 4.5 Regulatory Landscape
- 4.6 Technological Outlook
- 4.7 Porter's Five Forces Analysis
- 4.7.1 Threat of New Entrants
- 4.7.2 Bargaining Power of Suppliers
- 4.7.3 Bargaining Power of Buyers
- 4.7.4 Threat of Substitutes
- 4.7.5 Competitive Rivalry
- 4.8 Impact of COVID-19 and Geo-Political Events
5 MARKET SIZE AND GROWTH FORECASTS (VALUE)
- 5.1 By Cargo Type
- 5.1.1 Containerized Cargo
- 5.1.1.1 Dry
- 5.1.1.2 Reefer
- 5.1.2 Dry Bulk Cargo
- 5.1.3 Liquid Bulk Cargo
- 5.1.4 General Cargo
- 5.1.5 Roll-On/Roll-Off Cargo
- 5.1.1 Containerized Cargo
- 5.2 By End-User Industry
- 5.2.1 Electronics & Semiconductors
- 5.2.2 Chemicals & Petrochemicals
- 5.2.3 Food & Beverage
- 5.2.4 Pharmaceuticals & Healthcare
- 5.2.5 Retail & E-commerce
- 5.2.6 Others
- 5.3 By Geography
- 5.3.1 North America
- 5.3.1.1 United States
- 5.3.1.2 Canada
- 5.3.1.3 Mexico
- 5.3.2 South America
- 5.3.2.1 Brazil
- 5.3.2.2 Peru
- 5.3.2.3 Chile
- 5.3.2.4 Argentina
- 5.3.2.5 Rest of South America
- 5.3.3 Asia-Pacific
- 5.3.3.1 India
- 5.3.3.2 China
- 5.3.3.3 Japan
- 5.3.3.4 Australia
- 5.3.3.5 South Korea
- 5.3.3.6 South East Asia (Singapore, Malaysia, Thailand, Indonesia, Vietnam, and Philippines)
- 5.3.3.7 Rest of Asia-Pacific
- 5.3.4 Europe
- 5.3.4.1 United Kingdom
- 5.3.4.2 Germany
- 5.3.4.3 France
- 5.3.4.4 Spain
- 5.3.4.5 Italy
- 5.3.4.6 BENELUX (Belgium, Netherlands, and Luxembourg)
- 5.3.4.7 NORDICS (Denmark, Finland, Iceland, Norway, and Sweden)
- 5.3.4.8 Rest of Europe
- 5.3.5 Middle East and Africa
- 5.3.5.1 UAE
- 5.3.5.2 Saudi Arabia
- 5.3.5.3 South Africa
- 5.3.5.4 Nigeria
- 5.3.5.5 Rest of Middle East And Africa
- 5.3.1 North America
6 COMPETITIVE LANDSCAPE
- 6.1 Market Concentration
- 6.2 Strategic Moves
- 6.3 Market Share Analysis
- 6.4 Company Profiles (includes Global level Overview, Market level overview, Core Segments, Financials as available, Strategic Information, Market Rank/Share for key companies, Products and Services, and Recent Developments)
- 6.4.1 Mediterranean Shipping Company (MSC)
- 6.4.2 A.P. Moller-Maersk
- 6.4.3 COSCO Shipping Lines
- 6.4.4 Hapag-Lloyd
- 6.4.5 Ocean Network Express (ONE)
- 6.4.6 Evergreen Marine Corp.
- 6.4.7 HMM Co., Ltd.
- 6.4.8 Yang Ming Marine Transport
- 6.4.9 ZIM Integrated Shipping
- 6.4.10 Pacific International Lines (PIL)
- 6.4.11 SITC International
- 6.4.12 X-Press Feeders
- 6.4.13 Matson Inc.
- 6.4.14 Swire Shipping
- 6.4.15 NYK Line
- 6.4.16 K Line
- 6.4.17 MOL Logistics
- 6.4.18 CMA CGM
- 6.4.19 Wan Hai Lines
- 6.4.20 Emirates Shipping Line
7 MARKET OPPORTUNITIES AND FUTURE OUTLOOK
- 7.1 White-Space and Unmet-Need Assessment

