
Need help finding what you are looking for?
Contact Us
PUBLISHER: Mordor Intelligence | PRODUCT CODE: 1693659

PUBLISHER: Mordor Intelligence | PRODUCT CODE: 1693659
Electric Bus - Market Share Analysis, Industry Trends & Statistics, Growth Forecasts (2025 - 2030)
PUBLISHED:
PAGES: 360 Pages
DELIVERY TIME: 2-3 business days
SELECT AN OPTION
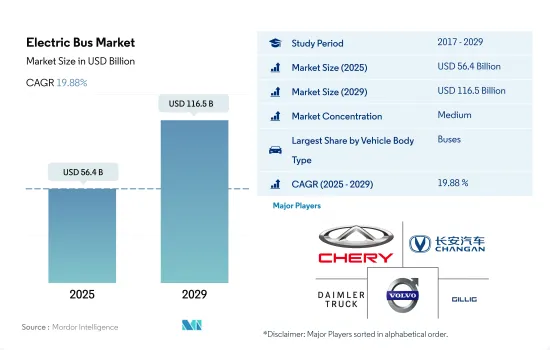
The Electric Bus Market size is estimated at 56.4 billion USD in 2025, and is expected to reach 116.5 billion USD by 2029, growing at a CAGR of 19.88% during the forecast period (2025-2029).
The global demand for electric buses is experiencing significant growth due to environmental concerns, rising fuel costs, and stringent green vehicle regulations
- The global demand for electric buses has surged significantly in recent years. This uptick can be attributed to mounting environmental concerns stemming from carbon emissions, escalating fuel costs, the burden of high operational expenses, and the imposition of stringent green vehicle regulations by governments worldwide. Consequently, the global demand for electric buses saw a notable increase in 2022 compared to 2021.
- Public transit agencies in several nations are actively championing the adoption of electric buses. For instance, the Bangalore Metropolitan Transport Corporation (BMTC), India's largest public transit bus operator, has unveiled ambitious plans for battery electric buses. It has committed to procuring up to 1,800 electric buses in the coming years, while the Karnataka state government aims to transition BMTC's entire fleet of 6,500 buses to zero-emission vehicles by 2030. Such initiatives are poised to bolster the global demand and sales of electric buses.
- Government bodies worldwide are increasingly embracing electric buses. In the United States, the trend is evident as more cities and universities are incorporating electric bus fleets. Notably, California emerged as a frontrunner in this transition, introducing the Innovative Clean Transit Rule (ICTR). This rule mandates that 25% of new bus purchases be zero-emission buses, with a subsequent target of 100% zero-emission orders from California transport agencies by 2029. California aims to electrify its entire fleet of 12,000 city buses by 2040. Similar endeavors in other nations are poised to fuel the demand for electric buses from 2024 to 2030.
Global Electric Bus Market Trends
The rising global demand and government support propel electric vehicle market growth
- Electric vehicles (EVs) have become indispensable in the automotive industry, driven by their potential to enhance energy efficiency and reduce greenhouse gas and pollution emissions. This surge is primarily attributed to growing environmental concerns and supportive government initiatives. Notably, global EV sales witnessed a robust 10.82% growth in 2022 compared to 2021. Projections indicate that annual sales of electric passenger cars will surpass 5 million by the end of 2025, accounting for approximately 15% of total vehicle sales.
- Leading manufacturers and organizations, like the London Metropolitan Police & Fire Service, have been actively pursuing their electric mobility strategies. For instance, they have set a target of a zero-emission fleet by 2025, with a goal of electrifying 40% of their vans by 2030 and achieving full electrification by 2040. Similar trends are expected globally, with the period from 2024 to 2030 witnessing a surge in demand and sales of electric vehicles.
- Asia-Pacific and Europe are poised to dominate electric vehicle production, driven by their advancements in battery technology and vehicle electrification. In May 2020, Kia Motors Europe unveiled its "Plan S," signaling a strategic shift toward electrification. This decision came on the heels of record-breaking sales of Kia's EVs in Europe. Kia has ambitious plans to introduce 11 EV models globally by 2025, spanning various segments like passenger vehicles, SUVs, and MPVs. The company aims to achieve annual global EV sales of 500,000 by 2026.
Electric Bus Industry Overview
The Electric Bus Market is moderately consolidated, with the top five companies occupying 48.55%. The major players in this market are Chery Automobile Co. Ltd., Chongqing Changan Automobile Company Limited, Daimler Truck Holding AG, Volvo Group and Zhejiang Geely Holding Group Co. Ltd (sorted alphabetically).
Additional Benefits:
- The market estimate (ME) sheet in Excel format
- 3 months of analyst support
Product Code: 93052
TABLE OF CONTENTS
1 EXECUTIVE SUMMARY & KEY FINDINGS
2 REPORT OFFERS
3 INTRODUCTION
- 3.1 Study Assumptions & Market Definition
- 3.2 Scope of the Study
- 3.3 Research Methodology
4 KEY INDUSTRY TRENDS
- 4.1 Population
- 4.1.1 Africa
- 4.1.2 Asia-Pacific
- 4.1.3 Europe
- 4.1.4 Middle East
- 4.1.5 North America
- 4.1.6 South America
- 4.2 GDP Per Capita
- 4.2.1 Africa
- 4.2.2 Asia-Pacific
- 4.2.3 Europe
- 4.2.4 Middle East
- 4.2.5 North America
- 4.2.6 South America
- 4.3 Consumer Spending For Vehicle Purchase (cvp)
- 4.3.1 Africa
- 4.3.2 Asia-Pacific
- 4.3.3 Europe
- 4.3.4 Middle East
- 4.3.5 North America
- 4.3.6 South America
- 4.4 Inflation
- 4.4.1 Africa
- 4.4.2 Asia-Pacific
- 4.4.3 Europe
- 4.4.4 Middle East
- 4.4.5 North America
- 4.4.6 South America
- 4.5 Interest Rate For Auto Loans
- 4.6 Shared Rides
- 4.7 Shared Rides
- 4.8 Impact Of Electrification
- 4.9 EV Charging Station
- 4.10 Battery Pack Price
- 4.10.1 Africa
- 4.10.2 Asia-Pacific
- 4.10.3 Europe
- 4.10.4 Middle East
- 4.10.5 North America
- 4.10.6 South America
- 4.11 New Xev Models Announced
- 4.12 Fuel Price
- 4.13 Oem-wise Production Statistics
- 4.14 Regulatory Framework
- 4.15 Value Chain & Distribution Channel Analysis
5 MARKET SEGMENTATION (includes market size in Value in USD and Volume, Forecasts up to 2029 and analysis of growth prospects)
- 5.1 Fuel Category
- 5.1.1 BEV
- 5.1.2 FCEV
- 5.1.3 HEV
- 5.1.4 PHEV
- 5.2 Region
- 5.2.1 Africa
- 5.2.1.1 South Africa
- 5.2.2 Asia-Pacific
- 5.2.2.1 China
- 5.2.2.2 India
- 5.2.2.3 Japan
- 5.2.2.4 South Korea
- 5.2.3 Europe
- 5.2.3.1 France
- 5.2.3.2 Germany
- 5.2.3.3 Italy
- 5.2.3.4 Spain
- 5.2.3.5 UK
- 5.2.3.6 Rest-of-Europe
- 5.2.4 Middle East
- 5.2.4.1 UAE
- 5.2.4.2 Rest-of-Middle East
- 5.2.5 North America
- 5.2.5.1 Canada
- 5.2.5.2 Mexico
- 5.2.5.3 US
- 5.2.6 South America
- 5.2.6.1 Argentina
- 5.2.6.2 Brazil
- 5.2.6.3 Rest-of-South America
- 5.2.1 Africa
6 COMPETITIVE LANDSCAPE
- 6.1 Key Strategic Moves
- 6.2 Market Share Analysis
- 6.3 Company Landscape
- 6.4 Company Profiles
- 6.4.1 Anhui Ankai Automobile Co. Ltd.
- 6.4.2 Ashok Leyland Limited
- 6.4.3 Byd Auto Industry Company Limited
- 6.4.4 Chery Automobile Co. Ltd.
- 6.4.5 Chongqing Changan Automobile Company Limited
- 6.4.6 CRRC Electric Vehicle Co. Ltd.
- 6.4.7 Daimler Truck Holding AG
- 6.4.8 King Long United Automotive Industry Co. Ltd.
- 6.4.9 NFI Group Inc.
- 6.4.10 Proterra INC.
- 6.4.11 Tata Motors Limited
- 6.4.12 Volvo Group
- 6.4.13 Zhejiang Geely Holding Group Co. Ltd
- 6.4.14 Zhengzhou Yutong Bus Co. Ltd.
- 6.4.15 Zhongtong Bus Holding Co. Ltd.
7 KEY STRATEGIC QUESTIONS FOR VEHICLES CEOS
8 APPENDIX
- 8.1 Global Overview
- 8.1.1 Overview
- 8.1.2 Porter's Five Forces Framework
- 8.1.3 Global Value Chain Analysis
- 8.1.4 Market Dynamics (DROs)
- 8.2 Sources & References
- 8.3 List of Tables & Figures
- 8.4 Primary Insights
- 8.5 Data Pack
- 8.6 Glossary of Terms
Have a question?


SELECT AN OPTION
Have a question?
Questions? Please give us a call or visit the contact form.