
PUBLISHER: MTN Consulting, LLC | PRODUCT CODE: 1172495

PUBLISHER: MTN Consulting, LLC | PRODUCT CODE: 1172495
Carrier-neutral Growth Slows in 2022 Amid Consolidation: Market Approaches $100B in Annual Revenues, Still Central to Operator Industry Health, But Not Immune to Economic Pressures, Private Equity Players Ramp Up
This short note provides a brief review of the development of the carrier-neutral network operator (CNNO) market through the third quarter of 2022 (3Q22).
VISUALS
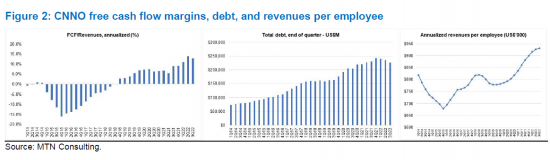
CNNO revenues were approximately $23.9 billion (B) in 3Q22, up 3% YoY, and $94.8B for the annualized 3Q22 period (4Q21-3Q22), up 6% YoY. These growth rates are significantly less than the 12.5% growth seen in CY2021 and the average growth over the 2011-21 period of 16.6% per year. That's despite the acquisition spree the sector observed in 2021, when M&A spend of $42.1B easily outpaced capex of $31.4B. This M&A and capex spending have expanded the asset base of the sector, but not helped much with revenue growth, yet. Companies point to longer sales cycles, pressure to renegotiate leases, increased price competition as the market matures, and appreciation of the US dollar among the factors keeping a check on revenue growth. However, there are signs that the CNNO sector is becoming more profitable: average free cash flow margin has been in the 11-14% range for the last three quarters, while it was negative for most of the 2011-21 period. Debt remains high, totaling $225B in 3Q22, only slightly down from 3Q21; with higher interest rates, CNNOs are reluctant to take on more debt, instead focusing on margin growth. CNNOs will continue to build out their networks to improve network economics, keep more traffic on-net, provide key customers more of an end-to-end service, and cross sell across infrastructure types.
Private equity firms continue to invest heavily in the sector, and many have "digital infrastructure" funds aiming to combine assets across the three main infrastructure classes: towers, data centers, and fiber. As we argued in a July 2021 report, we continue to expect that "A new breed of integrated owners of infrastructure network assets will emerge over the next 2-3 years, converging towers, data centers, and fiber networks." PE firms' capital inflows are pushing this integration. A large group of well-funded PE firms are pursuing digital infrastructure opportunities. Some are explicitly aiming to assemble portfolios of integrated assets, and/or cobble them together into larger CNNOs able to address multi-sector opportunities from a position of massive scale. Ultimately most PEs do aim for liquidity events from these past investments, though some are content with the relatively steady cash flows spun off by CNNOs.
We will be formally updating our operator forecast soon. This update will include revised projections for the market, incorporating actual market data as reported through 3Q22.
Companies Mentioned:
|
|
Table of Contents
- Summary
- Measurement a unique challenge in carrier-neutral market
- Top line market growth
- Overview of key companies
- Capex likely to exceed M&A in next 2 years, and tech component will rise
- Integrated business models also to pick up, with boost from PE sector
- Appendix
List of Figures and Tables
- Figure 1: CNNO revenues, capex and M&A spending, annualized, 1Q14-3Q22
- Figure 2: CNNO free cash flow margins, debt, and revenues per employee
- Table 1: Overview of key CNNOs - recent financial metrics and M&A activity

