
PUBLISHER: Roots Analysis | PRODUCT CODE: 1648563

PUBLISHER: Roots Analysis | PRODUCT CODE: 1648563
Digital Biomanufacturing Market by Type of Technology, Deployment Options, Type of Biologic Manufactured, and Key Geographical Regions : Industry Trends and Global Forecasts, Till 2035
DIGITAL BIOMANUFACTURING MARKET: OVERVIEW
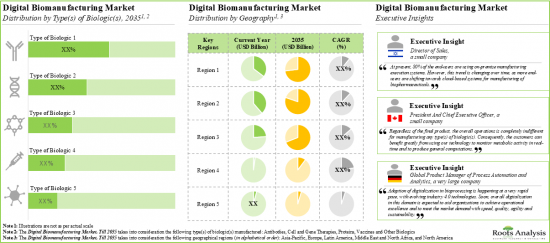
As per Roots Analysis, the global digital biomanufacturing market is estimated to grow from USD 2 billion in the current year to USD 12.3 billion by 2035, at a CAGR of 17.9% during the forecast period, till 2035.
The market sizing and opportunity analysis has been segmented across the following parameters:
Type of Technology
- Process Analytical Technology (PAT)
- Data Analysis Software (DAS)
- Manufacturing Execution Systems (MES)
- Digital Twins
Deployment Options
- Cloud-based
- On-premises
Type(s) of Biologic(s)Manufactured
- Antibodies
- Cell and Gene Therapies
- Proteins
- Vaccines
- Others
Key Geographical Regions
- North America
- Europe
- Asia-Pacific
- Latin America
- Middle East and North Africa
DIGITAL BIOMANUFACTURING MARKET: GROWTH AND TRENDS
Digital biomanufacturing employs various digital software and platforms, such as process analytical technology (PAT), data analysis software (DAS), manufacturing execution system (MES) and digital twin, to facilitate improvement in the overall biomanufacturing process. It has been demonstrated that the use of digital biomanufacturing approaches can boost the productivity of procedures and the longevity of existing infrastructure. The modernization of the biomanufacturing process has been more visible and successful due to advancements in data analytics and data science. Innovative technologies, such as AI and digital twins, have become an integral part of biopharmaceutical companies' strategy to future-proof their business operations and address various issues, including growing expenses, stringent regulatory guidelines and deteriorating profit margins.
Considering the current market trends and innovation, it is anticipated that the next generation of machine learning technologies will be integrated with advanced data analytics, and process and equipment modeling to form comprehensive systems, for the purpose of real-time monitoring and predictive analysis. Driven by the increasing number of biologics approved, consequent growth in the number of biologics-focused clinical trials, rise in R&D activity and rising popularity of cloud and IoT based process technologies, the digital biomanufacturing industry is expected to witness steady growth over the coming years.
DIGITAL BIOMANUFACTURING MARKET: KEY INSIGHTS
The report delves into the current state of the digital biomanufacturing market and identifies potential growth opportunities within the industry. Some key findings from the report include:
- Currently, over 100 firms claim to offer a variety of novel digital biomanufacturing solutions in order to cater to the rising demand for biopharmaceuticals.
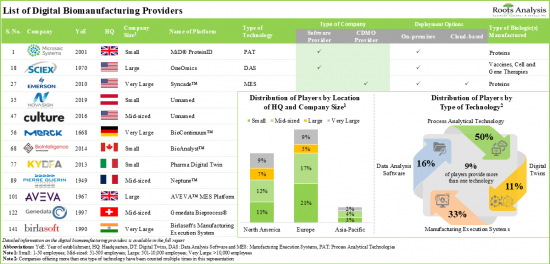
- 140+ platforms, based on PAT, DAS, MES, digital twins and other such technologies, are being offered for digitalization of the biologic production process.
- Over 85% of the process analytical technologies are capable of offering process automation and bioprocess optimization and controls, majority of these platforms support the manufacturing of proteins and antibodies.
- Data analysis software offers a wide spectrum of technical competencies, including process intelligence and data integration; predominantly, these platforms are compatible with artificial intelligence-based programs.
- Leveraging their expertise, ~80% of players are offering cloud-based MES solutions that can be integrated with numerous types of software to carry out production tracking, performance analysis and data integration functions.
- The developer landscape is dominated by the presence of established players; asset / process management emerged as the prominent application areas for digital twin technologies.
- In pursuit of gaining a competitive edge, digital biomanufacturing providers are upgrading their existing software capabilities and enhancing their biologic focused technology portfolios.
- The growing preference for digitalization of bioprocessing is evident from the rise in partnership activity; it is worth highlighting that more than 80% of the deals were forged in the last three years.
- The adoption of digital biomanufacturing solutions has increased considerably in recent years; white spaces in this domain present significant growth opportunities for innovators.
- Fundamental advancements in the field of smart biomanufacturing will promote process robustness and product quality; this will inevitably culminate in accelerated growth of the market.
- Driven by continuous technological innovations, this domain is anticipated to witness steady growth; technologies focused on digital twins are expected to gain significant traction with an annualized growth of 19%.
DIGITAL BIOMANUFACTURING MARKET: KEY SEGMENTS
Digital Twins is the Fastest Growing Segment of the Digital Biomanufacturing Market
Based on the type of technology, the market is segmented into process analytical technology, data analysis software, manufacturing execution system and digital twin. At present, the process analytical technology segment holds the maximum share of the digital biomanufacturing market. It is worth highlighting that the digital biomanufacturing market for digital twins is likely to grow at a relatively higher CAGR.
Currently, the On-premises Segment Occupies the Largest Share of the Digital Biomanufacturing Market
Based on the deployment options, the market is segmented into cloud-based and on-premises. Currently, the on-premises segment holds the maximum share of the digital biomanufacturing market. It is worth highlighting that the digital biomanufacturing market for cloud-based deployment option is likely to grow at a relatively higher CAGR.
Cell Therapies and Gene Therapies are the Fastest Growing Segment of the Digital Biomanufacturing Market During the Forecast Period
Based on the type of biologic(s) manufactured, the market is segmented into antibodies, cell therapies and gene therapies, proteins, vaccines, and others. At present, the antibody segment holds the maximum share of the digital biomanufacturing market. It is worth highlighting that the digital biomanufacturing market for cell therapies and gene therapies is likely to grow at a relatively higher CAGR.
North America Accounts for the Largest Share of the Market
Based on key geographical regions, the market is segmented into North America, Europe, Asia-Pacific, Latin America, and Middle East and North Africa. The majority share is expected to be captured by players based in North America. It is worth highlighting that, over the years, the market in Europe is expected to grow at a higher CAGR.
Example Players in the Digital Biomanufacturing Market
- AspenTech
- Bioreactors.net
- Dassault Systemes
- FUJIFILM Diosynth Biotechnologies
- GE Healthcare
- Korber
- Merck
- Sartorius
- Thermo Fisher Scientific
Primary Research Overview
The opinions and insights presented in this study were influenced by discussions conducted with multiple stakeholders. The research report features detailed transcripts of interviews held with the following industry stakeholders:
- Chief Executive Officer and President, BioIntelligence Technologies
- Managing Director and Chief Executive Officer, Yokogawa Insilico Biotechnology
- Vice President of Operations and Strategic Initiatives, Aizon
- Director, Business Development and Channel Sales, and Quality and Manufacturing Digitization Specialist, MasterControl
- Director of Sales, Trunovate
- Business Consultant, Dassault Systemes
DIGITAL BIOMANUFACTURING MARKET: RESEARCH COVERAGE
- Market Sizing and Opportunity Analysis: The report features an in-depth analysis of the digital biomanufacturing market, focusing on key market segments, including [A] type of technology, [B] deployment options, [C] types of biologics manufactured and [D] key geographical regions.
- Market Landscape: A comprehensive evaluation of digital biomanufacturing companies (offering digital biomanufacturing technologies - Process Analytical Technology, Data Analysis Software, Manufacturing Execution System and Digital Twin), considering various parameters, such as [A] year of establishment, [B] company size (in terms of number of employees), [C] location of headquarters, [D] type of company, [E] number of platforms offered, [F] deployment options, [G] platform capabilities, [H] software capabilities, [I] type(s) of biologic(s) manufactured, [J] other compatible platforms, [K] type of end user(s), [L] integrating software, [M] manufacturing operation management (MOM), [N] product lifecycle management (PLM), [O] human resource management (HRM)), [P] type of service(s) offered and [Q] area(s) of application.
- Technology Competitiveness Analysis: A comprehensive competitive analysis of digital biomanufacturing technologies, examining factors, such as [A] supplier strength, [B] technology portfolio and [C] type(s) of biologic(s) manufactured.
- Company Profiles: In-depth profiles of key industry players offering digital biomanufacturing technologies, focusing on [A] company overviews, [B] capabilities of digital technologies offered by these firms, [C] recent developments and [D] an informed future outlook.
- Competitive Benchmarking Analysis: A competitive benchmarking analysis highlighting the existing capabilities companies, across key peer groups.
- Partnerships and Collaborations: An analysis of partnerships established in this sector, since 2018, based on multiple relevant parameters, such as [A] year of partnership, [B] type of partnership, [C] type of technology, [D] most active players (in terms of number of deals inked) and [E] regional distribution of partnership activity.
- Market Concentration Analysis: A detailed analysis highlighting the market concentration of key industry stakeholders across various regions, based on prevalent parameters, such as [A] years of entrance, [B] company size, [C] type of technology, [D] number of platforms offered and [E] number of partnerships inked.
- Industry Lifecycle Analysis: A comprehensive analysis of the digital biomanufacturing industry that outlines its various stages, such as emergence, growth, maturation and decline. This analysis aims to enhance understanding of the current phase of the industry on the lifecycle chart based on historical trends, partnership dynamics, and investments made by stakeholders in this field. Additionally, it highlights the impact of key factors that are likely to drive the growth of the market. The report also discusses both short-term and long-term effects of key factors anticipated to significantly influence the broader adoption of digitalization in the field of biomanufacturing.
KEY QUESTIONS ANSWERED IN THIS REPORT
- How many companies are currently engaged in this market?
- Which are the leading companies in this market?
- What kind of partnership models are commonly adopted by industry stakeholders?
- What factors are likely to influence the evolution of this market?
- What is the current and future market size?
- What is the CAGR of this market?
- How is the current and future market opportunity likely to be distributed across key market segments?
REASONS TO BUY THIS REPORT
- The report provides a comprehensive market analysis, offering detailed revenue projections of the overall market and its specific sub-segments. This information is valuable to both established market leaders and emerging entrants.
- Stakeholders can leverage the report to gain a deeper understanding of the competitive dynamics within the market. By analyzing the competitive landscape, businesses can make informed decisions to optimize their market positioning and develop effective go-to-market strategies.
- The report offers stakeholders a comprehensive overview of the market, including key drivers, barriers, opportunities, and challenges. This information empowers stakeholders to stay abreast of market trends and make data-driven decisions to capitalize on growth prospects.
ADDITIONAL BENEFITS
- Complimentary PPT Insights Packs
- Complimentary Excel Data Packs for all Analytical Modules in the Report
- 10% Free Content Customization
- Detailed Report Walkthrough Session with Research Team
- Free Updated report if the report is 6-12 months old or older
TABLE OF CONTENTS
1. PREFACE
- 1.1. Introduction
- 1.2. Key Market Insights
- 1.3. Scope of the Report
- 1.4. Research Methodology
- 1.5. Frequently Asked Questions
- 1.6. Chapter Outlines
2. EXECUTIVE SUMMARY
3. INTRODUCTION
- 3.1. Chapter Overview
- 3.2. Overview of Digital Biomanufacturing in Healthcare
- 3.3. Emerging Technologies that Support Digital Biomanufacturing
- 3.3.1. Process Analytical Technology (PAT)
- 3.3.2. Data Analysis Software (DAS)
- 3.3.3. Bioprocess Digital Twins
- 3.3.4. Manufacturing Execution Systems (MES)
- 3.4. Challenges Associated with the Adoption of Digital Biomanufacturing
- 3.5. Future Perspectives
4. MARKERT LANDSCAPE
- 4.1. Chapter Overview
- 4.2. List of Process Analytical Technology (PAT) Providers
- 4.2.1. Analysis by Year of Establishment
- 4.2.2. Analysis by Company Size
- 4.2.3. Analysis by Location of Headquarters (Region-wise)
- 4.2.4. Analysis by Location of Headquarters (Country-wise)
- 4.2.5. Analysis by Type of Company
- 4.2.6. Analysis by Number of Platforms Offered
- 4.2.7. Analysis by Deployment Options
- 4.2.8. Analysis by Platform Capabilities
- 4.2.9. Analysis by Type(s) of Biologic(s) Manufactured
- 4.2.10. Analysis by Other Compatible Platforms
- 4.2.11. Analysis by Type of End User(s)
- 4.2.12. Analysis by Year of Establishment, Location of Headquarters and Platform Capabilities
- 4.2.13. Analysis by Years of Experience, Location of Headquarters and Number of Platform Capabilities (Dot-Plot Representation)
- 4.3. List of Data Analysis Software (DAS) Providers
- 4.3.1. Analysis by Year of Establishment
- 4.3.2. Analysis by Company Size
- 4.3.3. Analysis by Location of Headquarters (Region-wise)
- 4.3.4. Analysis by Location of Headquarters (Country-wise)
- 4.3.5. Analysis by Type of Company
- 4.3.6. Analysis by Number of Software Offered
- 4.3.7. Analysis by Deployment Options
- 4.3.8. Analysis by Software Capabilities
- 4.3.9. Analysis by Other Compatible Platforms
- 4.3.10. Analysis by Type of End User(s)
- 4.3.11. Analysis by Year of Establishment, Location of Headquarters and Software Capabilities
- 4.3.12. Analysis by Years of Experience, Location of Headquarters and Number of Software Capabilities (Dot-Plot Representation)
- 4.4. List of Manufacturing Execution Systems (MES) Providers
- 4.4.1. Analysis by Year of Establishment
- 4.4.2. Analysis by Company Size
- 4.4.3. Analysis by Location of Headquarters (Region-wise)
- 4.4.4. Analysis by Location of Headquarters (Country-wise)
- 4.4.5. Analysis by Type of Company
- 4.4.6. Analysis by Number of Platforms Offered
- 4.4.7. Analysis by Deployment Options
- 4.4.8. Analysis by Platform Capabilities
- 4.4.9. Analysis by Integrating Software
- 4.4.10. Analysis by Type of Service(s) Offered
- 4.4.11. Analysis by Analysis by Years of Experience, Location of Headquarters and Number of Platform Capabilities (Dot-Plot Representation)
- 4.5. List of Digital Twins Providers
- 4.5.1. Analysis by Year of Establishment
- 4.5.2. Analysis by Company Size
- 4.5.3. Analysis by Location of Headquarters (Region-wise)
- 4.5.4. Analysis by Location of Headquarters (Country-wise)
- 4.5.5. Analysis by Number of Platforms Offered
- 4.5.6. Analysis by Area(s) of Application
- 4.5.7. Analysis by Type of End User(s)
- 4.5.8. Analysis by Years of Experience, Location of Headquarters and Area(s) of Application (Dot-Plot Representation)
5. TECHNOLOGY COMPETITIVENESS ANALYSIS
- 5.1. Chapter Overview
- 5.2. Methodology
- 5.3. Digital Biomanufacturing: Competitiveness Analysis
- 5.4. Assumptions and Key Parameters for PAT Technologies
- 5.4.1. Technology Competitiveness Analysis: Process Analytical Technologies Offered by Small Companies
- 5.4.2. Technology Competitiveness Analysis: Process Analytical Technologies Offered by Mid-sized Companies
- 5.4.3. Technology Competitiveness Analysis: Process Analytical Technologies Offered by Large Companies
- 5.4.4. Technology Competitiveness Analysis: Process Analytical Technologies Offered by Very Large Companies
- 5.5. Assumptions and Key Parameters for DAS Technologies
- 5.5.1 Technology Competitiveness Analysis: Data Analysis Software
- 5.6. Assumptions and Key Parameters for MES Technologies
- 5.6.1. Technology Competitiveness Analysis: Manufacturing Execution Systems Offered by Small Companies
- 5.6.2. Technology Competitiveness Analysis: Manufacturing Execution Systems Offered by Mid-sized Companies
- 5.6.3. Technology Competitiveness Analysis: Manufacturing Execution Systems Offered by Large and Very Large Companies
- 5.7. Assumptions and Key Parameters for Digital Twins
- 5.7.1 Technology Competitiveness Analysis: Digital Twins
6. COMPANY PROFILES
- 6.1. Chapter Overview
- 6.2. AspenTech
- 6.2.1. Company Overview
- 6.2.2. Financial Information
- 6.2.3. Technology Portfolio
- 6.2.4. Recent Developments and Future Outlook
- 6.3. FUJIFILM Diosynth Biotechnologies
- 6.3.1. Company Overview
- 6.3.2. Financial Information
- 6.3.3. Technology Portfolio
- 6.3.4. Recent Developments and Future Outlook
- 6.4. Merck
- 6.4.1. Company Overview
- 6.4.2. Financial Information
- 6.4.3. Technology Portfolio
- 6.4.4. Recent Developments and Future Outlook
- 6.5. Thermo Fisher Scientific
- 6.5.1. Company Overview
- 6.5.2. Financial Information
- 6.5.3. Technology Portfolio
- 6.5.4. Recent Developments and Future Outlook
- 6.6. Bioreactors.net
- 6.6.1. Company Overview
- 6.6.2. Technology Portfolio
- 6.6.3. Recent Developments and Future Outlook
- 6.7. Sartorius
- 6.7.1. Company Overview
- 6.7.2. Financial Information
- 6.7.3. Technology Portfolio
- 6.7.4. Recent Developments and Future Outlook
- 6.8. Dassault Systemes
- 6.8.1. Company Overview
- 6.8.2. Financial Information
- 6.8.3. Area(s) of Application
- 6.8.4. Recent Developments and Future Outlook
- 6.9. GE Healthcare
- 6.9.1. Company Overview
- 6.9.2. Technology Portfolio
- 6.9.3. Recent Developments and Future Outlook
- 6.10. Korber
- 6.10.1. Company Overview
- 6.10.2. Financial Information
- 6.10.3. Technology Portfolio
- 6.10.4. Recent Developments and Future Outlook
7. BENCHMARKING ANALYSIS
- 7.1. Chapter Overview
- 7.2. Methodology and Key Assumptions
- 7.3. Competitive Benchmarking by Company Size and Region
- 7.3.1. Competitive Benchmarking: Small Players based in North America (Peer Group I)
- 7.3.2. Competitive Benchmarking: Mid-sized Players based in North America (Peer Group II)
- 7.3.3. Competitive Benchmarking: Large and Very Large Players based in North America (Peer Group III)
- 7.3.4. Competitive Benchmarking: Small Players based in Europe (Peer Group IV)
- 7.3.5. Competitive Benchmarking: Mid-sized Players based in Europe (Peer Group V)
- 7.3.6. Competitive Benchmarking: Large and Very Large Players based in Europe (Peer Group VI)
- 7.3.7. Competitive Benchmarking: Small, Mid-sized and Very Large Players based in Asia-Pacific (Peer Group VII)
- 7.4. Competitive Benchmarking: Pockets of Innovation and White Spaces
8. PARTNERSHIPS AND COLLABORATIONS
- 8.1. Chapter Overview
- 8.2. Partnership Models
- 8.3. Digital Biomanufacturing: List of Partnerships and Collaborations
- 8.3.1. Analysis by Year of Partnership
- 8.3.2. Analysis by Type of Partnership
- 8.3.3. Analysis by Year and Type of Partnership
- 8.3.4. Analysis by Type of Technology
- 8.3.5. Analysis by Year of Partnership and Type of Technology
- 8.3.6. Most Active Players: Analysis by Number of Partnerships
- 8.3.7. Analysis by Geography
- 8.3.7.1. Intracontinental and Intercontinental Agreements
- 8.3.7.2. International and Local Agreements
9. MARKET CONCENTRATION ANALYSIS
- 9.1. Chapter Overview
- 9.2. Assumptions and Key Parameters
- 9.3. Methodology
- 9.4. Market Concentration Analysis: Top Digital Biomanufacturing Providers
10. INDUSTRY LIFECYCLE ANALYSIS
- 10.1. Chapter Overview
- 10.2. Industry Lifecycle Analysis
- 10.3. Digital Biomanufacturing: Historical Timeline of Key Events
- 10.4. Digital Biomanufacturing: Start-up Activity
- 10.5. Digital Biomanufacturing: Established Players Activity
- 10.6. Digital Biomanufacturing: Partnership and Collaboration Trends
- 10.7. Digital Biomanufacturing: Funding and Investments Trends
- 10.8. Current Barriers to Wider Adoption of Digitalization in Biomanufacturing
- 10.9. Future Outlook of Digital Biomanufacturing
- 10.10. Industry Lifecycle Analysis: Digital Biomanufacturing
11. MARKET FORECAST AND OPPORTUNITY ANALYSIS
- 11.1. Chapter Overview
- 11.2. Forecast Methodology and Key Assumptions
- 11.3. Global Digital Biomanufacturing Market, till 2035
- 11.4. Digital Biomanufacturing Market: Analysis by Type of Technology
- 11.4.1. Digital Biomanufacturing Market for PAT, till 2035
- 11.4.2. Digital Biomanufacturing Market for DAS, till 2035
- 11.4.3. Digital Biomanufacturing Market for MES, till 2035
- 11.4.4. Digital Biomanufacturing Market for Digital Twins, till 2035
- 11.5. Digital Biomanufacturing Market: Analysis by Type of Deployment Options
- 11.5.1. Digital Biomanufacturing Market for Cloud-based Deployment Options, till 2035
- 11.5.2. Digital Biomanufacturing Market for On-premises Deployment Options, till 2035
- 11.6. Digital Biomanufacturing Market: Analysis by Type(s) of Biologic(s) Manufactured
- 11.6.1. Digital Biomanufacturing Market for Antibodies, till 2035
- 11.6.2. Digital Biomanufacturing Market for Cell and Gene Therapies, till 2035
- 11.6.3. Digital Biomanufacturing Market for Proteins, till 2035
- 11.6.4. Digital Biomanufacturing Market for Vaccines, till 2035
- 11.6.5. Digital Biomanufacturing Market for Others, till 2035
- 11.7. Digital Biomanufacturing Market: Analysis by Geography
- 11.7.1. Digital Biomanufacturing Market in North America, till 2035
- 11.7.2. Digital Biomanufacturing Market in Europe, till 2035
- 11.7.3. Digital Biomanufacturing Market in Asia-Pacific, till 2035
- 11.7.4. Digital Biomanufacturing Market in Latin America, till 2035
- 11.7.5. Digital Biomanufacturing Market in Middle East and North Africa, till 2035
12. CONCLUDING REMARKS
13. INTERVIEW TRANSCRIPTS
- 13.1. Chapter Overview
- 13.2. BioIntelligence Technologies
- 13.2.1. Interview Transcript: Chief Executive Officer and President
- 13.2. Yokogawa Insilico Biotechnology
- 13.2.1. Interview Transcript: Managing Director and Chief Executive Officer
- 13.3. MasterControl
- 13.3.1. Interview Transcript: Director, Business Development and Channel Sales, and Quality and Manufacturing Digitization Specialist
- 13.4. Trunovate
- 13.4.1. Interview Transcript: Director of Sales
- 13.5. Dassault Systemes
- 13.5.1. Interview Transcript: Business Consultant
14. APPENDIX I: TABULATED DATA
15. APPENDIX II: LIST OF COMPANIES AND ORGANIZATIONS
List of Tables
- Table 4.1 List of Process Analytical Technology Providers
- Table 4.2 Process Analytical Technology Providers: Information on Platform and Deployment Options
- Table 4.3 Process Analytical Technologies: Information on Platform Capabilities
- Table 4.4 Process Analytical Technologies: Information on Type(s) of Biologic(s) Manufactured, Other Compatible Platforms and Type of End User(s)
- Table 4.5 List of Data Analysis Software Providers
- Table 4.6 Data Analysis Software Providers: Information on Deployment Options
- Table 4.7 Data Analysis Software: Information on Software Capabilities
- Table 4.8 Data Analysis Software: Information on Type of Biologic(s) Manufactured, Other Compatible Platforms and Type of End User(s)
- Table 4.9 List of Manufacturing Execution Systems Providers
- Table 4.10 Manufacturing Execution Systems Providers: Information on Deployment Options
- Table 4.11 Manufacturing Execution Systems: Information on Platform Capabilities
- Table 4.12 Manufacturing Execution Systems: Information on Area(s) of Application and Type of End User(s)
- Table 4.13 List of Digital Twins Providers
- Table 4.14 Digital Twins Technologies: Information on Area(s) of Application and Type of End User(s)
- Table 5.1 Technology Competitiveness Analysis: Information on Peer Groups
- Table 6.1 List of Companies Profiled
- Table 6.2 AspenTech: Company Snapshot
- Table 6.3 AspenTech: Recent Developments and Future Outlook
- Table 6.4 FUJIFILM Diosynth Biotechnologies: Company Snapshot
- Table 6.5 FUJIFILM Diosynth Biotechnologies: Recent Developments and Future Outlook
- Table 6.6 Merck: Company Snapshot
- Table 6.7 Merck: Recent Developments and Future Outlook
- Table 6.8 Thermo Fisher Scientific: Company Snapshot
- Table 6.9 Thermo Fisher Scientific: Recent Developments and Future Outlook
- Table 6.10 Bioreactors.net: Company Snapshot
- Table 6.11 Sartorius: Company Snapshot
- Table 6.12 Sartorius: Recent Developments and Future Outlook
- Table 6.13 Dassault Systemes: Company Snapshot
- Table 6.14 GE Healthcare: Company Snapshot
- Table 6.15 GE Healthcare: Recent Developments and Future Outlook
- Table 6.16 Korber: Company Snapshot
- Table 6.17 Korber: Recent Developments and Future Outlook
- Table 7.1 Benchmark Analysis: Information on Peer Groups
- Table 8.1 Digital Biomanufacturing: List of Partnerships and Collaborations, since 2018
- Table 8.2 Digital Biomanufacturing: Information on Type of Agreement (Country-wise and Continent-wise), since 2018
- Table 9.1 Market Concentration Analysis: Information on Years of Entrance and Key Offerings of Top Digital Biomanufacturing Providers
- Table 10.1 Industry Lifecycle Analysis
- Table 10.2 Industry Lifecycle Analysis: Digital Biomanufacturing
- Table 13.1 BioIntelligence Technologies: Company Snapshot
- Table 13.2 Yokogawa Insilico Biotechnology: Company Snapshot
- Table 13.3 MasterControl: Company Snapshot
- Table 13.4 Trunovate: Company Snapshot
- Table 13.5 Dassault Systemes: Company Snapshot
- Table 14.1 Digital Biomanufacturing Providers: Distribution by Type of Technology
- Table 14.2 Process Analytical Technology Providers: Distribution by Year of Establishment
- Table 14.3 Process Analytical Technology Providers: Distribution by Company Size
- Table 14.4 Process Analytical Technology Providers: Distribution by Location of Headquarters (Region-wise)
- Table 14.5 Process Analytical Technology Providers: Distribution by Location of Headquarters (Country-wise)
- Table 14.6 Process Analytical Technology Providers: Distribution by Type of Company
- Table 14.7 Process Analytical Technology Providers: Distribution by Number of Platforms Offered
- Table 14.8 Process Analytical Technology Provider: Distribution by Deployment Options
- Table 14.9 Process Analytical Technologies: Distribution by Platform Capabilities
- Table 14.10 Process Analytical Technologies: Distribution by Type(s) of Biologic(s) Manufactured
- Table 14.11 Process Analytical Technologies: Distribution by Other Compatible Platforms
- Table 14.12 Process Analytical Technology Providers: Distribution by Type of End User(s)
- Table 14.13 Process Analytical Technologies: Distribution by Year of Establishment, Location of Headquarters and Platform Capabilities
- Table 14.14 Data Analysis Software Providers: Distribution by Year of Establishment
- Table 14.15 Data Analysis Software Providers: Distribution by Company Size
- Table 14.16 Data Analysis Software Providers: Distribution by Location of Headquarters (Region-wise)
- Table 14.17 Data Analysis Software Providers: Distribution by Location of Headquarters (Country-wise)
- Table 14.18 Data Analysis Software Providers: Distribution by Type of Company
- Table 14.19 Data Analysis Software Providers: Distribution by Number of Software Offered
- Table 14.20 Data Analysis Software Providers: Distribution by Deployment Options
- Table 14.21 Data Analysis Software: Distribution by Software Capabilities
- Table 14.22 Data Analysis Software: Distribution by Other Compatible Platforms
- Table 14.23 Data Analysis Software Providers: Distribution by Type of End User(s)
- Table 14.24 Data Analysis Software: Distribution by Year of Establishment, Location of Headquarters and Software Capabilities
- Table 14.25 Manufacturing Execution Systems Providers: Distribution by Year of Establishment
- Table 14.26 Manufacturing Execution Systems Providers: Distribution by Company Size
- Table 14.27 Manufacturing Execution Systems Providers: Distribution by Location of Headquarters (Region-wise)
- Table 14.28 Manufacturing Execution Systems Providers: Distribution by Location of Headquarters (Country-wise)
- Table 14.29 Manufacturing Execution Systems Providers: Distribution by Type of Company
- Table 14.30 Manufacturing Execution Systems Providers: Distribution by Number of Platforms Offered
- Table 14.31 Manufacturing Execution Systems Providers: Distribution by Deployment Options
- Table 14.32 Manufacturing Execution Systems: Distribution by Platform Capabilities
- Table 14.33 Manufacturing Execution Systems: Distribution by Integrating Software
- Table 14.34 Manufacturing Execution Systems: Distribution by Types of Service(s) Offered
- Table 14.35 Digital Twins Providers: Distribution by Year of Establishment
- Table 14.36 Digital Twins Providers: Distribution by Company Size
- Table 14.37 Digital Twins Providers: Distribution by Location of Headquarters (Region-wise)
- Table 14.38 Digital Twins Providers: Distribution by Location of Headquarters (Country-wise)
- Table 14.39 Digital Twins Providers: Distribution by Number of Platforms Offered
- Table 14.40 Digital Twins Technologies: Distribution by Area(s) of Application
- Table 14.41 Digital Twins Providers: Distribution by Type of End User(s)
- Table 14.42 AspenTech: Annual Revenues, FY 2020 Onwards (USD Million)
- Table 14.43 FUJIFILM Diosynth Biotechnologies: Annual Revenues, FY 2018 Onwards (USD Million)
- Table 14.44 Merck: Annual Revenues, FY 2018 Onwards (USD Billion)
- Table 14.45 Thermo Fisher Scientific: Annual Revenues, FY 201 Onwards (USD Billion)
- Table 14.46 Sartorius: Annual Revenues, FY 2017 Onwards (USD Million)
- Table 14.47 Dassault Systemes: Annual Revenues, FY 2017 Onwards (USD Billion)
- Table 14.48 Korber: Annual Revenues, FY 2019 Onwards (USD Million)
- Table 14.49 Benchmark Analysis: Distribution by Company Size and Region
- Table 14.50 Partnerships and Collaborations: Distribution by Year of Partnership
- Table 14.51 Partnerships and Collaborations: Distribution by Type of Partnership
- Table 14.52 Partnerships and Collaborations: Distribution by Year and Type of Partnership
- Table 14.53 Partnerships and Collaborations: Distribution by Type of Technology
- Table 14.54 Partnerships and Collaborations: Distribution by Year of Partnership and Type of Technology
- Table 14.55 Most Active Players: Distribution by Number of Partnerships
- Table 14.56 Partnerships and Collaborations: Intracontinental and Intercontinental Agreements
- Table 14.57 Partnerships and Collaborations: International and Local Agreements
- Table 14.58 Digital Biomanufacturing: Start-up Activity
- Table 14.59 Global Digital Biomanufacturing Market, Conservative, Base and Optimistic Scenario, till 2035 (USD Billion)
- Table 14.60 Digital Biomanufacturing Market: Distribution by Type of Technology, Current Year and 2035
- Table 14.61 Digital Biomanufacturing Market for PAT, Conservative, Base and Optimistic Scenario, till 2035 (USD Billion)
- Table 14.62 Digital Biomanufacturing Market for DAS, Conservative, Base and Optimistic Scenario, till 2035 (USD Billion)
- Table 14.63 Digital Biomanufacturing Market for MES, Conservative, Base and Optimistic Scenario, till 2035 (USD Billion)
- Table 14.64 Digital Biomanufacturing Market for Digital Twins, Conservative, Base and Optimistic Scenario, till 2035 (USD Billion)
- Table 14.65 Digital Biomanufacturing Market: Distribution by Type of Deployment Options, Current Year and 2035
- Table 14.66 Digital Biomanufacturing Market for Cloud-based Deployment Options, Conservative, Base and Optimistic Scenario, till 2035 (USD Billion)
- Table 14.67 Digital Biomanufacturing Market for On-premises Deployment Options, Conservative, Base and Optimistic Scenario, till 2035 (USD Billion)
- Table 14.68 Digital Biomanufacturing Market: Distribution by Type(s) of Biologic(s) Manufactured, Current Year and 2035
- Table 14.69 Digital Biomanufacturing Market for Antibodies, Conservative, Base and Optimistic Scenario, till 2035 (USD Billion)
- Table 14.70 Digital Biomanufacturing Market for Cell and Gene Therapies, Conservative, Base and Optimistic Scenario, till 2035 (USD Billion)
- Table 14.71 Digital Biomanufacturing Market for Proteins, Conservative, Base and Optimistic Scenario, till 2035 (USD Billion)
- Table 14.72 Digital Biomanufacturing Market for Vaccines, Conservative, Base and Optimistic Scenario, till 2035 (USD Billion)
- Table 14.73 Digital Biomanufacturing Market for Others, Conservative, Base and Optimistic Scenario, till 2035 (USD Billion)
- Table 14.74 Digital Biomanufacturing Market: Distribution by Geography, Current Year and 2035
- Table 14.75 Digital Biomanufacturing Market in North America, Conservative, Base and Optimistic Scenario, till 2035 (USD Billion)
- Table 14.76 Digital Biomanufacturing Market in Europe, Conservative, Base and Optimistic Scenario, till 2035 (USD Billion)
- Table 14.77 Digital Biomanufacturing Market in Asia-Pacific, Conservative, Base and Optimistic Scenario, till 2035 (USD Billion)
- Table 14.78 Digital Biomanufacturing Market in Latin America, Conservative, Base and Optimistic Scenario, till 2035 (USD Billion)
- Table 14.79 Digital Biomanufacturing Market in Middle East and North Africa, Conservative, Base and Optimistic Scenario, till 2035 (USD Billion)
List of Figures
- Figure 2.1 Executive Summary: Market Landscape
- Figure 2.2 Executive Summary: Partnerships and Collaborations
- Figure 2.3 Executive Summary: Market Forecast and Opportunity Analysis
- Figure 3.1 Overview of Digital Biomanufacturing in Healthcare
- Figure 3.2 Software Capabilities in Digital Biomanufacturing
- Figure 3.3 Challenges Associated with the Adoption of Digital Biomanufacturing
- Figure 4.1 Digital Biomanufacturing Providers: Distribution by Type of Technology
- Figure 4.2 Process Analytical Technology Providers: Distribution by Year of Establishment
- Figure 4.3 Process Analytical Technology Providers: Distribution by Company Size
- Figure 4.4 Process Analytical Technology Providers: Distribution by Location of Headquarters (Region-wise)
- Figure 4.5 Process Analytical Technology Providers: Distribution by Location of Headquarters (Country-wise)
- Figure 4.6 Process Analytical Technology Providers: Distribution by Type of Company
- Figure 4.7 Process Analytical Technology Providers: Distribution by Number of Platforms Offered
- Figure 4.8 Process Analytical Technology Provider: Distribution by Deployment Options
- Figure 4.9 Process Analytical Technologies: Distribution by Platform Capabilities
- Figure 4.10 Process Analytical Technologies: Distribution by Type(s) of Biologic(s) Manufactured
- Figure 4.11 Process Analytical Technologies: Distribution by Other Compatible Platforms
- Figure 4.12 Process Analytical Technology Providers: Distribution by Type of End User(s)
- Figure 4.13 Process Analytical Technologies: Distribution by Year of Establishment, Location of Headquarters and Platform Capabilities
- Figure 4.14 Process Analytical Technologies offered by Small Companies: Distribution by Years of Experience, Location of Headquarters and Number of Platform Capabilities
- Figure 4.15 Process Analytical Technologies offered by Mid-sized Companies: Distribution by Years of Experience, Location of Headquarters and Number of Platform Capabilities
- Figure 4.16 Process Analytical Technologies offered by Large Companies: Distribution by Years of Experience, Location of Headquarters and Number of Platform Capabilities
- Figure 4.17 Process Analytical Technologies offered by Very Large Companies: Distribution by Years of Experience, Location of Headquarters and Number of Platform Capabilities
- Figure 4.18 Data Analysis Software Providers: Distribution by Year of Establishment
- Figure 4.19 Data Analysis Software Providers: Distribution by Company Size
- Figure 4.20 Data Analysis Software Providers: Distribution by Location of Headquarters (Region-wise)
- Figure 4.21 Data Analysis Software Providers: Distribution by Location of Headquarters (Country-wise)
- Figure 4.22 Data Analysis Software Providers: Distribution by Type of Company
- Figure 4.23 Data Analysis Software Providers: Distribution by Number of Software Offered
- Figure 4.24 Data Analysis Software Provider: Distribution by Deployment Options
- Figure 4.25 Data Analysis Software: Distribution by Software Capabilities
- Figure 4.26 Data Analysis Software: Distribution by Other Compatible Platforms
- Figure 4.27 Data Analysis Software Providers: Distribution by Type of End User(s)
- Figure 4.28 Data Analysis Software: Distribution by Year of Establishment, Location of Headquarters and Software Capabilities
- Figure 4.29 Data Analysis Software Providers: Distribution by Years of Experience, Location of Headquarters and Number of Software Capabilities
- Figure 4.30 Manufacturing Execution Systems Providers: Distribution by Year of Establishment
- Figure 4.31 Manufacturing Execution Systems Providers: Distribution by Company Size
- Figure 4.32 Manufacturing Execution Systems Providers: Distribution by Location of Headquarters (Region-wise)
- Figure 4.33 Manufacturing Execution Systems Providers: Distribution by Location of Headquarters (Country-wise)
- Figure 4.34 Manufacturing Execution Systems Providers: Distribution by Type of Company
- Figure 4.35 Manufacturing Execution Systems Providers: Distribution by Number of Platforms Offered
- Figure 4.36 Manufacturing Execution Systems Providers: Distribution by Deployment Options
- Figure 4.37 Manufacturing Execution Systems: Distribution by Platform Capabilities
- Figure 4.38 Manufacturing Execution Systems: Distribution by Integrating Software
- Figure 4.39 Manufacturing Execution Systems: Distribution by Types of Service(s) Offered
- Figure 4.40 Manufacturing Execution Systems Offered by Small Companies: Distribution by Years of Experience, Location of Headquarters and Number of Platform Capabilities
- Figure 4.41 Manufacturing Execution Systems Offered by Mid-sized Companies: Distribution by Years of Experience, Location of Headquarters and Number of Platform Capabilities
- Figure 4.42 Manufacturing Execution Systems offered by Large and Very Large Companies: Distribution by Years of Experience, Location of Headquarters and Number of Platform Capabilities
- Figure 4.43 Digital Twins Providers: Distribution by Year of Establishment
- Figure 4.44 Digital Twins Providers: Distribution by Company Size
- Figure 4.45 Digital Twins Providers: Distribution by Location of Headquarters (Region-wise)
- Figure 4.46 Digital Twins Providers: Distribution by Location of Headquarters (Country- wise)
- Figure 4.47 Digital Twins Providers: Distribution by Number of Platforms Offered
- Figure 4.48 Digital Twins Technologies: Distribution by Area(s) of Application
- Figure 4.49 Digital Twins Providers: Distribution by Type of End User(s)
- Figure 4.50 Digital Twins Providers: Distribution by Years of Experience, Location of Headquarters and Area(s) of Application
- Figure 5.1 Process Analytical Technologies Offered by Small Companies
- Figure 5.2 Process Analytical Technologies Offered by Mid-sized Companies
- Figure 5.3 Process Analytical Technologies Offered by Large Companies
- Figure 5.4 Process Analytical Technologies Offered by Very Large Companies
- Figure 5.5 Technology Competitiveness Analysis: Data Analysis Software
- Figure 5.6 Manufacturing Execution Systems Offered by Small Companies
- Figure 5.7 Manufacturing Execution Systems Offered by Mid-sized Companies
- Figure 5.8 Manufacturing Execution Systems Offered by Large and Very Large Companies
- Figure 5.9 Technology Competitiveness Analysis: Digital Twins Technologies
- Figure 6.1 AspenTech: Annual Revenues, FY 2020 Onwards (USD Million)
- Figure 6.2 AspenTech: Technology Capabilities
- Figure 6.3 FUJIFILM Diosynth Biotechnologies: Annual Revenues, FY 2018 Onwards (USD Million)
- Figure 6.4 FUJIFILM Diosynth Biotechnologies: Technology Capabilities
- Figure 6.5 Merck: Annual Revenues, FY 2018 Onwards (USD Billion)
- Figure 6.6 Merck: Technology Capabilities
- Figure 6.7 Thermo Fisher Scientific: Annual Revenues, FY 2017 Onwards (USD Billion)
- Figure 6.8 Thermo Fisher Scientific: Technology Capabilities
- Figure 6.9 Bioreactors.net: Technology Capabilities
- Figure 6.10 Sartorius: Annual Revenues, FY 2017 Onwards (USD Million)
- Figure 6.11 Sartorius: Technology Capabilities
- Figure 6.12 Dassault Systemes: Annual Revenues, FY 2017 Onwards (USD Billion)
- Figure 6.13 Dassault Systemes: Area(s) of Application(s)
- Figure 6.14 GE Healthcare: Technology Capabilities
- Figure 6.15 Korber: Annual Revenues, FY 2019 Onwards (USD Million)
- Figure 6.16 Korber: Technology Capabilities
- Figure 7.1 Benchmark Analysis: Distribution by Company Size and Region
- Figure 7.2 Competitive Benchmarking: Small Players based in North America (Peer Group I)
- Figure 7.3 Competitive Benchmarking: Mid-sized Players based in North America (Peer Group II)
- Figure 7.4 Competitive Benchmarking: Large and Very Large Players based in North America (Peer Group III)
- Figure 7.5 Competitive Benchmarking: Small Players based in Europe (Peer Group IV)
- Figure 7.6 Competitive Benchmarking: Mid-sized Players based in Europe (Peer Group V)
- Figure 7.7 Competitive Benchmarking: Large and Very Large Players based in Europe (Peer Group VI)
- Figure 7.8 Competitive Benchmarking: Small, Mid-sized, Large and Very Large Players based in Asia-Pacific (Peer Group VII)
- Figure 7.9 White Spaces: Distribution of Peer Groups by Type of Technology and Type of Company
- Figure 8.1 Partnerships and Collaborations: Distribution by Year of Partnership
- Figure 8.2 Partnerships and Collaborations: Distribution by Type of Partnership
- Figure 8.3 Partnerships and Collaborations: Distribution by Year and Type of Partnership
- Figure 8.4 Partnerships and Collaborations: Distribution by Type of Technology
- Figure 8.5 Partnerships and Collaborations: Distribution by Year of Partnership and Type of Technology
- Figure 8.6 Most Active Players: Distribution by Number of Partnerships
- Figure 8.7 Partnerships and Collaborations: Intracontinental and Intercontinental Agreements
- Figure 8.8 Partnerships and Collaborations: International and Local Agreements
- Figure 9.1 Market Concentration Analysis: Comparison of Key Offerings of Top Digital Biomanufacturing Providers
- Figure 10.1 Digital Biomanufacturing: Historical Timeline of Key Events
- Figure 10.2 Digital Biomanufacturing: Start-up Activity
- Figure 10.3 Digital Biomanufacturing: Established Players Activity
- Figure 10.4 Digital Biomanufacturing: Partnership and Collaboration Trends
- Figure 10.5 Digital Biomanufacturing: Funding and Investments Trends
- Figure 10.6 Current Barriers to Wider Adoption of Digitalization in Biomanufacturing
- Figure 10.7 Future Outlook of Digital Biomanufacturing
- Figure 10.8 Industry Lifecycle Analysis: Digital Biomanufacturing
- Figure 11.1 Global Digital Biomanufacturing Market, till 2035 (USD Billion)
- Figure 11.2 Digital Biomanufacturing Market: Distribution by Type of Technology
- Figure 11.3 Digital Biomanufacturing Market for PAT, till 2035 (USD Billion)
- Figure 11.4 Digital Biomanufacturing Market for DAS, till 2035 (USD Billion)
- Figure 11.5 Digital Biomanufacturing Market for MES, till 2035 (USD Billion)
- Figure 11.6 Digital Biomanufacturing Market for Digital Twins, till 2035 (USD Billion)
- Figure 11.7 Digital Biomanufacturing Market: Distribution by Type of Deployment Options, Current Year and 2035
- Figure 11.8 Digital Biomanufacturing Market for Cloud-based Deployment Options, till 2035 (USD Billion)
- Figure 11.9 Digital Biomanufacturing Market for On-premises Deployment Options, till 2035 (USD Billion)
- Figure 11.10 Digital Biomanufacturing Market: Distribution by Type(s) of Biologic(s) Manufactured, Current Year and 2035
- Figure 11.11 Digital Biomanufacturing Market for Antibodies, till 2035 (USD Billion)
- Figure 11.12 Digital Biomanufacturing Market for Cell and Gene Therapies, till 2035 (USD Billion)
- Figure 11.13 Digital Biomanufacturing Market for Proteins, till 2035 (USD Billion)
- Figure 11.14 Digital Biomanufacturing Market for Vaccines, till 2035 (USD Billion)
- Figure 11.15 Digital Biomanufacturing Market for Others, till 2035 (USD Billion)
- Figure 11.16 Digital Biomanufacturing Market: Distribution by Geography, Current Year and 2035
- Figure 11.17 Digital Biomanufacturing Market in North America, till 2035 (USD Billion)
- Figure 11.18 Digital Biomanufacturing Market in Europe, till 2035 (USD Billion)
- Figure 11.19 Digital Biomanufacturing Market in Asia-Pacific, till 2035 (USD Billion)
- Figure 11.20 Digital Biomanufacturing Market in Latin America, till 2035 (USD Billion)
- Figure 11.21 Digital Biomanufacturing Market in Middle East and North Africa, till 2035 (USD Billion)
- Figure 12.1 Concluding Remarks: Market Overview of Process Analytical Technologies
- Figure 12.2 Concluding Remarks: Market Overview of Data Analysis Software
- Figure 12.3 Concluding Remarks: Market Overview of Manufacturing Execution Systems
- Figure 12.4 Concluding Remarks: Market Overview of Digital Twins
- Figure 12.5 Concluding Remarks: Partnerships and Collaborations
- Figure 12.6 Concluding Remarks: Market Forecast and Opportunity Analysis

