
PUBLISHER: Roots Analysis | PRODUCT CODE: 1891242

PUBLISHER: Roots Analysis | PRODUCT CODE: 1891242
Viral Vector and Plasmid DNA Manufacturing Market (7th Edition): Industry Trends and Global Forecasts, till 2035 - Distribution by Scale of Operation, Vector Manufactured, Application Area, Therapeutic Area, Manufacturer and Geographical Regions
Viral Vector and Plasmid DNA Manufacturing Market
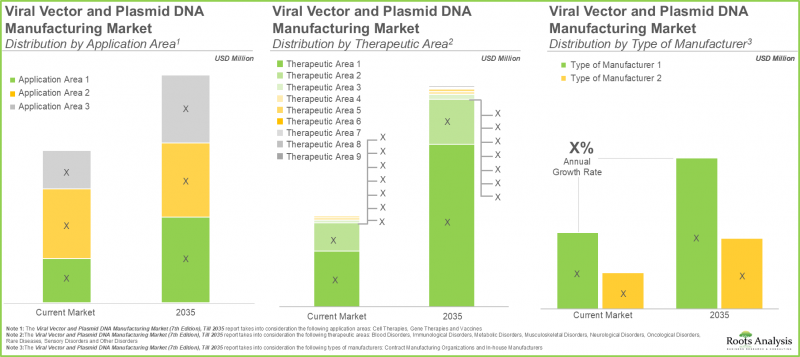
As per Roots Analysis, the global viral vector and plasmid DNA manufacturing market is estimated to grow from USD 843 million in the current year to USD 2,161 million by 2035, at a CAGR of 9.87% during the forecast period, till 2035.
Viral Vector and Plasmid DNA Manufacturing Market
The market sizing and opportunity analysis has been segmented across the following parameters:
Scale of Operation
- Preclinical
- Clinical
- Commercial
Application Area
- Cell Therapies
- Gene Therapies
- Vaccines
Type of Vector Manufactured
- AAV Vectors
- Adenoviral Vectors
- Lentiviral Vectors
- Retroviral Vectors
- Non-viral Vectors
- Other Vectors
Therapeutic Area
- Oncological Disorders
- Rare Disorders
- Immunological Disorders
- Neurological Disorders
- Sensory Disorders
- Metabolic Disorders
- Blood Disorders
- Musculoskeletal Disorders
- Infectious Diseases
- Ophthalmic Disorders
- Other Disorders
Type of Manufacturer
- In-house Manufacturers
- Contract Manufacturing Organizations
Geographical Regions
- North America
- Europe
- Asia-Pacific
- Middle East and North Africa
- Latin America
Viral Vector and Plasmid DNA Manufacturing Market: Growth and Trends
Viral and non-viral vectors have become essential instruments for transferring genetic material into target cells, constituting the foundation of contemporary cell and gene therapies. In recent years,, approximately 30 therapies utilizing viral vectors have gained global regulatory approval, with more than 500 candidates currently in clinical trials in the US. The increase in approvals and continuing research has driven the need for extensive viral vector production. Nonetheless, this field encounters numerous challenges, such as risks of immunogenicity and the intricate character of viral vector analysis. To address these challenges, developers are progressively investigating the possibilities of non-viral vectors as more secure and scalable options.
To satisfy the increasing need for vectors, the sector has launched various process improvements. Interestingly, Corning Life Sciences has created high-density cell culture systems, such as HYPERStack and CellSTACKs, which utilize gas-permeable film technology to improve vector yields. The firm has additionally launched automation systems to enhance workflows, decrease manual involvement, and speed up production schedules. These advancements in technology have generated momentum for more efficient, reliable, and economical vector production globally.
Currently, more than 300 players from both industry and non-industry sectors worldwide are engaged in efforts to back the growing pipeline of cell therapies, gene therapies, and vector-based vaccines, according to the viral vectors and plasmid DNA manufacturing market report. The expansion in this sector is additionally driven by investments, strategic partnerships, and facility expansions, demonstrating a solid dedication to addressing production challenges. These advancements indicate that manufacturing for both viral and non-viral vectors is set for significant growth, positioning them as essential contributors to the upcoming wave of genetic therapies.
Viral Vector and Plasmid DNA Manufacturing Market: Key Insights
The report delves into the current state of the global viral vector and plasmid DNA manufacturing market and identifies potential growth opportunities within industry. Some key findings from the report include:
- Presently, over 130 industry players claim to have the necessary capabilities to manufacture different types of viral vectors for in-house requirements and / or contract service engagements.
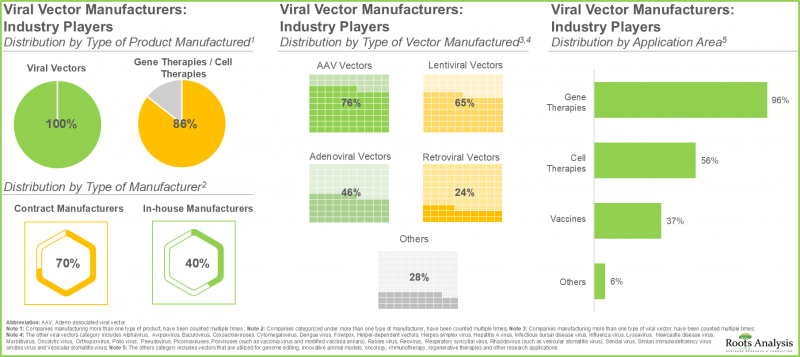
- The current viral vector manufacturing market landscape features the presence of around 70% contract manufacturers; among these, about 20% players have capability to manufacture all types of viral vectors.
- Close to 50% of the companies in this domain have the capability to operate across all three scales of operation, namely preclinical, clinical and commercial.
- We have mapped the locations of facilities established by different vector manufacturers worldwide; notably, Europe emerged as the prominent viral and non-viral vector manufacturing hub.
- Around 85% of the non-industry players are engaged in the manufacturing of AAV vectors; further, close to 80% of the organizations are focused on manufacturing vectors for gene therapy applications.
- Majority (43%) of the technologies are being utilized for manufacturing vectors that can be used for the treatment of neurological disorders, followed by oncological disorders (30%).
- Presently, close to 150 expansions have been undertaken by various players, underscoring the growing interest and investment in the vector-based cell and gene therapy domain.
- The rising interest in this domain is also reflected by the number of partnerships that have been inked in the recent past, involving both international and local stakeholders.
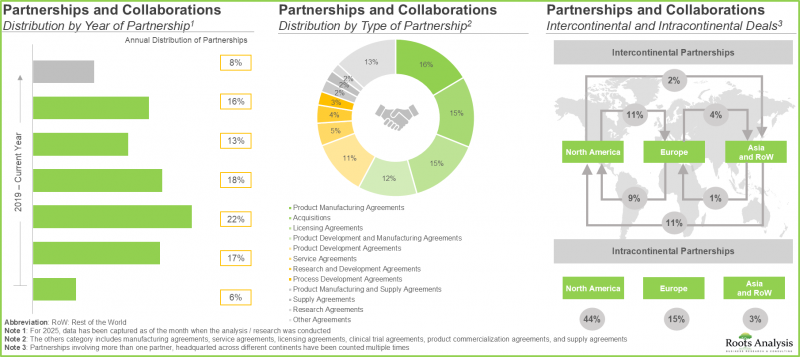
- In order to increase efficiency and optimize the manufacturing processes, several vector and gene therapy innovators are anticipated to forge strategic alliances with vector and gene therapy manufacturers.
- Over 65% of the global installed gene therapy and vector manufacturing capacity is dedicated to viral vector manufacturing; ~55% of viral vector manufacturing capacity is installed in the facilities located in North America.
- Given that there are several types of vectors being evaluated across various stages of development, the demand for such vectors is anticipated to rise significantly over the next decade.
- The overall opportunity associated with vector manufacturing domain is anticipated to grow at the CAGR of 9.87%; it is likely to be well distributed across different, scales of operation, types of vectors and geographical regions.
- Over the long term, vector-based therapies for oncological disorders, which hold more than 60% market share are expected to drive the growth of this market.
Viral Vector and Plasmid DNA Manufacturing Market: Key Segments
Clinical Segment Occupies the Highest Revenue Share in the Viral Vector and Plasmid DNA Manufacturing Market
The market is segmented across various scales of operation such as preclinical, clinical and commercial. As per viral vector and plasmid DNA manufacturing market analysis, in the current year, the clinical segment occupies the higher market share (50%). This is a result of the high demand from numerous ongoing gene and cell therapy clinical trials. It is worth mentioning that the commercial stage segment is likely to witness a significant growth rate with a CAGR of 13% during the forecast period. This results from the advancing cell and gene therapy field, where the majority of therapies are in later development stages and are expected to enter the market in short-term.
Lentiviral Vector Segment Holds the Largest Viral Vector and Plasmid DNA Manufacturing Market Share
In terms of the type of vector manufactured, the overall market includes AAV vectors, adenoviral vectors, lentiviral vectors, retroviral vectors, non-viral vectors and other vectors. In the current year, lentiviral vector segment occupies the higher market share (25%). Several lentiviral vector based gene therapies and cell therapies are currently in the late stage of clinical development. Further, the market is likely to witness a substantial increase in the share of AAV vectors market share, growing at a CAGR of 13% during the forecast period. This is ascribed to advantages offered by AAV vectors, such as efficient transduction of various cell types and their ability to deliver large amounts of DNA.
Gene Therapy is Likely to Capture Majority of the Viral Vector and Plasmid DNA Manufacturing Market Share
Based on application area, the overall marker includes cell therapy, gene therapy and vaccine. Currently, vectors that are used in gene therapy segments occupy the highest market share (49%). This is due to the rising number of approved gene therapies for multiple indications, which has substantially increased the demand for high-quality vector production. Further, the market is likely to witness a substantial increase in the share of vectors that are used for cell therapy manufacturing, growing at a CAGR of 11% during the forecast period. This trend is due to an increasing number of therapies that are currently in clinical trials.
Oncological Disorders Segment Holds the Largest Viral Vector and Plasmid DNA Manufacturing Market Share
As per viral vector and plasmid DNA manufacturing market forecast, in the current year, vector-based therapies for the treatment of oncological disorders occupy the highest market share (47%), due to the growing incidence of such disorders across the globe. Further, vector-based therapies for the treatment of ophthalmic disorders are likely to grow at a CAGR of 31% during the forecast period. This is because of the growing number of approvals for cell and gene therapies for eye disorders.
Contract Manufacturing Segment is Likely to Dominate the Viral Vector and Plasmid DNA Manufacturing Market
This segment highlights the distribution of market across various types of manufacturers, such as contract manufacturing and in-house manufacturing. Currently, contract manufacturer segment (57%) is likely to dominate the market and is expected to grow at a higher CAGR (11%) during the forecast period. This trend arises from the ability of CMOs to provide scalability and flexibility, allowing them to quickly adjust to evolving manufacturing needs and handle increasing production demands.
Asia-Pacific and Middle East and North Africa is Likely to Propel the Growth of the Viral Vector and Plasmid DNA Manufacturing Market
Currently, North America (54%) captures the highest market share. This results from the developed healthcare system and research environment in North America. In contrast, the Asia-Pacific, and Middle East and North Africa markets are expected to expand at a comparatively higher CAGR of 11% each, during the forecast period. This is attributed to the growing prevalence of chronic conditions such as neurological conditions, genetic conditions, and rare illnesses and the heightened need for efficient and sophisticated treatments.
Primary Research Overview
Discussions with multiple stakeholders in this domain influenced the opinions and insights presented in this study. The market report includes transcripts of the following other third-party discussions:
- Chief Executive Officer, mid-sized company, Netherlands
- Chief Executive Officer and Chief Scientific Officer, small company, Germany
- Former Executive and Scientific Director, small company, Belgium
- Co-Founder and President, mid-sized company, France
- Former Director, Netherlands-based company
- Director, Massachusetts-based organization
- Former Scientific Director, France-based organization
- Former Managing Director, small company, Japan
- Scientific Director, small company, US
- Key Account Management, mid-sized company, Germany
- Head of Project Management, small company, Germany
- Director of Business Development, small company, US
- ATMP Key Account Manager, France-based organization
- Chief Scientific Officer, small company, France
- Director of Marketing and Technical Support, mid-sized company, France
- Head of Communications, mid-sized company, Spain
- Independent Consultant
Example Players in the Viral Vector and Plasmid DNA Manufacturing Market
- Advanced BioScience Laboratories
- AGC Biologics
- Aldevron
- Celonic
- Catalent Biologics
- Charles River Laboratories
- Novartis
- Oxford BioMedica
Viral Vector and Plasmid DNA Manufacturing Market: Research Coverage
- Market Sizing and Opportunity Analysis: The report features an in-depth analysis of the viral vector and plasmid DNA manufacturing market, focusing on key market segments, including [A] scale of operation, [B] type of vector manufactured, [C] application area, [D] therapeutic area, [E] type of manufacturer and [F] geographical regions.
- Market Landscape 1: A detailed assessment of the viral vector and plasmid DNA manufacturing market based on several relevant parameters, such as [A] year of establishment, [B] company size, [C] location of headquarters, [D] type of product manufactured, [E] location of manufacturing facility, [F] type of manufacturer, [G] scale of operation, and [H] application area.
- Market Landscape 2: A detailed assessment of the industry players engaged in manufacturing plasmid DNA and gene therapies based on several relevant parameters, such as [A] year of establishment, [B] company size, [C] location of headquarters, [D] type of product manufactured, [E] scale of operation, and [F] application area.
- Market Landscape 3: A detailed assessment of the non-industry players engaged in the manufacturing of viral, non viral and other novel types of vectors and gene therapies, based on relevant parameters such as [A] year of establishment, [B] location of vector manufacturing facility, [C] type of manufacturer, [D] scale of operation, [E] type of vector manufactured and [F] application area.
- Technology Landscape: An in-depth analysis of the technologies offered / developed by the companies engaged in this market, based on the [A] type of technology, [B] purpose of technology, [C] scale of, [D] type of vector, and [E] application area.
- Company Competitiveness Analysis: A comprehensive competitive analysis of key players engaged in manufacturing vectors and gene therapies, examining factors, such as [A] supplier strength [B] manufacturing strength and [C] service strength.
- Company Profiles: In-depth profiles of prominent players based in regions, namely North America, Europe and Asia-Pacific that are currently involved in the viral vector and plasmid DNA manufacturing market, focusing on [A] year of establishment, [B] location of headquarters, [C] product portfolio, [D] manufacturing facilities, [E] recent developments and [F] an informed future outlook.
- Partnerships and Collaborations An insightful analysis of the partnerships and collaborations established in gene therapy, non viral vector and viral vector manufacturing market based on various relevant parameters, including [A] year of partnership, [B] type of partnership, [C] type of partner and [D] most active players.
- Recent Expansions: An analysis of the recent expansions undertaken by various companies in order to augment their respective capabilities related to viral vector and non viral vector manufacturing, based on several parameters, such as [A] year of expansion, [B] type of expansion, [C] type of vector, [D] application area and [E] geographical location of the expansion.
- Strategic Partner Analysis: An insightful analysis evaluating the potential strategic partners (comparing vector based therapy developers and vector purification product developers) for vector and gene therapy product manufacturers, based on several parameters, such as [A] developer strength, [B] product strength, [C] type of vector, [D] therapeutic area and [E] pipeline strength.
- Emerging Vectors: An elaborate discussion on the emerging trends of other viral / non viral gene delivery approaches that are currently in research for the development of therapies involving genetic modification.
- Key Insights: An insightful analysis, highlighting the contemporary market trends in the plasmid DNA and viral vector manufacturing domain, based on relevant parameters, such as (type of vector, scale of operation and type of manufacturer), (type of vector and type of organization) and (location of headquarters and geographical location of key vector manufacturing hubs).
- Cost Price Analysis: An analysis of various factors that are likely to influence the pricing of vectors, featuring different models / approaches that may be adopted by product developers / manufacturers in order to decide the prices of their proprietary vectors.
- Go / No-Go Framework Analysis: An insightful go / no-go framework analysis, highlighting various factors that needs to be considered by viral vector and non viral vector manufacturing companies while deciding whether to manufacture their respective products in-house or engage the services of a CMO.
- Porter's Five Forces Analysis: A qualitative analysis, highlighting the five competitive forces prevalent in gene therapy, non viral vector and viral vector manufacturing market, including [A] threats for new entrants, [B] bargaining power of drug developers, [C] bargaining power of vector and gene therapy manufacturers, [D] threats of substitute technologies and [E] rivalry among existing competitors.
- Capacity Analysis: An estimate of the overall, installed vector manufacturing capacity of industry players based on the information available in the public domain, and insights generated from both secondary and primary research. The analysis also highlights the distribution of global capacity by company size (small, mid-sized and large), location of headquarters (region) (North America, Europe, Asia Pacific and the rest of the world) and location of manufacturing facility.
- Demand Analysis: An in-depth analysis to estimate the current and future demand for viral vectors and non viral vectors, taking into consideration the marketed gene therapies and clinical studies evaluating vector-based therapies, based on various relevant parameters, such as [A] target patient population, [B] dosing frequency and [C] dose strength.
- Market Impact Analysis: An in-depth analysis of the factors that can impact the growth of gene therapy, non viral vector and viral vector manufacturing market. It also features identification and analysis of [A] key drivers, [B] potential restraints, [C] emerging opportunities, and [D] existing challenges.
Key Questions Answered in this Report
- How many companies are currently engaged in this market?
- Which are the leading companies in this market?
- What is the current global capacity of developers?
- What factors are likely to influence the evolution of this market?
- What is the current and future market size?
- What is the CAGR of this market?
- How is the current and future market opportunity likely to be distributed across key market segments?
Reasons to Buy this Report
- The report provides a comprehensive market analysis, offering detailed revenue projections of the overall market and its specific sub-segments. This information is valuable to both established market leaders and emerging entrants.
- Stakeholders can leverage the report to gain a deeper understanding of the competitive dynamics within the market. By analyzing the competitive landscape, businesses can make informed decisions to optimize their market positioning and develop effective go-to-market strategies.
- The report offers stakeholders a comprehensive overview of the market, including key drivers, barriers, opportunities, and challenges. This information empowers stakeholders to stay abreast of market trends and make data-driven decisions to capitalize on growth prospects.
Additional Benefits
- Complimentary PPT Insights Packs
- Complimentary Excel Data Packs for all Analytical Modules in the Report
- 15% Free Content Customization
- Detailed Report Walkthrough Session with Research Team
- Free Updated report if the report is 6-12 months old or older
TABLE OF CONTENTS
1. PREFACE
- 1.1. Introduction
- 1.2. Key Market Insights
- 1.3. Scope of the Report
- 1.4. Key Questions Answered
- 1.5. Chapter Outlines
2. RESEARCH METHODOLOGY
- 2.1. Chapter Overview
- 2.2. Research Assumptions
- 2.2.1. Market Landscape and Market Trends
- 2.2.2. Market Forecast and Opportunity Analysis
- 2.2.3. Comparative Analysis
- 2.3. Database Building
- 2.3.1. Data Collection
- 2.3.2. Data Validation
- 2.3.3. Data Analysis
- 2.4. Project Methodology
- 2.4.1. Secondary Research
- 2.4.1.1. Annual Reports
- 2.4.1.2. Academic Research Papers
- 2.4.1.3. Company Websites
- 2.4.1.4. Investor Presentations
- 2.4.1.5. Regulatory Filings
- 2.4.1.6. White Papers
- 2.4.1.7. Industry Publications
- 2.4.1.8. Conferences and Seminars
- 2.4.1.9. Government Portals
- 2.4.1.10. Media and Press Releases
- 2.4.1.11. Newsletters
- 2.4.1.12. Industry Databases
- 2.4.1.13. Roots Proprietary Databases
- 2.4.1.14. Paid Databases and Sources
- 2.4.1.15. Social Media Portals
- 2.4.1.16. Other Secondary Sources
- 2.4.2. Primary Research
- 2.4.2.1. Types of Primary Research
- 2.4.2.1.1. Qualitative Research
- 2.4.2.1.2. Quantitative Research
- 2.4.2.1.3. Hybrid Approach
- 2.4.2.2. Advantages of Primary Research
- 2.4.2.3. Techniques for Primary Research
- 2.4.2.3.1. Interviews
- 2.4.2.3.2. Surveys
- 2.4.2.3.3. Focus Groups
- 2.4.2.3.4. Observational Research
- 2.4.2.3.5. Social Media Interactions
- 2.4.2.4. Key Opinion Leaders Considered in Primary Research
- 2.4.2.4.1. Company Executives (CXOs)
- 2.4.2.4.2. Board of Directors
- 2.4.2.4.3. Company Presidents and Vice Presidents
- 2.4.2.4.4. Research and Development Heads
- 2.4.2.4.5. Technical Experts
- 2.4.2.4.6. Subject Matter Experts
- 2.4.2.4.7. Scientists
- 2.4.2.4.8. Doctors and Other Healthcare Providers
- 2.4.2.5. Ethics and Integrity
- 2.4.2.5.1. Research Ethics
- 2.4.2.5.2. Data Integrity
- 2.4.2.1. Types of Primary Research
- 2.4.3. Analytical Tools and Databases
- 2.4.1. Secondary Research
- 2.5. Robust Quality Control
3. MARKET DYNAMICS
- 3.1. Chapter Overview
- 3.2. Forecast Methodology
- 3.2.1. Top-down Approach
- 3.2.2. Bottom-up Approach
- 3.2.3. Hybrid Approach
- 3.3. Market Assessment Framework
- 3.3.1. Total Addressable Market (TAM)
- 3.3.2. Serviceable Addressable Market (SAM)
- 3.3.3. Serviceable Obtainable Market (SOM)
- 3.3.4. Currently Acquired Market (CAM)
- 3.4. Forecasting Tools and Techniques
- 3.4.1. Qualitative Forecasting
- 3.4.2. Correlation
- 3.4.3. Regression
- 3.4.4. Extrapolation
- 3.4.5. Convergence
- 3.4.6. Sensitivity Analysis
- 3.4.7. Scenario Planning
- 3.4.8. Data Visualization
- 3.4.9. Time Series Analysis
- 3.4.10. Forecast Error Analysis
- 3.5. Key Considerations
- 3.5.1. Demographics
- 3.5.2. Government Regulations
- 3.5.3. Reimbursement Scenarios
- 3.5.4. Market Access
- 3.5.5. Supply Chain
- 3.5.6. Industry Consolidation
- 3.5.7. Pandemic / Unforeseen Disruptions Impact
- 3.6. Limitations
4. MACRO-ECONOMIC INDICATORS
- 4.1. Chapter Overview
- 4.2. Market Dynamics
- 4.2.1. Time Period
- 4.2.1.1. Historical Trends
- 4.2.1.2. Current and Forecasted Estimates
- 4.2.2. Currency Coverage
- 4.2.2.1. Major Currencies Affecting the Market
- 4.2.2.2. Factors Affecting Currency Fluctuations
- 4.2.2.3. Impact of Currency Fluctuations on the Industry
- 4.2.3. Foreign Currency Exchange Rate
- 4.2.3.1. Impact of Foreign Exchange Rate Volatility on the Market
- 4.2.3.2. Strategies for Mitigating Foreign Exchange Risk
- 4.2.4. Recession
- 4.2.4.1. Assessment of Current Economic Conditions and Potential Impact on the Market
- 4.2.4.2. Historical Analysis of Past Recessions and Lessons Learnt
- 4.2.5. Inflation
- 4.2.5.1. Measurement and Analysis of Inflationary Pressures in the Economy
- 4.2.5.2. Potential Impact of Inflation on the Market Evolution
- 4.2.6. Interest Rates
- 4.2.6.1. Interest Rates and Their Impact on the Market
- 4.2.6.2. Strategies for Managing Interest Rate Risk
- 4.2.7. Commodity Flow Analysis
- 4.2.7.1. Type of Commodity
- 4.2.7.2. Origins and Destinations
- 4.2.7.3. Values and Weights
- 4.2.7.4. Modes of Transportation
- 4.2.8. Global Trade Dynamics
- 4.2.8.1. Import Scenario
- 4.2.8.2. Export Scenario
- 4.2.8.3. Trade Policies
- 4.2.8.4. Strategies for Mitigating the Risks Associated with Trade Barriers
- 4.2.8.5. Impact of Trade Barriers on the Market
- 4.2.9. War Impact Analysis
- 4.2.9.1. Russian-Ukraine War
- 4.2.9.2. Israel-Hamas War
- 4.2.10. COVID Impact / Related Factors
- 4.2.10.1. Global Economic Impact
- 4.2.10.2. Industry-specific Impact
- 4.2.10.3. Government Response and Stimulus Measures
- 4.2.10.4. Future Outlook and Adaptation Strategies
- 4.2.11. Other Indicators
- 4.2.11.1. Fiscal Policy
- 4.2.11.2. Consumer Spending
- 4.2.11.3. Gross Domestic Product
- 4.2.11.4. Employment
- 4.2.11.5. Taxes
- 4.2.11.6. Stock Market Performance
- 4.2.11.7. Cross Border Dynamics
- 4.2.1. Time Period
5. EXECUTIVE SUMMARY
6. INTRODUCTION
- 6.1. Chapter Overview
- 6.2. Viral and Non-Viral Gene Transfer Techniques
- 6.3. Viral Vectors Used in Genetically Modified Therapies
- 6.4. Types of Viral Vectors
- 6.4.1. Adeno-associated Viral Vectors
- 6.4.1.1. Overview
- 6.4.1.2. Design and Manufacturing
- 6.4.1.3. Advantages
- 6.4.1.4. Limitations
- 6.4.2. Adenoviral Vectors
- 6.4.2.1. Overview
- 6.4.2.2. Design and Manufacturing
- 6.4.2.3. Advantages
- 6.4.2.4. Limitations
- 6.4.3. Lentiviral Vectors
- 6.4.3.1. Overview
- 6.4.3.2. Design and Manufacturing
- 6.4.3.3. Advantages
- 6.4.3.4. Limitations
- 6.4.4. Retroviral Vectors
- 6.4.4.1. Overview
- 6.4.4.2. Design and Manufacturing
- 6.4.4.3. Advantages
- 6.4.4.4. Limitations
- 6.4.5. Other Viral Vectors
- 6.4.5.1. Alphavirus
- 6.4.5.2. Foamy Virus
- 6.4.5.3. Herpes Simplex Virus
- 6.4.5.4. Sendai Virus
- 6.4.5.5. Simian Virus
- 6.4.5.6. Vaccinia Virus
- 6.4.5.7. Chimeric Viral Vectors
- 6.4.1. Adeno-associated Viral Vectors
- 6.5. Types of Non-Viral Vectors
- 6.5.1. Plasmid DNA
- 6.5.2. Liposomes, Lipoplexes and Polyplexes
- 6.5.3. Oligonucleotides
- 6.5.4. Other Non-Viral Vectors
- 6.6. Gene Delivery using Non-Viral Vectors
- 6.6.1. Biolistic Methods
- 6.6.2. Electroporation
- 6.6.3. Receptor Mediated Gene Delivery
- 6.6.4. Gene Activated Matrix (GAM)
- 6.7. Applications of Viral and Non-Viral Vectors
- 6.7.1. Cell and Gene Therapy
- 6.7.2. Vaccine
- 6.8. Current / Ongoing Trends in Vector Development / Manufacturing
- 6.8.1. Vector Engineering
- 6.8.2. Cargo Engineering
- 6.9. Vector Manufacturing
- 6.9.1. Types of Vector Manufacturers
- 6.9.2. Viral Vector Manufacturing Processes
- 6.9.2.1. Vector Production
- 6.9.2.2. Adherent and Suspension Cultures
- 6.9.2.3. Unit Process Versus Multiple Parallel Processes
- 6.9.2.4. Cell Culture Systems for Production of Viral Vectors
- 6.9.2.4.1. Small Scale / Laboratory Scale Cell Culture Systems
- 6.9.2.4.2. Large Scale Cell Culture Systems
- 6.9.2.4.2.1. Stirred Tank Reactor Systems
- 6.9.2.4.2.2. Fixed Bed Reactors / Packed Bed Reactors
- 6.9.2.4.2.3. Wave Bioreactor Systems
- 6.9.2.5. Serum-Containing versus Serum-Free Media
- 6.9.3. Bioprocessing of Viral Vectors
- 6.9.3.1. AAV Vector Production
- 6.9.3.2. Adenoviral Vector Production
- 6.9.3.3. Lentiviral Vector Production
- 6.9.3.4. Y -Retroviral Vector Production
- 6.9.4. Key Challenges Associated with Vector Manufacturing
- 6.10. Future Perspectives
7. VIRAL VECTOR MANUFACTURERS (INDUSTRY PLAYERS): MARKET LANDSCAPE
- 7.1. Chapter Overview
- 7.2. Viral Vector and Gene Therapy Manufacturers: Overall Market Landscape
- 7.2.1. Analysis by Year of Establishment
- 7.2.2. Analysis by Company Size
- 7.2.3. Analysis by Location of Headquarters
- 7.2.4. Analysis by Type of Product Manufactured
- 7.2.5. Analysis by Type of Manufacturer
- 7.2.6. Analysis by Scale of Operation
- 7.2.7. Analysis by Type of Viral Vector Manufactured
- 7.2.8. Analysis by Application Area
8. PLASMID DNA MANUFACTURERS (INDUSTRY PLAYERS): MARKET LANDSCAPE
- 8.1. Chapter Overview
- 8.2. Plasmid DNA and Gene Therapy Manufacturers: Overall Market Landscape
- 8.2.1. Analysis by Year of Establishment
- 8.2.2. Analysis by Company Size
- 8.2.3. Analysis by Location of Headquarters
- 8.2.4. Analysis by Type of Company
- 8.2.5. Analysis by Type of Venture
- 8.2.6. Analysis by Type of Services Offered
- 8.2.7. Analysis by Type of Plasmid DNA Manufactured
- 8.2.8. Analysis by Grade of Plasmid DNA Manufactured
- 8.2.9. Analysis by Cell Bank
- 8.2.10. Analysis by Scale of Operation
- 8.2.11. Analysis by Application Area
- 8.2.12. Analysis by Viral Vector Used
- 8.2.13. Analysis by Type of Vaccine Developed
- 8.2.14. Analysis by Number of Facilities
9. VIRAL VECTOR AND PLASMID DNA MANUFACTURERS (NON-INDUSTRY PLAYERS): MARKET LANDSCAPE
- 9.1. Chapter Overview
- 9.2. Viral Vector and Plasmid DNA Manufacturers (Non-Industry Players): Overall Market Landscape
- 9.2.1. Analysis by Year of Establishment
- 9.2.2. Analysis by Company Size
- 9.2.3. Analysis by Location of Headquarters
- 9.2.4. Analysis by Type of Vector
- 9.2.5. Analysis by Scale of Operation
- 9.2.6. Analysis by Type of Manufacturer
- 9.2.7. Analysis by Application Area
10. VECTOR MANUFACTURING TECHNOLOGIES LANDSCAPE
- 10.1. Chapter Overview
- 10.2. Vector Manufacturing Technologies: Overall Market Landscape
- 10.2.1. Analysis by Type of Technology
- 10.2.2. Analysis by Purpose of Technology
- 10.2.3. Analysis by Scale of Operation
- 10.2.4. Analysis by Type of Vector
- 10.2.5. Analysis by Application Area
- 10.2.6. Most Active Players: Analysis by Number of Technologies
11. COMPANY COOMPETITIVENESS ANALYSIS
- 11.1. Chapter Overview
- 11.2. Methodology and Key Parameters
- 11.3. Viral Vector Manufacturers: Company Competitiveness Analysis
- 11.3.1. Players based in North America
- 11.3.2. Players based in Europe
- 11.3.3. Players based in Asia-Pacific and Rest of the World
- 11.4. Plasmid DNA Manufacturers: Company Competitiveness Analysis
- 11.4.1. Players based in North America
- 11.4.2. Players based in Europe
- 11.4.3. Players based in Asia-Pacific and Rest of the World
12. VECTOR MANUFACTURERS BASED IN NORTH AMERICA
- 12.1. Chapter Overview
- 12.2. Key Players
- 12.2.1. Advanced BioScience Laboratories
- 12.2.1.1. Company Overview
- 12.2.1.2. Vector Manufacturing Portfolio
- 12.2.1.3. Recent Developments and Future Outlook
- 12.2.2. Catalent Biologics
- 12.2.2.1. Company Overview
- 12.2.2.2. Financial Information
- 12.2.2.3. Vector Manufacturing Portfolio
- 12.2.2.4. Recent Developments and Future Outlook
- 12.2.3. Charles River Laboratories
- 12.2.3.1. Company Overview
- 12.2.3.2. Financial Information
- 12.2.3.3. Vector Manufacturing Portfolio
- 12.2.3.4. Recent Developments and Future Outlook
- 12.2.4. Thermo Fisher Scientific
- 12.2.4.1. Company Overview
- 12.2.4.2. Financial Information
- 12.2.4.3. Vector Manufacturing Portfolio
- 12.2.4.4. Recent Development and Future Outlook
- 12.2.5. VectorBuilder
- 12.2.5.1. Company Overview
- 12.2.5.2. Financial Information
- 12.2.5.3. Vector Manufacturing Portfolio
- 12.2.5.4. Recent Developments and Future Outlook
- 12.2.1. Advanced BioScience Laboratories
- 12.3. Other Key Players
- 12.3.1. AGC Biologics
- 12.3.1.1. Company Overview
- 12.3.1.2. Vector Manufacturing Portfolio
- 12.3.2. Aldevron
- 12.3.2.1. Company Overview
- 12.3.2.2. Vector Manufacturing Portfolio
- 12.3.3. Matica Biotechnology
- 12.3.3.1. Company Overview
- 12.3.3.2. Vector Manufacturing Portfolio
- 12.3.4. Resilience
- 12.3.4.1. Company Overview
- 12.3.4.2. Vector Manufacturing Portfolio
- 12.3.1. AGC Biologics
13. VECTOR MANUFACTURERS BASED IN EUROPE
- 13.1. Chapter Overview
- 13.2. Key Players
- 13.2.1. Lonza
- 13.2.1.1. Company Overview
- 13.2.1.2. Financial Information
- 13.2.1.3. Vector Manufacturing Portfolio
- 13.2.1.4. Recent Developments and Future Outlook
- 13.2.2. Touchlight
- 13.2.2.1. Company Overview
- 13.2.2.2. Vector Manufacturing Portfolio
- 13.2.2.3. Recent Developments and Future Outlook
- 13.2.1. Lonza
- 13.3. Other Key Players
- 13.3.1. BioNTech Innovative Manufacturing Service (a subsidiary of BioNTech)
- 13.3.1.1. Company Overview
- 13.3.1.2. Vector Manufacturing Portfolio
- 13.3.2. Biovian
- 13.3.2.1. Company Overview
- 13.3.2.2. Vector Manufacturing Portfolio
- 13.3.3. Celonic
- 13.3.3.1. Company Overview
- 13.3.3.2. Vector Manufacturing Portfolio
- 13.3.4. Centre for Process Innovation
- 13.3.4.1. Company Overview
- 13.3.4.2. Vector Manufacturing Portfolio
- 13.3.5. CEVEC Pharmaceuticals
- 13.3.5.1. Company Overview
- 13.3.5.2. Vector Manufacturing Portfolio
- 13.3.6. NorthX Biologics
- 13.3.6.1. Company Overview
- 13.3.6.2. Vector Manufacturing Portfolio
- 13.3.7. Novartis
- 13.3.7.1. Company Overview
- 13.3.7.2. Vector Manufacturing Portfolio
- 13.3.8. Oxford BioMedica
- 13.3.8.1. Company Overview
- 13.3.8.2. Vector Manufacturing Portfolio
- 13.3.9. Sanofi
- 13.3.9.1. Company Overview
- 13.3.9.2. Vector Manufacturing Portfolio
- 13.3.1. BioNTech Innovative Manufacturing Service (a subsidiary of BioNTech)
14. VECTOR MANUFACTURERS BASED IN ASIA-PACIFIC
15. VECTOR MANUFACTURERS IN ASIA-PACIFIC
- 15.1. Chapter Overview
- 15.2. Key Players
- 15.2.1. CoJourney
- 15.2.1.1. Company Overview
- 15.2.1.2. Vector Manufacturing Portfolio
- 15.2.1.3. Recent Developments and Future Outlook
- 15.2.2. Esco Aster
- 15.2.2.1. Company Overview
- 15.2.2.2. Vector Manufacturing Portfolio
- 15.2.2.3. Recent Developments and Future Outlook
- 15.2.3. Wuxi AppTec
- 15.2.3.1. Company Overview
- 15.2.3.2. Financial Information
- 15.2.3.3. Vector Manufacturing Portfolio
- 15.2.3.4. Recent Developments and Future Outlook
- 15.2.1. CoJourney
- 15.3. Other Key Players
- 15.3.1. Altruist Biotechnology
- 15.3.1.1. Company Overview
- 15.3.1.2. Vector Manufacturing Portfolio
- 15.3.2. Jiangsu Puxin Biopharmaceutical
- 15.3.2.1. Company Overview
- 15.3.2.2. Vector Manufacturing Portfolio
- 15.3.3. Nikon CeLL innovation
- 15.3.3.1. Company Overview
- 15.3.3.2. Vector Manufacturing Portfolio
- 15.3.1. Altruist Biotechnology
16. PORTER'S FIVE FORCES ANALYSIS
- 16.1. Chapter Overview
- 16.2. Methodology and Assumptions
- 16.3. Key Parameters
- 16.3.1. Threats of New Entrants
- 16.3.2. Bargaining Power of Suppliers
- 16.3.3. Bargaining Power of Buyers
- 16.3.4. Threats of Substitute Products
- 16.3.5. Rivalry Among Existing Competitors
- 16.4. Concluding Remarks
17. PARTNERSHIPS AND COLLAORATIONS
- 17.1. Chapter Overview
- 17.2. Partnership Models
- 17.3. Vector Manufacturing: Partnerships and Collaborations
- 17.3.1. Analysis by Year of Partnership
- 17.3.2. Analysis by Type of Partnership
- 17.3.3. Analysis by Scale of Operation
- 17.3.4. Analysis by Type of Vector Manufactured
- 17.3.5. Analysis by Therapeutic Area
- 17.3.6. Analysis by Application Area
- 17.3.7. Most Active Players: Analysis by Number of Partnerships
- 17.3.8. Analysis by Geography
- 17.3.8.1. Local and International Agreements
- 17.3.8.2. Intercontinental and Intracontinental Agreements
18. RECENT EXPANSIONS
- 18.1. Chapter Overview
- 18.2. Type of Expansions
- 18.3. Vector Manufacturing: Recent Expansions
- 18.3.1. Analysis by Year of Expansion
- 18.3.2. Analysis by Type of Expansion
- 18.3.3. Analysis by Year and Type of Expansion
- 18.3.4. Most Active Players: Analysis by Number of Expansions
- 18.3.5. Most Active Players: Analysis by Amount Invested
- 18.3.6. Analysis by Type of Manufacturing Facility
- 18.3.7. Analysis by Scale of Operation
- 18.3.8. Analysis by Type of Vector Manufactured
- 18.3.9. Analysis by Application Area
- 18.3.10. Analysis by Geography
- 18.3.10.1. Intercontinental and Intracontinental Expansions
- 18.3.10.2. Analysis by Location of Expansion
19. STRATEGIC PARTNER ANAYSIS
- 19.1. Chapter Overview
- 19.2. Methodology and Key Parameters
- 19.3. Strategic Partner Analysis: Viral Vector based Therapy Developers
- 19.3.1. Opportunity for AAV Vector based Therapy Developers
- 19.3.1.1. Most Likely Partners
- 19.3.1.2. Likely Partners
- 19.3.1.3. Less Likely Partners
- 19.3.1.4. Least Likely Partners
- 19.3.2. Opportunity for Adenoviral Vector based Therapy Developers
- 19.3.2.1. Most Likely Partners
- 19.3.2.2. Likely Partners
- 19.3.2.3. Less Likely Partners
- 19.3.2.4. Least Likely Partners
- 19.3.3. Opportunity for Lentiviral Vector based Therapy Developers
- 19.3.3.1. Most Likely Partners
- 19.3.3.2. Likely Partners
- 19.3.3.3. Less Likely Partners
- 19.3.3.4. Least Likely Partners
- 19.3.4. Opportunity for Retroviral Vector based Therapy Developers
- 19.3.4.1. Most Likely Partners
- 19.3.4.2. Likely Partners
- 19.3.4.3. Less Likely Partners
- 19.3.4.4. Least Likely Partners
- 19.3.5. Opportunity for Other Viral Vector based Therapy Developers
- 19.3.5.1. Most Likely Partners
- 19.3.5.2. Likely Partners
- 19.3.5.3. Less Likely Partners
- 19.3.5.4. Least Likely Partners
- 19.3.1. Opportunity for AAV Vector based Therapy Developers
20. EMERGING VECTORS
- 20.1. Chapter Overview
- 20.1.1. Alphavirus based Vectors
- 20.1.2. Anc80 based Vectors
- 20.1.3. Bifidobacterium longum based Vectors
- 20.1.4. Cytomegalovirus based Vectors
- 20.1.5. Listeria monocytogenes based Vectors
- 20.1.6. Minicircle DNA based Vectors
- 20.1.7. Myxoma Virus based Vectors
- 20.1.8. Self-Complementary Vectors
- 20.1.9. Sendai Virus based Vectors
- 20.1.10. Sleeping Beauty Transposons
- 20.1.11. Vaccinia Virus and Modified Vaccinia Ankara based Vectors
- 20.1.12. Chimeric Viral Vectors
21. KEY INSIGHTS
- 21.1. Chapter Overview
- 21.2. Vector and Gene Therapy Manufacturers: Key Insights
- 21.2.1. Analysis by Type of Manufacturer, Type of Vector Manufactured and Scale of Operation
- 21.2.2. Analysis by Type of Vector Manufactured and Company Size
- 21.2.3. Analysis by Type of Organization and Geography
- 21.2.3.1. Contract Manufacturing Organizations
- 21.2.3.2. In-House Manufacturers
- 21.2.3.3. In-House and Contract Manufacturing Organizations
- 21.2.4. Analysis by Type of Vector Manufactured and Location of Headquarters
- 21.2.4.1. AAV Vector Manufacturers
- 21.2.4.2. Adenoviral Vector Manufacturers
- 21.2.4.3. Lentiviral Vector Manufacturers
- 21.2.4.4. Retroviral Vector Manufacturers
- 21.2.4.5. Plasmid DNA Manufacturers
22. COST PRICE ANALYSIS
- 22.1. Chapter Overview
- 22.2. Factors Contributing to High Price of Viral Vector and Plasmid DNA based Therapies
- 22.3. Viral Vector and Plasmid DNA based Therapies: Pricing Models
- 22.3.1. Pricing Models Based on Expert Opinions
- 22.3.2. Pricing Models Based on Manufacturing Cost
- 22.3.2.1. Pricing Models Based on Technology Used
- 22.3.2.2. Pricing Models Based on Scale of Operation
- 22.3.2.3. Pricing Models Based on Type of Client
- 22.3.3. Prices of Different Types of Vectors
- 22.4. Concluding Remarks
23. OUTSOURCING: GO / NO-GO FRAMEWORK
- 23.1. Chapter Overview
- 23.2. Outsourcing: Go / No-Go Framework
- 23.3. Vector Manufacturing Outsourcing: Go / No-Go Framework
- 23.3.1. Key Parameters and Assumptions
- 23.3.2. Methodology
- 23.3.3. Results and Interpretations
- 23.3.3.1. Outsourcing: Go / No-Go Framework for Small Companies
- 23.3.3.2. Outsourcing: Go / No-Go Framework for Mid-Sized Companies
- 23.3.3.3. Outsourcing: Go / No-Go Framework for Large Companies
24. CAPACITY ANALYSIS
- 24.1. Chapter Overview
- 24.2. Methodology and Key Assumptions
- 24.3. Viral Vector and Plasmid DNA Manufacturing: Global Installed Capacity
- 24.4. Viral Vector Manufacturing: Global Installed Capacity
- 24.4.1. Analysis by Company Size
- 24.4.2. Analysis by Scale of Operation
- 24.4.3. Analysis by Location of Headquarters (Region)
- 24.4.4. Analysis by Location of Manufacturing Facility
- 24.5. Plasmid DNA Manufacturing: Global Installed Capacity
- 24.5.1. Analysis by Company Size
- 24.5.2. Analysis by Scale of Operation
- 24.5.3. Analysis by Location of Headquarters (Region)
- 24.5.4. Analysis by Location of Manufacturing Facility
25. DEMAND ANALYSIS
- 25.1. Chapter Overview
- 25.2. Assumptions and Methodology
- 25.3. Global Demand for Viral Vectors and Plasmid DNA, Till 2035
- 25.4. Global Clinical Demand for Viral Vectors and Plasmid DNA, Till 2035
- 25.4.1. Analysis by Type of Vector
- 25.4.2. Analysis by Type of Therapy
- 25.4.3. Analysis by Therapeutic Area
- 25.4.4. Analysis by Geography
- 25.5. Global Commercial Demand for Viral Vectors and Plasmid DNA, Till 2035
- 25.5.1. Analysis by Type of Vector
- 25.5.2. Analysis by Type of Therapy
- 25.5.3. Analysis by Therapeutic Area
- 25.5.4. Analysis by Geography
- 25.6. Demand and Supply Analysis
26. MARKET IMPACT ANALYSIS: DRIVERS, RESTRAINTS, OPPORTUNITIES AND CHALLENGES
- 26.1. Chapter Overview
- 26.2. Market Drivers
- 26.3. Market Restraints
- 26.4. Market Opportunities
- 26.5. Market Challenges
27. GLOBAL VECTOR MANUFACTURING MARKET
- 27.1. Chapter Overview
- 27.2. Key Assumptions and Methodology
- 27.3. Global Vector Manufacturing Market, Historical Trends (2018-2022) and Forecasted Estimates (2023-2035)
- 27.3.1. Scenario Analysis
- 27.3.1.1. Conservative Scenario
- 27.3.1.2. Optimistic Scenario
- 27.3.1. Scenario Analysis
- 27.4. Key Market Segmentations
28. VECTOR MANUFACTURING MARKET, BY SCALE OF OPERATION
- 28.1. Chapter Overview
- 28.2. Key Assumptions and Methodology
- 28.3. Vector Manufacturing Market: Distribution by Scale of Operation
- 28.3.1. Preclinical Scale: Historical Trends (Since 2021) and Forecasted Estimates (Till 2035)
- 28.3.2. Clinical Scale: Historical Trends (Since 2021) and Forecasted Estimates (Till 2035)
- 28.3.3. Commercial Scale: Historical Trends (Since 2021) and Forecasted Estimates (Till 2035)
- 28.4. Data Triangulation and Validation
29. VECTOR MANUFACTURING MARKET, BY TYPE OF VECTOR MANUFACTURED
- 29.1. Chapter Overview
- 29.2. Key Assumptions and Methodology
- 29.3. Vector Manufacturing Market: Distribution by Type of Vector
- 29.3.1. AAV Vectors: Historical Trends (Since 2021) and Forecasted Estimates (Till 2035)
- 29.3.2. Adenoviral Vectors: Historical Trends (Since 2021) and Forecasted Estimates (Till 2035)
- 29.3.3. Lentiviral Vectors: Historical Trends (Since 2021) and Forecasted Estimates (Till 2035)
- 29.3.4. Retroviral Vectors: Historical Trends (Since 2021) and Forecasted Estimates (Till 2035)
- 29.3.5. Non-Viral Vectors: Historical Trends (Since 2021) and Forecasted Estimates (Till 2035)
- 29.3.6. Other Vectors: Historical Trends (Since 2021) and Forecasted Estimates (Till 2035)
- 29.4. Data Triangulation and Validation
30. VECTOR MANUFACTURING MARKET, BY APPLICATION AREA
- 30.1. Chapter Overview
- 30.2. Key Assumptions and Methodology
- 30.3. Vector Manufacturing Market: Distribution by Application Area
- 30.3.1. Cell Therapy: Historical Trends (Since 2021) and Forecasted Estimates (Till 2035)
- 30.3.2. Gene Therapy: Historical Trends (Since 2021) and Forecasted Estimates (Till 2035)
- 30.3.3. Vaccines: Historical Trends (Since 2021) and Forecasted Estimates (Till 2035)
- 30.4. Data Triangulation and Validation
31. VECTOR MANUFACTURING MARKET, BY THERAPEUTIC AREA
- 31.1. Chapter Overview
- 31.2. Key Assumptions and Methodology
- 31.3. Vector Manufacturing Market: Distribution by Therapeutic Area
- 31.3.1. Oncological Disorders: Historical Trends (Since 2021) and Forecasted Estimates (Till 2035)
- 31.3.2. Rare Disorders: Historical Trends (Since 2021) and Forecasted Estimates (Till 2035)
- 31.3.3. Immunological Disorders: Historical Trends (Since 2021) and Forecasted Estimates (Till 2035)
- 31.3.4. Neurological Disorders: Historical Trends (Since 2021) and Forecasted Estimates (Till 2035)
- 31.3.5. Sensory Disorders: Historical Trends (Since 2021) and Forecasted Estimates (Till 2035)
- 31.3.6. Metabolic Disorders: Historical Trends (Since 2021) and Forecasted Estimates (Till 2035)
- 31.3.7. Blood Disorders: Historical Trends (Since 2021) and Forecasted Estimates (Till 2035)
- 31.3.8. Musculoskeletal Disorders: Historical Trends (Since 2021) and Forecasted Estimates (Till 2035)
- 31.3.9. Infectious Diseases: Historical Trends (Since 2021) and Forecasted Estimates (Till 2035)
- 31.3.10. Ophthalmic Disorders: Historical Trends (Since 2021) and Forecasted Estimates (Till 2035)
- 31.3.11. Other Disorders: Historical Trends (Since 2021) and Forecasted Estimates (Till 2035)
- 31.4. Data Triangulation and Validation
32. VECTOR MANUFACTURING MARKET, BY TYPE OF MANUFACTURER
- 32.1. Chapter Overview
- 32.2. Key Assumptions and Methodology
- 32.3. Vector Manufacturing Market: Distribution by Type of Manufacturer
- 32.3.1. In-house Manufacturers: Historical Trends (Since 2021) and Forecasted Estimates (Till 2035)
- 32.3.2. Contract Manufacturing Organizations: Historical Trends (Since 2021) and Forecasted Estimates (Till 2035)
- 32.4. Data Triangulation and Validation
33. VECTOR MANUFACTURING MARKET, BY GEOGRAPHICAL REGION
- 33.1. Chapter Overview
- 33.2. Key Assumptions and Methodology
- 33.3. Vector Manufacturing Market: Distribution by Geographical Region
- 33.3.1. North America: Historical Trends (Since 2021) and Forecasted Estimates (Till 2035)
- 33.3.2. Europe: Historical Trends (Since 2021) and Forecasted Estimates (Till 2035)
- 33.3.3. Asia-Pacific: Historical Trends (Since 2021) and Forecasted Estimates (Till 2035)
- 33.3.4. Middle East and North Africa: Historical Trends (Since 2021) and Forecasted Estimates (Till 2035)
- 33.3.5. Latin America and Rest of the World: Historical Trends (Since 2021) and Forecasted Estimates (Till 2035)
- 33.4. Data Triangulation and Validation
34. MARKET OPPORTUNITY ANALYSIS: NORTH AMERICA
- 34.1. Vector Manufacturing Market in North America: Distribution by Scale of Operation
- 34.1.1. Vector Manufacturing Market in North America for Preclinical, Historical Trends (Since 2021) and Forecasted Estimates (Till 2035)
- 34.1.2. Vector Manufacturing Market in North America for Clinical, Historical Trends (Since 2021) and Forecasted Estimates (Till 2035)
- 34.1.3. Vector Manufacturing Market in North America for Commercial, Historical Trends (Since 2021) and Forecasted Estimates (Till 2035)
- 34.2. Vector Manufacturing Market in North America: Distribution by Type of Vector Manufactured
- 34.2.1. Vector Manufacturing Market in North America for AAV Vectors, Historical Trends (Since 2021) and Forecasted Estimates (Till 2035)
- 34.2.2. Vector Manufacturing Market in North America for Adenoviral Vectors, Historical Trends (Since 2021) and Forecasted Estimates (Till 2035)
- 34.2.3. Vector Manufacturing Market in North America for Lentiviral Vectors, Historical Trends (Since 2021) and Forecasted Estimates (Till 2035)
- 34.2.4. Vector Manufacturing Market in North America for Retroviral Vectors, Historical Trends (Since 2021) and Forecasted Estimates (Till 2035)
- 34.2.5. Vector Manufacturing Market in North America for Non-Viral Vectors, Historical Trends (Since 2021) and Forecasted Estimates (Till 2035)
- 34.2.6. Vector Manufacturing Market in North America for Other Vectors, Historical Trends (Since 2021) and Forecasted Estimates (Till 2035)
- 34.3. Vector Manufacturing Market in North America: Distribution by Application Area
- 34.3.1. Vector Manufacturing Market in North America for Cell Therapy, Historical Trends (Since 2021) and Forecasted Estimates (Till 2035)
- 34.3.2. Vector Manufacturing Market in North America for Gene Therapy, Historical Trends (Since 2021) and Forecasted Estimates (Till 2035)
- 34.3.3. Vector Manufacturing Market in North America for Vaccines, Historical Trends (Since 2021) and Forecasted Estimates (Till 2035)
- 34.4. Vector Manufacturing Market in North America: Distribution by Therapeutic Area
- 34.4.1. Vector Manufacturing Market in North America for Oncological Disorders, Historical Trends (Since 2021) and Forecasted Estimates (Till 2035)
- 34.4.2. Vector Manufacturing Market in North America for Rare Disorders, Historical Trends (Since 2021) and Forecasted Estimates (Till 2035)
- 34.4.3. Vector Manufacturing Market in North America for Immunological Disorders, Historical Trends (Since 2021) and Forecasted Estimates (Till 2035)
- 34.4.4. Vector Manufacturing Market in North America for Neurological Disorders, Historical Trends (Since 2021) and Forecasted Estimates (Till 2035)
- 34.4.5. Vector Manufacturing Market in North America for Sensory Disorders, Historical Trends (Since 2021) and Forecasted Estimates (Till 2035)
- 34.4.6. Vector Manufacturing Market in North America for Metabolic Disorders, Historical Trends (Since 2021) and Forecasted Estimates (Till 2035)
- 34.4.7. Vector Manufacturing Market in North America for Blood Disorders, Historical Trends (Since 2021) and Forecasted Estimates (Till 2035)
- 34.4.8. Vector Manufacturing Market in North America for Musculoskeletal Disorders, Historical Trends (Since 2021) and Forecasted Estimates (Till 2035)
- 34.4.9. Vector Manufacturing Market in North America for Infectious Diseases, Historical Trends (Since 2021) and Forecasted Estimates (Till 2035)
- 34.4.10. Vector Manufacturing Market in North America for Ophthalmic Disorders, Historical Trends (Since 2021) and Forecasted Estimates (Till 2035)
- 34.4.11. Vector Manufacturing Market in North America for Other Disorders, Historical Trends (Since 2021) and Forecasted Estimates (Till 2035)
- 34.5. Vector Manufacturing Market in North America: Distribution by Type of Manufacturer
- 34.5.1. Vector Manufacturing Market in North America for In-house Manufacturer, Historical Trends (Since 2021) and Forecasted Estimates (Till 2035)
- 34.5.2. Vector Manufacturing Market in North America for Contract Manufacturers, Historical Trends (Since 2021) and Forecasted Estimates (Till 2035)
35. MARKET OPPORTUNITY ANALYSIS: EUROPE
- 35.1. Vector Manufacturing Market in Europe: Distribution by Scale of Operation
- 35.1.1. Vector Manufacturing Market in Europe for Preclinical, Historical Trends (Since 2021) and Forecasted Estimates (Till 2035)
- 35.1.2. Vector Manufacturing Market in Europe for Clinical, Historical Trends (Since 2021) and Forecasted Estimates (Till 2035)
- 35.1.3. Vector Manufacturing Market in Europe for Commercial, Historical Trends (Since 2021) and Forecasted Estimates (Till 2035)
- 35.2. Vector Manufacturing Market in Europe: Distribution by Type of Vector Manufactured
- 35.2.1. Vector Manufacturing Market in Europe for AAV Vectors, Historical Trends (Since 2021) and Forecasted Estimates (Till 2035)
- 35.2.2. Vector Manufacturing Market in Europe for Adenoviral Vectors, Historical Trends (Since 2021) and Forecasted Estimates (Till 2035)
- 35.2.3. Vector Manufacturing Market in Europe for Lentiviral Vectors, Historical Trends (Since 2021) and Forecasted Estimates (Till 2035)
- 35.2.4. Vector Manufacturing Market in Europe for Retroviral Vectors, Historical Trends (Since 2021) and Forecasted Estimates (Till 2035)
- 35.2.5. Vector Manufacturing Market in Europe for Non-Viral Vectors, Historical Trends (Since 2021) and Forecasted Estimates (Till 2035)
- 35.2.6. Vector Manufacturing Market in Europe for Other Vectors, Historical Trends (Since 2021) and Forecasted Estimates (Till 2035)
- 35.3. Vector Manufacturing Market in Europe: Distribution by Application Area
- 35.3.1. Vector Manufacturing Market in Europe for Cell Therapy, Historical Trends (Since 2021) and Forecasted Estimates (Till 2035)
- 35.3.2. Vector Manufacturing Market in Europe for Gene Therapy, Historical Trends (Since 2021) and Forecasted Estimates (Till 2035)
- 35.3.3. Vector Manufacturing Market in Europe for Vaccines, Historical Trends (Since 2021) and Forecasted Estimates (Till 2035)
- 35.4. Vector Manufacturing Market in Europe: Distribution by Therapeutic Area
- 35.4.1. Vector Manufacturing Market in Europe for Oncological Disorders, Historical Trends (Since 2021) and Forecasted Estimates (Till 2035)
- 35.4.2. Vector Manufacturing Market in Europe for Rare Disorders, Historical Trends (Since 2021) and Forecasted Estimates (Till 2035)
- 35.4.3. Vector Manufacturing Market in Europe for Immunological Disorders, Historical Trends (Since 2021) and Forecasted Estimates (Till 2035)
- 35.4.4. Vector Manufacturing Market in Europe for Neurological Disorders, Historical Trends (Since 2021) and Forecasted Estimates (Till 2035)
- 35.4.5. Vector Manufacturing Market in Europe for Sensory Disorders, Historical Trends (Since 2021) and Forecasted Estimates (Till 2035)
- 35.4.6. Vector Manufacturing Market in Europe for Metabolic Disorders, Historical Trends (Since 2021) and Forecasted Estimates (Till 2035)
- 35.4.7. Vector Manufacturing Market in Europe for Blood Disorders, Historical Trends (Since 2021) and Forecasted Estimates (Till 2035)
- 35.4.8. Vector Manufacturing Market in Europe for Musculoskeletal Disorders, Historical Trends (Since 2021) and Forecasted Estimates (Till 2035)
- 35.4.9. Vector Manufacturing Market in Europe for Infectious Diseases, Historical Trends (Since 2021) and Forecasted Estimates (Till 2035)
- 35.4.10. Vector Manufacturing Market in Europe for Ophthalmic Disorders, Historical Trends (Since 2021) and Forecasted Estimates (Till 2035)
- 35.4.11. Vector Manufacturing Market in Europe for Other Disorders, Historical Trends (Since 2021) and Forecasted Estimates (Till 2035)
- 35.5. Vector Manufacturing Market in Europe: Distribution by Type of Manufacturer
- 35.5.1. Vector Manufacturing Market in Europe for In-house Manufacturer, Historical Trends (Since 2021) and Forecasted Estimates (Till 2035)
- 35.5.2. Vector Manufacturing Market in Europe for Contract Manufacturers, Historical Trends (Since 2021) and Forecasted Estimates (Till 2035)
36. MARKET OPPORTUNITY ANALYSIS: ASIA-PACIFIC
- 36.1. Vector Manufacturing Market in Asia-Pacific: Distribution by Scale of Operation
- 36.1.1. Vector Manufacturing Market in Asia-Pacific for Preclinical, Historical Trends (Since 2021) and Forecasted Estimates (Till 2035)
- 36.1.2. Vector Manufacturing Market in Asia-Pacific for Clinical, Historical Trends (Since 2021) and Forecasted Estimates (Till 2035)
- 36.1.3. Vector Manufacturing Market in Asia-Pacific for Commercial, Historical Trends (Since 2021) and Forecasted Estimates (Till 2035)
- 36.2. Vector Manufacturing Market in Asia-Pacific: Distribution by Type of Vector Manufactured
- 36.2.1. Vector Manufacturing Market in Asia-Pacific for AAV Vectors, Historical Trends (Since 2021) and Forecasted Estimates (Till 2035)
- 36.2.2. Vector Manufacturing Market in Asia-Pacific for Adenoviral Vectors, Historical Trends (Since 2021) and Forecasted Estimates (Till 2035)
- 36.2.3. Vector Manufacturing Market in Asia-Pacific for Lentiviral Vectors, Historical Trends (Since 2021) and Forecasted Estimates (Till 2035)
- 36.2.4. Vector Manufacturing Market in Asia-Pacific for Retroviral Vectors, Historical Trends (Since 2021) and Forecasted Estimates (Till 2035)
- 36.2.5. Vector Manufacturing Market in Asia-Pacific for Non-Viral Vectors, Historical Trends (Since 2021) and Forecasted Estimates (Till 2035)
- 36.2.6. Vector Manufacturing Market in Asia-Pacific for Other Vectors, Historical Trends (Since 2021) and Forecasted Estimates (Till 2035)
- 36.3. Vector Manufacturing Market in Asia-Pacific: Distribution by Application Area
- 36.3.1. Vector Manufacturing Market in Asia-Pacific for Cell Therapy, Historical Trends (Since 2021) and Forecasted Estimates (Till 2035)
- 36.3.2. Vector Manufacturing Market in Asia-Pacific for Gene Therapy, Historical Trends (Since 2021) and Forecasted Estimates (Till 2035)
- 36.3.3. Vector Manufacturing Market in Asia-Pacific for Vaccines, Historical Trends (Since 2021) and Forecasted Estimates (Till 2035)
- 36.4. Vector Manufacturing Market in Asia-Pacific: Distribution by Therapeutic Area
- 36.4.1. Vector Manufacturing Market in Asia-Pacific for Oncological Disorders, Historical Trends (Since 2021) and Forecasted Estimates (Till 2035)
- 36.4.2. Vector Manufacturing Market in Asia-Pacific for Rare Disorders, Historical Trends (Since 2021) and Forecasted Estimates (Till 2035)
- 36.4.3. Vector Manufacturing Market in Asia-Pacific for Immunological Disorders, Historical Trends (Since 2021) and Forecasted Estimates (Till 2035)
- 36.4.4. Vector Manufacturing Market in Asia-Pacific for Neurological Disorders, Historical Trends (Since 2021) and Forecasted Estimates (Till 2035)
- 36.4.5. Vector Manufacturing Market in Asia-Pacific for Sensory Disorders, Historical Trends (Since 2021) and Forecasted Estimates (Till 2035)
- 36.4.6. Vector Manufacturing Market in Asia-Pacific for Metabolic Disorders, Historical Trends (Since 2021) and Forecasted Estimates (Till 2035)
- 36.4.7. Vector Manufacturing Market in Asia-Pacific for Blood Disorders, Historical Trends (Since 2021) and Forecasted Estimates (Till 2035)
- 36.4.8. Vector Manufacturing Market in Asia-Pacific for Musculoskeletal Disorders, Historical Trends (Since 2021) and Forecasted Estimates (Till 2035)
- 36.4.9. Vector Manufacturing Market in Asia-Pacific for Infectious Diseases, Historical Trends (Since 2021) and Forecasted Estimates (Till 2035)
- 36.4.10. Vector Manufacturing Market in Asia-Pacific for Ophthalmic Disorders, Historical Trends (Since 2021) and Forecasted Estimates (Till 2035)
- 36.4.11. Vector Manufacturing Market in Asia-Pacific for Other Disorders, Historical Trends (Since 2021) and Forecasted Estimates (Till 2035)
- 36.5. Vector Manufacturing Market in Asia-Pacific: Distribution by Type of Manufacturer
- 36.5.1. Vector Manufacturing Market in Asia-Pacific for In-house Manufacturer, Historical Trends (Since 2021) and Forecasted Estimates (Till 2035)
- 36.5.2. Vector Manufacturing Market in Asia-Pacific for Contract Manufacturers, Historical Trends (Since 2021) and Forecasted Estimates (Till 2035)
37. MARKET OPPORTUNITY ANALYSIS: MIDDLE EAST AND NORTH AFRICA
- 37.1. Vector Manufacturing Market in Middle East and North Africa: Distribution by Scale of Operation
- 37.1.1. Vector Manufacturing Market in Middle East and North Africa for Preclinical, Historical Trends (Since 2021) and Forecasted Estimates (Till 2035)
- 37.1.2. Vector Manufacturing Market in Middle East and North Africa for Clinical, Historical Trends (Since 2021) and Forecasted Estimates (Till 2035)
- 37.1.3. Vector Manufacturing Market in Middle East and North Africa for Commercial, Historical Trends (Since 2021) and Forecasted Estimates (Till 2035)
- 37.2. Vector Manufacturing Market in Middle East and North Africa: Distribution by Type of Vector Manufactured
- 37.2.1. Vector Manufacturing Market in Middle East and North Africa for AAV Vectors, Historical Trends (Since 2021) and Forecasted Estimates (Till 2035)
- 37.2.2. Vector Manufacturing Market in Middle East and North Africa for Adenoviral Vectors, Historical Trends (Since 2021) and Forecasted Estimates (Till 2035)
- 37.2.3. Vector Manufacturing Market in Middle East and North Africa for Lentiviral Vectors, Historical Trends (Since 2021) and Forecasted Estimates (Till 2035)
- 37.2.4. Vector Manufacturing Market in Middle East and North Africa for Retroviral Vectors, Historical Trends (Since 2021) and Forecasted Estimates (Till 2035)
- 37.2.5. Vector Manufacturing Market in Middle East and North Africa for Non-Viral Vectors, Historical Trends (Since 2021) and Forecasted Estimates (Till 2035)
- 37.2.6. Vector Manufacturing Market in Middle East and North Africa for Other Vectors, Historical Trends (Since 2021) and Forecasted Estimates (Till 2035)
- 37.3. Vector Manufacturing Market in Middle East and North Africa: Distribution by Application Area
- 37.3.1. Vector Manufacturing Market in Middle East and North Africa for Cell Therapy, Historical Trends (Since 2021) and Forecasted Estimates (Till 2035)
- 37.3.2. Vector Manufacturing Market in Middle East and North Africa for Gene Therapy, Historical Trends (Since 2021) and Forecasted Estimates (Till 2035)
- 37.3.3. Vector Manufacturing Market in Middle East and North Africa for Vaccines, Historical Trends (Since 2021) and Forecasted Estimates (Till 2035)
- 37.4. Vector Manufacturing Market in Middle East and North Africa: Distribution by Therapeutic Area
- 37.4.1. Vector Manufacturing Market in Middle East and North Africa for Oncological Disorders, Historical Trends (Since 2021) and Forecasted Estimates (Till 2035)
- 37.4.2. Vector Manufacturing Market in Middle East and North Africa for Rare Disorders, Historical Trends (Since 2021) and Forecasted Estimates (Till 2035)
- 37.4.3. Vector Manufacturing Market in Middle East and North Africa for Immunological Disorders, Historical Trends (Since 2021) and Forecasted Estimates (Till 2035)
- 37.4.4. Vector Manufacturing Market in Middle East and North Africa for Neurological Disorders, Historical Trends (Since 2021) and Forecasted Estimates (Till 2035)
- 37.4.5. Vector Manufacturing Market in Middle East and North Africa for Sensory Disorders, Historical Trends (Since 2021) and Forecasted Estimates (Till 2035)
- 37.4.6. Vector Manufacturing Market in Middle East and North Africa for Metabolic Disorders, Historical Trends (Since 2021) and Forecasted Estimates (Till 2035)
- 37.4.7. Vector Manufacturing Market in Middle East and North Africa for Blood Disorders, Historical Trends (Since 2021) and Forecasted Estimates (Till 2035)
- 37.4.8. Vector Manufacturing Market in Middle East and North Africa for Musculoskeletal Disorders, Historical Trends (Since 2021) and Forecasted Estimates (Till 2035)
- 37.4.9. Vector Manufacturing Market in Middle East and North Africa for Infectious Diseases, Historical Trends (Since 2021) and Forecasted Estimates (Till 2035)
- 37.4.10. Vector Manufacturing Market in Middle East and North Africa for Ophthalmic Disorders, Historical Trends (Since 2021) and Forecasted Estimates (Till 2035)
- 37.4.11. Vector Manufacturing Market in Middle East and North Africa for Other Disorders, Historical Trends (Since 2021) and Forecasted Estimates (Till 2035)
- 37.5. Vector Manufacturing Market in Middle East and North Africa: Distribution by Type of Manufacturer
- 37.5.1. Vector Manufacturing Market in Middle East and North Africa for In-house Manufacturer, Historical Trends (Since 2021) and Forecasted Estimates (Till 2035)
- 37.5.2. Vector Manufacturing Market in Middle East and North Africa for Contract Manufacturers, Historical Trends (Since 2021) and Forecasted Estimates (Till 2035)
38. MARKET OPPORTUNITY ANALYSIS: LATIN AMERICA
- 38.1. Vector Manufacturing Market in Latin America: Distribution by Scale of Operation
- 38.1.1. Vector Manufacturing Market in Latin America for Preclinical, Historical Trends (Since 2021) and Forecasted Estimates (Till 2035)
- 38.1.2. Vector Manufacturing Market in Latin America for Clinical, Historical Trends (Since 2021) and Forecasted Estimates (Till 2035)
- 38.1.3. Vector Manufacturing Market in Latin America for Commercial, Historical Trends (Since 2021) and Forecasted Estimates (Till 2035)
- 38.2. Vector Manufacturing Market in Latin America: Distribution by Type of Vector Manufactured
- 38.2.1. Vector Manufacturing Market in Latin America for AAV Vectors, Historical Trends (Since 2021) and Forecasted Estimates (Till 2035)
- 38.2.2. Vector Manufacturing Market in Latin America for Adenoviral Vectors, Historical Trends (Since 2021) and Forecasted Estimates (Till 2035)
- 38.2.3. Vector Manufacturing Market in Latin America for Lentiviral Vectors, Historical Trends (Since 2021) and Forecasted Estimates (Till 2035)
- 38.2.4. Vector Manufacturing Market in Latin America for Retroviral Vectors, Historical Trends (Since 2021) and Forecasted Estimates (Till 2035)
- 38.2.5. Vector Manufacturing Market in Latin America for Non-Viral Vectors, Historical Trends (Since 2021) and Forecasted Estimates (Till 2035)
- 38.2.6. Vector Manufacturing Market in Latin America for Other Vectors, Historical Trends (Since 2021) and Forecasted Estimates (Till 2035)
- 38.3. Vector Manufacturing Market in Latin America: Distribution by Application Area
- 38.3.1. Vector Manufacturing Market in Latin America for Cell Therapy, Historical Trends (Since 2021) and Forecasted Estimates (Till 2035)
- 38.3.2. Vector Manufacturing Market in Latin America for Gene Therapy, Historical Trends (Since 2021) and Forecasted Estimates (Till 2035)
- 38.3.3. Vector Manufacturing Market in Latin America for Vaccines, Historical Trends (Since 2021) and Forecasted Estimates (Till 2035)
- 38.4. Vector Manufacturing Market in Latin America: Distribution by Therapeutic Area
- 38.4.1. Vector Manufacturing Market in Latin America for Oncological Disorders, Historical Trends (Since 2021) and Forecasted Estimates (Till 2035)
- 38.4.2. Vector Manufacturing Market in Latin America for Rare Disorders, Historical Trends (Since 2021) and Forecasted Estimates (Till 2035)
- 38.4.3. Vector Manufacturing Market in Latin America for Immunological Disorders, Historical Trends (Since 2021) and Forecasted Estimates (Till 2035)
- 38.4.4. Vector Manufacturing Market in Latin America for Neurological Disorders, Historical Trends (Since 2021) and Forecasted Estimates (Till 2035)
- 38.4.5. Vector Manufacturing Market in Latin America for Sensory Disorders, Historical Trends (Since 2021) and Forecasted Estimates (Till 2035)
- 38.4.6. Vector Manufacturing Market in Latin America for Metabolic Disorders, Historical Trends (Since 2021) and Forecasted Estimates (Till 2035)
- 38.4.7. Vector Manufacturing Market in Latin America for Blood Disorders, Historical Trends (Since 2021) and Forecasted Estimates (Till 2035)
- 38.4.8. Vector Manufacturing Market in Latin America for Musculoskeletal Disorders, Historical Trends (Since 2021) and Forecasted Estimates (Till 2035)
- 38.4.9. Vector Manufacturing Market in Latin America for Infectious Diseases, Historical Trends (Since 2021) and Forecasted Estimates (Till 2035)
- 38.4.10. Vector Manufacturing Market in Latin America for Ophthalmic Disorders, Historical Trends (Since 2021) and Forecasted Estimates (Till 2035)
- 38.4.11. Vector Manufacturing Market in Latin America for Other Disorders, Historical Trends (Since 2021) and Forecasted Estimates (Till 2035)
- 38.5. Vector Manufacturing Market in Latin America: Distribution by Type of Manufacturer
- 38.5.1. Vector Manufacturing Market in Latin America for In-house Manufacturer, Historical Trends (Since 2021) and Forecasted Estimates (Till 2035)
- 38.5.2. Vector Manufacturing Market in Latin America for Contract Manufacturers, Historical Trends (Since 2021) and Forecasted Estimates (Till 2035)
39. SURVEY ANALYSIS
- 39.1. Chapter Overview
- 39.2. Analysis by Seniority Level of Respondents
- 39.3. Analysis by Type of Manufacturer
- 39.4. Analysis by Scale of Operation
- 39.5. Analysis by Type of Vector Manufactured
40. CONCLUDING REMARKS
41. EXECUTIVE INSIGHTS
42. APPENDIX I: TABULATED DATA
43. APPENDIX II: LIST OF COMPANIES AND ORGANIZATIONS
List of Tables
- Table 6.1 Key Features of Viral Vectors
- Table 6.2 Key Features of Small-scale Cell Culture Systems
- Table 7.1 Viral Vector and Gene Therapy Manufacturers: List of Industry Players
- Table 7.2 Viral Vector and Gene Therapy Manufacturers (Industry Players): Information on Location of Vector Manufacturing Facility, Type of Manufacturer and Scale of Operation
- Table 7.3 Viral Vector and Gene Therapy Manufacturers (Industry Players): Information on Type of Vector Manufactured
- Table 7.4 Viral Vector and Gene Therapy Manufacturers (Industry Players): Information on Application Area
- Table 7.5 Viral Vector and Gene Therapy Manufacturers (Industry Players): Information on Production Capacity
- Table 8.1 Plasmid DNA and Gene Therapy Manufacturers: List of Industry Players
- Table 8.2 Plasmid DNA and Gene Therapy Manufacturers (Industry Players): Information on Location of Plasmid DNA Manufacturing Facility, Type of Manufacturer and Scale of Operation
- Table 8.3 Plasmid DNA and Gene Therapy Manufacturers (Industry Players): Information on Application Area
- Table 8.4 Plasmid DNA and Gene Therapy Manufacturers (Industry Players): Information on Production Capacity
- Table 9.1 Vector and Gene Therapy Manufacturers: List of Non-Industry Players
- Table 9.2 Vector and Gene Therapy Manufacturers (Non-Industry Players): Information on Scale of Operation
- Table 9.3 Vector and Gene Therapy Manufacturers (Non-Industry Players): Information on Type of Vector Manufactured
- Table 9.4 Vector and Gene Therapy Manufacturers (Non-Industry Players): Information on Application Area
- Table 10.1 Vector and Gene Therapy Manufacturing Technologies: List of Technology Platforms
- Table 12.1 Viral Vectors and Plasmid DNA Production in North America: List of Profiled Companies
- Table 12.2 Advanced BioScience Laboratories: Company Snapshot
- Table 12.3 Advanced BioScience Laboratories: Vector Manufacturing Related Capabilities
- Table 12.4 Advanced BioScience Laboratories: Recent Developments and Future Outlook
- Table 12.5 Catalent Biologics: Company Snapshot
- Table 12.6 Catalent Biologics: Vector Manufacturing Related Capabilities
- Table 12.7 Catalent Biologics: Recent Developments and Future Outlook
- Table 12.8 Charles River Laboratories: Company Snapshot
- Table 12.9 Charles River Laboratories: Vector Manufacturing Related Capabilities
- Table 12.10 Charles River Laboratories: Recent Developments and Future Outlook
- Table 12.11 Thermo Fisher Scientific: Company Snapshot
- Table 12.12 Thermo Fisher Scientific: Vector Manufacturing Related Capabilities
- Table 12.13 Thermo Fisher Scientific: Recent Developments and Future Outlook
- Table 12.14 VectorBuilder: Company Snapshot
- Table 12.15 VectorBuilder: Vector Manufacturing Related Capabilities
- Table 12.16 VectorBuilder: Recent Developments and Future Outlook
- Table 12.17 AGC Biologics: Company Snapshot
- Table 12.18 AGC Biologics: Vector Manufacturing Related Capabilities
- Table 12.19 Aldevron: Company Snapshot
- Table 12.20 Aldevron: Vector Manufacturing Related Capabilities
- Table 12.21 Matica Biotechnology: Company Snapshot
- Table 12.22 Matica Biotechnology: Vector Manufacturing Related Capabilities
- Table 12.23 Resilience: Company Snapshot
- Table 12.24 Resilience: Vector Manufacturing Related Capabilities
- Table 13.1 Viral Vectors and Plasmid DNA Production in Europe: List of Profiled Companies
- Table 13.2 Lonza: Company Snapshot
- Table 13.3 Lonza: Vector Manufacturing Related Capabilities
- Table 13.4 Lonza: Recent Developments and Future Outlook
- Table 13.5 Touchlight: Company Snapshot
- Table 13.6 Touchlight: Vector Manufacturing Related Capabilities
- Table 13.7 Touchlight: Recent Developments and Future Outlook
- Table 13.8 BioNTech Innovative Manufacturing Service (a subsidiary of BioNTech): Company Snapshot
- Table 13.8 BioNTech Innovative Manufacturing Service (a subsidiary of BioNTech): Vector Manufacturing Related Capabilities
- Table 13.9 Biovian: Company Snapshot
- Table 13.10 Biovian: Vector Manufacturing Related Capabilities
- Table 13.11 Celonic: Company Snapshot
- Table 13.12 Celonic: Vector Manufacturing Related Capabilities
- Table 13.13 Centre for Process Innovation: Company Snapshot
- Table 13.14 Centre for Process Innovation: Vector Manufacturing Related Capabilities
- Table 13.15 CEVEC Pharmaceuticals: Company Snapshot
- Table 13.16 CEVEC Pharmaceuticals: Vector Manufacturing Related Capabilities
- Table 13.17 NorthX Biologics: Company Snapshot
- Table 13.18 NorthX Biologics: Vector Manufacturing Related Capabilities
- Table 13.19 Novartis: Company Snapshot
- Table 13.20 Novartis: Vector Manufacturing Related Capabilities
- Table 13.21 Oxford BioMedica: Company Snapshot
- Table 13.22 Oxford BioMedica: Vector Manufacturing Related Capabilities
- Table 13.23 Sanofi: Company Snapshot
- Table 13.24 Sanofi: Vector Manufacturing Related Capabilities
- Table 14.1 Viral Vectors and Plasmid DNA Production in Asia-Pacific: List of
Profiled Companies
- Table 14.2 CoJourney: Company Snapshot
- Table 14.3 CoJourney: Vector Manufacturing Related Capabilities
- Table 14.4 CoJourney: Recent Developments and Future Outlook
- Table 14.5 Esco Aster: Company Snapshot
- Table 14.6 Esco Aster: Vector Manufacturing Related Capabilities
- Table 14.7 Esco Aster: Recent Developments and Future Outlook
- Table 14.8 Wuxi AppTec: Company Snapshot
- Table 14.9 Wuxi AppTec: Vector Manufacturing Related Capabilities
- Table 14.10 Wuxi AppTec: Recent Developments and Future Outlook
- Table 14.11 Altruist Biotechnology: Company Snapshot
- Table 14.12 Altruist Biotechnology: Vector Manufacturing Related Capabilities
- Table 14.13 Jiangsu Puxin Biopharmaceutical: Company Snapshot
- Table 14.14 Jiangsu Puxin Biopharmaceutical: Vector Manufacturing Related Capabilities
- Table 14.15 Nikon CeLL innovation: Company Snapshot
- Table 14.16 Nikon CeLL innovation: Vector Manufacturing Related Capabilities
- Table 16.1 Vector and Gene Therapy Manufacturing: List of Partnerships
- Table 16.2 Vector and Gene Therapy Manufacturing: List of Other Partnerships
- Table 17.1 Vector and Gene Therapy Manufacturing: List of Recent Expansions
- Table 17.2 Vector and Gene Therapy Manufacturing: Information on Type of Manufacturing Facility
- Table 17.3 Vector and Gene Therapy Manufacturing: Information on Scale of Operation, Type of Vector Manufactured and Application Area
- Table 18.1 AAV Vector-based Therapy Developers: Most Likely Partners
- Table 18.2 AAV Vector-based Therapy Developers: Likely Partners
- Table 18.3 AAV Vector-based Therapy Developers: Less Likely Partners
- Table 18.4 AAV Vector-based Therapy Developers: Least Likely Partners
- Table 18.5 Adenoviral Vector-based Therapy Developers: Most Likely Partners
- Table 18.6 Adenoviral Vector-based Therapy Developers: Likely Partners
- Table 18.7 Adenoviral Vector-based Therapy Developers: Less Likely Partners
- Table 18.8 Adenoviral Vector-based Therapy Developers: Least Likely Partners
- Table 18.9 Lentiviral Vector-based Therapy Developers: Most Likely Partners
- Table 18.10 Lentiviral Vector-based Therapy Developers: Likely Partners
- Table 18.11 Lentiviral Vector-based Therapy Developers: Less Likely Partners
- Table 18.12 Lentiviral Vector-based Therapy Developers: Least Likely Partners
- Table 18.13 Retroviral Vector-based Therapy Developers: Most Likely Partners
- Table 18.14 Retroviral Vector-based Therapy Developers: Likely Partners
- Table 18.15 Retroviral Vector-based Therapy Developers: Less Likely Partners
- Table 18.16 Other Viral Vector-based Therapy Developers: Most Likely Partners
- Table 18.17 Other Viral Vector-based Therapy Developers: Likely Partners
- Table 18.18 Other Viral Vector-based Therapy Developers: Less Likely Partners
- Table 18.19 Other Viral Vector-based Therapy Developers: Least Likely Partners
- Table 21.1 Viral Vector and Plasmid DNA Cost Price Analysis: Expert Opinions /Primary Research
- Table 21.1 Viral Vector and Plasmid DNA Cost Price Analysis: Expert Opinions / Primary Research
- Table 21.2 Viral Vector and Plasmid DNA: Prices of Vectors
- Table 23.1 Global Installed Viral Vector Manufacturing Capacity: Sample Data Set
- Table 23.2 Global Installed Plasmid DNA Manufacturing Capacity: Sample Data Set
- Table 23.3 Global Installed Viral Vector Manufacturing Capacity: Distribution by Company Size
- Table 23.4 Global Installed Plasmid DNA Manufacturing Capacity: Distribution by Company Size
- Table 24.1. Global Annual Demand for Viral Vectors Manufacturing
- Table 24.2 Global Viral Vectors Manufacturing Annual Supply (Scenario 1), Till 2035
- Table 24.3 Global Viral Vector Manufacturing Annual Supply (Scenario 2), Till 2035
- Table 24.4 Global Viral Vector Manufacturing Annual Supply (Scenario 3), Till 2035
- Table 24.1 Viral Vector and Plasmid DNA: Active Clinical Studies (Vector-based Cell and Gene Therapies)
- Table 24.2 Viral Vector and Plasmid DNA: Distribution by Patients Enrolled in Active Clinical Studies (Vector-Based Cell and Gene Therapies)
- Table 24.3 Viral Vector and Plasmid DNA: Number of Active Clinical Trials (Vector-Based Cell and Gene Therapies), Till 2035
- Table 24.4 Viral Vector and Plasmid DNA: Number of Patients Enrolled in Active Clinical Trials (Vector-Based Cell and Gene Therapies), Til 2035
- Table 24.5 Viral Vector and Plasmid DNA: Approved / Late-Stage Cell and Gene Therapies
- Table 38.1 Survey Responses: Information on Participating Companies / Organizations
- Table 38.2 Survey Responses: Information on Seniority Level of Respondents
- Table 38.3 Survey Responses: Information on Type of Vector
- Table 38.4 Survey Responses: Information on Scale of Operation
- Table 38.5 Survey Responses: Information on Availability of Vector Stabilization Technology
- Table 38.6 Survey Responses: Information on Type of Manufacturer (In-house Production versus Contract Services)
- Table 40.1 HALIX: Key Highlights
- Table 40.2 Batavia Biosciences: Key Highlights
- Table 40.3 CEVEC Pharmaceuticals: Key Highlights
- Table 40.4 Delphi Genetics: Key Highlights
- Table 40.5 Clean Cells: Key Highlights
- Table 40.6 Novasep: Key Highlights
- Table 40.7 Amsterdam BioTherapeutics Unit (AmBTU): Key Highlights
- Table 40.8 Massachusetts General Hospital: Key Highlights
- Table 40.9 University of Nantes: Key Highlights
- Table 40.10 CJ PARTNERS: Key Highlights
- Table 40.11 ACGT: Key Highlights
- Table 40.12 Polypus Transfection: Key Highlights
- Table 40.13 Richter-Helm BioLogics: Key Highlights
- Table 40.14 Plasmid Factory: Key Highlights
- Table 40.15 Waisman Biomanufacturing: Key Highlights
- Table 40.16 EFS-West Biotherapy: Key Highlights
- Table 40.17 GEG Tech: Key Highlights
- Table 40.18 ViveBiotech: Key Highlights
- Table 40.19 Independent Consultant: Key Highlights
- Table 41.1 Viral Vector and Gene Therapy Manufacturers (Industry Players): Distribution by Year of Establishment
- Table 41.2 Viral Vector and Gene Therapy Manufacturers (Industry Players): Distribution by Company Size
- Table 41.3 Viral Vector and Gene Therapy Manufacturers (Industry Players): Distribution by Location of Headquarters (Region)
- Table 41.4 Viral Vector and Gene Therapy Manufacturers (Industry Players): Distribution by Location of Headquarters (Country)
- Table 41.5 Viral Vector and Gene Therapy Manufacturers (Industry Players): Distribution by Type of Product Manufactured
- Table 41.6 Viral Vector and Gene Therapy Manufacturers (Industry Players): Distribution by Location of Vector Manufacturing Facility (Region)
- Table 41.7 Viral Vector and Gene Therapy Manufacturers (Industry Players): Distribution by Location of Vector Manufacturing Facility (Country)
- Table 41.8 Viral Vector and Gene Therapy Manufacturers (Industry Players): Distribution by Type of Manufacturer
- Table 41.9 Viral Vector and Gene Therapy Manufacturers (Industry Players): Distribution by Scale of Operation
- Table 41.10Viral Vector and Gene Therapy Manufacturers (Industry Players): Distribution by Location of Headquarters and Scale of Operation
- Table 41.11Viral Vector and Gene Therapy Manufacturers (Industry Players): Distribution by Type of Vector Manufactured
- Table 41.12Viral Vector and Gene Therapy Manufacturers (Industry Players): Distribution by Scale of Operation and Type of Vector Manufactured
- Table 41.13 Viral Vector and Gene Therapy Manufacturers (Industry Players): Distribution by Application Area
- Table 41.14 Plasmid DNA and Gene Therapy Manufacturers (Industry Players): Distribution by Year of Establishment
- Table 41.15Plasmid DNA and Gene Therapy Manufacturers (Industry Players): Distribution by Company Size
- Table 41.16Plasmid DNA and Gene Therapy Manufacturers (Industry Players) Distribution by Location of Headquarters (Region)
- Table 41.1 Viral Vector and Gene Therapy Manufacturers (Industry Players): Distribution by Year of Establishment
- Table 41.2 Viral Vector and Gene Therapy Manufacturers (Industry Players): Distribution by Company Size
- Table 41.3 Viral Vector and Gene Therapy Manufacturers (Industry Players): Distribution by Location of Headquarters (Region)
- Table 41.4 Viral Vector and Gene Therapy Manufacturers (Industry Players): Distribution by Location of Headquarters (Country)
- Table 41.5 Viral Vector and Gene Therapy Manufacturers (Industry Players): Distribution by Type of Product Manufactured
- Table 41.6 Viral Vector and Gene Therapy Manufacturers (Industry Players): Distribution by Location of Vector Manufacturing Facility (Region)
- Table 41.7 Viral Vector and Gene Therapy Manufacturers (Industry Players): Distribution by Location of Vector Manufacturing Facility (Country)
- Table 41.8 Viral Vector and Gene Therapy Manufacturers (Industry Players): Distribution by Type of Manufacturer
- Table 41.9 Viral Vector and Gene Therapy Manufacturers (Industry Players): Distribution by Scale of Operation
- Table 41.10 Viral Vector and Gene Therapy Manufacturers (Industry Players): Distribution by Location of Headquarters and Scale of Operation
- Table 41.11 Viral Vector and Gene Therapy Manufacturers (Industry Players): Distribution by Type of Viral Vector Manufactured
- Table 41.12 Viral Vector and Gene Therapy Manufacturers (Industry Players): Distribution by Scale of Operation and Type of Viral Vector Manufactured
- Table 41.13 Viral Vector and Gene Therapy Manufacturers (Industry Players): Distribution by Application Area
- Table 41.14 Plasmid DNA and Gene Therapy Manufacturers (Industry Players): Distribution by Year of Establishment
- Table 41.15 Plasmid DNA and Gene Therapy Manufacturers (Industry Players): Distribution by Company Size
- Table 41.16 Plasmid DNA and Gene Therapy Manufacturers (Industry Players): Distribution by Location of Headquarters (Region)
- Table 41.17 Plasmid DNA and Gene Therapy Manufacturers (Industry Players): Distribution by Location of Headquarters (Country)
- Table 41.18 Plasmid DNA and Gene Therapy Manufacturers (Industry Players): Distribution by Company Size and Location of Headquarters
- Table 41.19 Plasmid DNA and Gene Therapy Manufacturers (Industry Players): Distribution by Type of Product Manufactured
- Table 41.20 Plasmid DNA and Gene Therapy Manufacturers (Industry Players): Distribution by Location of Plasmid DNA Manufacturing Facility (Region)
- Table 41.21 Plasmid DNA and Gene Therapy Manufacturers (Industry Players): Distribution by Location of Plasmid DNA Manufacturing Facility (Country)
- Table 41.22 Plasmid DNA and Gene Therapy Manufacturers (Industry Players): Distribution by Type of Manufacturer
- Table 41.23 Plasmid DNA and Gene Therapy Manufacturers (Industry Players): Distribution by Scale of Operation
- Table 41.24 Plasmid DNA and Gene Therapy Manufacturers (Industry Players): Distribution by Application Area
- Table 41.25 Vector and Gene Therapy Manufacturers (Non-Industry Players): Distribution by Year of Establishment
- Table 41.26 Vector and Gene Therapy Manufacturers (Non-Industry Players): Distribution by Location of Headquarters (Region)
- Table 41.27 Vector and Gene Therapy Manufacturers (Non-Industry Players): Distribution by Location of Headquarters (Country)
- Table 41.28 Vector and Gene Therapy Manufacturers (Non-Industry Players): Distribution by Type of Manufacturer
- Table 41.29 Vector and Gene Therapy Manufacturers (Non-Industry Players): Distribution by Scale of Operation
- Table 41.30 Vector and Gene Therapy Manufacturers (Non-Industry Players): Distribution by Type of Vector Manufactured
- Table 41.31 Vector and Gene Therapy Manufacturers (Non-Industry Players): Distribution by Scale of Operation and Type of Vector Manufactured
- Table 41.32 Vector and Gene Therapy Manufacturers (Non-Industry Players): Distribution by Application Area
- Table 41.33 Vector and Gene Therapy Manufacturing Technologies: Distribution by Type of Technology
- Table 41.34 Vector and Gene Therapy Manufacturing Technologies: Distribution by Purpose of Technology
- Table 41.35 Vector and Gene Therapy Manufacturing Technologies: Distribution by Scale of Operation
- Table 41.36 Vector and Gene Therapy Manufacturing Technologies: Distribution by Type of Vector
- Table 41.37 Vector and Gene Therapy Manufacturing Technologies: Distribution by Application Area
- Table 41.38 Most Active Players: Distribution by Number of Technologies
- Table 41.39 Catalent Biologics: Annual Revenues
- Table 41.40 Charles River Laboratories: Annual Revenues
- Table 41.41 Thermo Fisher Scientific: Annual Revenues
- Table 41.42 Lonza: Annual Revenues
- Table 41.43 Wuxi AppTec: Annual Revenues
- Table 41.44 Partnerships and Collaborations: Cumulative Year-wise Trend, Till 2025
- Table 41.45 Partnerships and Collaborations: Distribution by Type of Partnership
- Table 41.46 Partnerships and Collaborations: Distribution by Scale of Operation
- Table 41.47 Partnerships and Collaborations: Distribution by Type of Vector Manufactured
- Table 41.48 Partnerships and Collaborations: Distribution by Therapeutic Area
- Table 41.49 Partnerships and Collaborations: Distribution by Application Area
- Table 41.50 Most Active Players: Distribution by Number of Partnerships
- Table 41.51 Partnerships and Collaborations: Local and International Agreements
- Table 41.52 Partnerships and Collaborations: Intercontinental and Intracontinental Agreements
- Table 41.53 Recent Expansions: Cumulative Year-wise Trend, Till 2025
- Table 41.54 Recent Expansions: Distribution by Type of Expansion
- Table 41.55 Recent Expansions: Distribution by Year and Type of Expansion
- Table 41.56 Most Active Players: Distribution by Number of Expansions
- Table 41.57 Most Active Players: Distribution by Amount Invested
- Table 41.58 Recent Expansions: Distribution by Type of Manufacturing Facility
- Table 41.59 Recent Expansions: Distribution by Scale of Operation
- Table 41.60 Recent Expansions: Distribution by Type of Vector Manufactured
- Table 41.61 Recent Expansions: Distribution by Application Area
- Table 41.62 Recent Expansions: Intercontinental and Intracontinental Expansions
- Table 41.63 Recent Expansions: Distribution by Location of Expansion
- Table 41.64 Viral Vector and Plasmid DNA Manufacturers: Distribution by Type of Manufacturer, Type of Vector Manufactured and Scale of Operation
- Table 41.65 Viral Vector and Plasmid DNA Manufacturers: Distribution by Type of Vector Manufactured and Company Size
- Table 41.66 Viral Vector and Plasmid DNA Manufacturers Contract Manufacturing Organizations: Distribution by Geography
- Table 41.67 Viral Vector and Plasmid DNA Manufacturers In-House Manufacturers: Distribution by Geography
- Table 41.68 Viral Vector and Plasmid DNA Manufacturers In-House and Contract Manufacturing Organizations: Distribution by Geography
- Table 41.69 AAV Vector Manufacturers: Distribution by Location of Manufacturing Facility
- Table 41.70 Adenoviral Vector Manufacturers: Distribution by Location of Headquarters and Scale of Operation
- Table 41.71 Lentiviral Vector Manufacturers: Distribution by Location of Headquarters and Scale of Operation
- Table 41.72 Retroviral Vector Manufacturers: Distribution by Location of Headquarters and Scale of Operation
- Table 41.73 Plasmid DNA Manufacturers: Distribution by Location of Headquarters and Scale of Operation
- Table 41.74 Global Installed Viral Vectors Manufacturing Capacity (in Liters): Distribution by Company Size (Sample Data Set)
- Table 41.75 Global Installed Plasmid DNA Manufacturing Capacity (in Liters): Distribution by Company Size (Sample Data Set)
- Table 41.76 Global Installed Viral Vector and Plasmid DNA Manufacturing
Capacity (in Liters): Distribution by Type of Vector Manufactured
- Table 41.77 Global Installed Viral Vector Manufacturing Capacity (in Liters): Distribution by Company Size
- Table 41.78 Global Installed Viral Vector Manufacturing Capacity: Distribution by
Range of Installed Capacity (in Liters)
- Table 41.79 Global Installed Viral Vector Manufacturing Capacity (in Liters): Distribution by Scale of Operation
- Table 41.80 Global Installed Viral Vector Manufacturing Capacity (in Liters): Distribution by Location of Headquarters (Region)
- Table 41.81 Global Installed Viral Vector Manufacturing Capacity (in Liters): Distribution by Location of Manufacturing Facility
- Table 41.82 Global Installed Plasmid DNA Manufacturing Capacity (in Liters): Distribution by Company Size
- Table 41.83 Global Installed Plasmid DNA Manufacturing Capacity: Distribution by Range of Installed Capacity (in Liters)
- Table 41.84 Global Installed Plasmid DNA Manufacturing Capacity (in Liters): Distribution by Scale of Operation
- Table 41.85 Global Installed Plasmid DNA Manufacturing Capacity (in Liters): Distribution by Location of Headquarters (Region)
- Table 41.86 Global Installed Plasmid DNA Manufacturing Capacity (in Liters): Distribution by Location of Manufacturing Facility
- Table 41.87 Global Demand for Viral Vector and Plasmid DNA (Thousand Patients), 2023-2035
- Table 41.88 Clinical Demand for Viral Vector and Plasmid DNA (Thousand Patients), 2023-2035
- Table 41.89 Global Clinical Demand for Viral Vector and Plasmid DNA (Thousand Patients): Distribution by Type of Vector
- Table 41.90 Global Clinical Demand for Viral Vector and Plasmid DNA (Thousand Patients): Distribution by Type of Therapy
- Table 41.91 Global Clinical Demand for Viral Vector and Plasmid DNA (Thousand Patients): Distribution by Therapeutic Area
- Table 41.92 Global Clinical Demand for Viral Vector and Plasmid DNA (Thousand Patients): Distribution by Geography
- Table 41.93 Global Commercial Demand for Viral Vector and Plasmid DNA (Thousand Patients), 2023-2035
- Table 41.94 Global Commercial Demand for Viral Vector and Plasmid DNA (Thousand Patients): Distribution by Type of Vector
- Table 41.95 Global Commercial Demand for Viral Vector and Plasmid DNA (Thousand Patients): Distribution by Type of Therapy
- Table 41.96 Global Commercial Demand for Viral Vector and Plasmid DNA (Thousand Patients): Distribution by Therapeutic Area
- Table 41.97 Global Commercial Demand for Viral Vector and Plasmid DNA (Thousand Patients): Distribution by Geography
- Table 41.98 Global Vector Manufacturing Market, Historical Trends (Since 2025)
(USD Million)
- Table 41.99 Global Vector Manufacturing Market, Forecasted Estimates (Till 2035), Conservative, Base and Optimistic Scenarios (USD Million)
- Table 41.100 Vector Manufacturing Market for Preclinical Scale, Historical Trends (:
Since 2021) (USD Million)
- Table 41.101 Vector Manufacturing Market for Preclinical Scale, Forecasted Estimates (Till 2035), Conservative, Base and Optimistic Scenarios (USD Million)
- Table 41.102 Vector Manufacturing Market for Clinical Scale, Historical Trends (Since 2021) (USD Million)
- Table 41.103 Vector Manufacturing Market for Clinical Scale, Forecasted Estimates (Till 2035), Conservative, Base and Optimistic Scenarios (USD Million)
- Table 41.104 Vector Manufacturing Market for Commercial Scale, Historical Trends (Since 2021) (USD Million)
- Table 41.105 Vector Manufacturing Market for Commercial Scale, Forecasted Estimates (Till 2035), Conservative, Base and Optimistic Scenarios (USD Million)
- Table 41.106 Vector Manufacturing Market for AAV Vectors, Historical Trends (Since 2021) (USD Million)
- Table 41.107 Vector Manufacturing Market for AAV Vectors, Forecasted Estimates (Till 2035), Conservative, Base and Optimistic Scenarios (USD Million)
- Table 41.108 Vector Manufacturing Market for Adenoviral Vectors, Historical Trends (Since 2021) (USD Million)
- Table 41.109 Vector Manufacturing Market for Adenoviral Vectors, Forecasted Estimates (Till 2035), Conservative, Base and Optimistic Scenarios (USD Million)
- Table 41.110 Vector Manufacturing Market for Lentiviral Vectors, Historical Trends (Since 2021) (USD Million)
- Table 41.111 Vector Manufacturing Market for Lentiviral Vectors, Forecasted Estimates (Till 2035), Conservative, Base and Optimistic Scenarios (USD Million)
- Table 41.112 Vector Manufacturing Market for Retroviral Vectors, Historical Trends (Since 2021) (USD Million)
- Table 41.113 Vector Manufacturing Market for Retroviral Vectors, Forecasted Estimates (Till 2035), Conservative, Base and Optimistic Scenarios (USD Million)
- Table 41.114 Vector Manufacturing Market for Non Viral Vectors, Historical Trends (Since 2021) (USD Million)
- Table 41.115 Vector Manufacturing Market for Non Viral Vectors, Forecasted Estimates (Till 2035), Conservative, Base and Optimistic Scenarios (USD Million)
- Table 41.116 Vector Manufacturing Market for Other Vectors, Historical Trends (Since 2021) (USD Million)
- Table 41.117 Vector Manufacturing Market for Other Vectors, Forecasted Estimates (Till 2035), Conservative, Base and Optimistic Scenarios (USD Million)
- Table 41.118 Vector Manufacturing Market for Cell Therapy, Historical Trends (Since 2021) (USD Million)
- Table 41.119 Vector Manufacturing Market for Cell Therapy, Forecasted Estimates (Till 2035), Conservative, Base and Optimistic Scenarios (USD Million)
- Table 41.120 Vector Manufacturing Market for Gene Therapy, Historical Trends (Since 2021) (USD Million)
- Table 41.121 Vector Manufacturing Market for Gene Therapy, Forecasted Estimates (Till 2035), Conservative, Base and Optimistic Scenarios (USD Million)
- Table 41.122 Vector Manufacturing Market for Vaccines, Historical Trends (Since
2021) (USD Million)
- Table 41.123 Vector Manufacturing Market for Vaccines, Forecasted Estimates (Till 2035), Conservative, Base and Optimistic Scenarios (USD Million)
- Table 41.124 Vector Manufacturing Market for Oncological Disorders, Historical Trends (Since 2021) (USD Million)
- Table 41.125 Vector Manufacturing Market for Oncological Disorders, Forecasted Estimates (Till 2035), Conservative, Base and Optimistic Scenarios (USD Million)
- Table 41.126 Vector Manufacturing Market for Rare Diseases, Historical Trends (Since 2021) (USD Million)
- Table 41.127 Vector Manufacturing Market for Rare Diseases, Forecasted Estimates (Till 2035), Conservative, Base and Optimistic Scenarios (USD Million)
- Table 41.128 Vector Manufacturing Market for Immunological Disorders, Historical Trends (Since 2021) (USD Million)
- Table 41.129 Vector Manufacturing Market for Immunological Disorders, Forecasted Estimates (Till 2035), Conservative, Base and Optimistic Scenarios (USD Million)
- Table 41.130 Vector Manufacturing Market for Neurological Disorders, Historical Trends (Since 2021) (USD Million)
- Table 41.131 Vector Manufacturing Market for Neurological Disorders, Forecasted Estimates (Till 2035), Conservative, Base and Optimistic Scenarios (USD Million)
- Table 41.132 Vector Manufacturing Market for Sensory Disorders, Historical Trends (Since 2021) (USD Million)
- Table 41.133 Vector Manufacturing Market for Sensory Disorders, Forecasted Estimates (Till 2035), Conservative, Base and Optimistic Scenarios (USD Million)
- Table 41.134 Vector Manufacturing Market for Metabolic Disorders, Historical Trends (Since 2021) (USD Million)
- Table 41.135 Vector Manufacturing Market for Metabolic Disorders, Forecasted
Estimates (Till 2035), Conservative, Base and Optimistic Scenarios (USD Million)
- Table 41.136 Vector Manufacturing Market for Blood Disorders, Historical Trends (Since 2021) (USD Million)
- Table 41.137 Vector Manufacturing Market for Blood Disorders, Forecasted Estimates (Till 2035), Conservative, Base and Optimistic Scenarios (USD Million)
- Table 41.138 Vector Manufacturing Market for Musculoskeletal Disorders, Historical Trends (Since 2021) (USD Million)
- Table 41.139 Vector Manufacturing Market for Musculoskeletal Disorders, Forecasted Estimates (Till 2035), Conservative, Base and Optimistic Scenarios (USD Million)
- Table 41.140 Vector Manufacturing Market for Infectious Diseases, Historical Trends (Since 2021) (USD Million)
- Table 41.141 Vector Manufacturing Market for Infectious Diseases, Forecasted Estimates (Till 2035), Conservative, Base and Optimistic Scenarios (USD Million)
- Table 41.142 Vector Manufacturing Market for Ophthalmic Disorders, Historical Trends (Since 2021) (USD Million)
- Table 41.143 Vector Manufacturing Market for Ophthalmic Disorders, Forecasted
Estimates (Till 2035), Conservative, Base and Optimistic Scenarios (USD Million)
- Table 41.144 Vector Manufacturing Market for Autoimmune Disorders, Forecasted Estimates (Till 2035), Conservative, Base and Optimistic Scenarios (USD Million)
- Table 41.145 Vector Manufacturing Market for Other Disorders, Historical Trends (Since 2021) (USD Million)
- Table 41.146 Vector Manufacturing Market for Other Disorders, Forecasted Estimates (Till 2035), Conservative, Base and Optimistic Scenarios (USD Million)
- Table 41.147 Vector Manufacturing Market for In-house Manufacturers, Historical Trends (Since 2021) (USD Million)
- Table 41.148 Vector Manufacturing Market for In-house Manufacturers, Forecasted Estimates (Till 2035), Conservative, Base and Optimistic Scenarios (USD Million)
- Table 41.149 Vector Manufacturing Market for Contract Manufacturing Organizations, Historical Trends (Since 2021) (USD Million)
- Table 41.150 Vector Manufacturing Market for Contract Manufacturing Organizations, Forecasted Estimates (Till 2035), Conservative, Base and Optimistic Scenarios (USD Million)
- Table 41.151 Vector Manufacturing Market in North America, Historical Trend (Since 2021) (USD Million)
- Table 41.152 Vector Manufacturing Market in North America, Forecasted Estimates (Till 2035), Conservative, Base and Optimistic Scenarios (USD Million)
- Table 41.153 Vector Manufacturing Market in Europe, Historical Trend (Since 2021) (USD Million)
- Table 41.154 Vector Manufacturing Market in Europe, Forecasted Estimates (Till 2035), Conservative, Base and Optimistic Scenarios (USD Million)
- Table 41.155 Vector Manufacturing Market in Asia-Pacific, Historical Trend (Since 2021) (USD Million)
- Table 41.156 Vector Manufacturing Market in Asia-Pacific, Forecasted Estimates (Till 2035), Conservative, Base and Optimistic Scenarios (USD Million)
- Table 41.157 Vector Manufacturing Market in Middle East and North Africa, Historical Trend (Since 2021) (USD Million)
- Table 41.158 Vector Manufacturing Market in Middle East and North Africa, Forecasted Estimates (Till 2035), Conservative, Base and Optimistic Scenarios (USD Million)
- Table 41.159 Vector Manufacturing Market in Latin America and Rest of the World, Historical Trend (Since 2021) (USD Million)
- Table 41.160 Vector Manufacturing Market in Latin America and Rest of the World, Forecasted Estimates (Till 2035), Conservative, Base and Optimistic Scenarios (USD Million)
- Table 41.161 Survey Analysis: Distribution by Seniority Level of Respondents
- Table 41.162 Survey Analysis: Distribution by Type of Manufacturer
- Table 41.163 Survey Analysis: Distribution by Scale of Operation
- Table 41.164 Survey Analysis: Distribution by Type of Vector Manufactured
List of Figures
- Figure 2.1 Research Methodology: Project Methodology
- Figure 2.2 Research Methodology: Data Sources for Secondary Research
- Figure 2.3 Research Methodology: Robust Quality Control
- Figure 3.1 Market Dynamics: Forecast Methodology
- Figure 3.2 Market Dynamics: Key Market Segmentation
- Figure 4.1 Lessons Learnt from Past Recessions
- Figure 5.1 Executive Summary: Market Landscape
- Figure 5.2 Executive Summary: Market Trends
- Figure 5.3 Executive Summary: Market Forecast and Opportunity Analysis
- Figure 7.1 Viral and Non-Viral Techniques for Gene Transfer
- Figure 7.2 Vector Manufacturing Operations: Types of Manufacturers
- Figure 7.3 Viral Vectors: Manufacturing Process
- Figure 7.1 Viral Vector and Gene Therapy Manufacturers (Industry Players): Distribution by Year of Establishment
- Figure 7.2 Viral Vector and Gene Therapy Manufacturers (Industry Players): Distribution by Company Size
- Figure 7.3 Viral Vector and Gene Therapy Manufacturers (Industry Players): Distribution by Location of Headquarters (Region)
- Figure 7.4 Viral Vector and Gene Therapy Manufacturers (Industry Players): Distribution by Location of Headquarters (Country)
- Figure 7.5 Viral Vector and Gene Therapy Manufacturers (Industry Players): Distribution by Type of Product Manufactured
- Figure 7.6 Viral Vector and Gene Therapy Manufacturers (Industry Players): Distribution by Location of Vector Manufacturing Facility (Region)
- Figure 7.7 Viral Vector and Gene Therapy Manufacturers (Industry Players): Distribution by Location of Vector Manufacturing Facility (Country)
- Figure 7.8 Viral Vector and Gene Therapy Manufacturers (Industry Players): Distribution by Type of Manufacturer
- Figure 7.9 Viral Vector and Gene Therapy Manufacturers (Industry Players): Distribution by Scale of Operation
- Figure 7.10 Viral Vector and Gene Therapy Manufacturers (Industry Players): Distribution by Location of Headquarters and Scale of Operation
- Figure 7.11 Viral Vector and Gene Therapy Manufacturers (Industry Players): Distribution by Type of Viral Vector Manufactured
- Figure 7.12 Viral Vector and Gene Therapy Manufacturers (Industry Players): Distribution by Scale of Operation and Type of Viral Vector Manufactured
- Figure 7.13 Viral Vector and Gene Therapy Manufacturers (Industry Players): Distribution by Application Area
- Figure 8.1 Plasmid DNA and Gene Therapy Manufacturers (Industry Players): Distribution by Year of Establishment
- Figure 8.2 Plasmid DNA and Gene Therapy Manufacturers (Industry Players): Distribution by Company Size
- Figure 8.3 Plasmid DNA and Gene Therapy Manufacturers (Industry Players): Distribution by Location of Headquarters (Region)
- Figure 8.4 Plasmid DNA and Gene Therapy Manufacturers (Industry Players): Distribution by Location of Headquarters (Country)
- Figure 8.5 Plasmid DNA and Gene Therapy Manufacturers (Industry Players): Distribution by Company Size and Location of Headquarters
- Figure 8.6 Plasmid DNA and Gene Therapy Manufacturers (Industry Players): Distribution by Type of Product Manufactured
- Figure 8.7 Plasmid DNA and Gene Therapy Manufacturers (Industry Players): Distribution by Location of Plasmid DNA Manufacturing Facility (Region)
- Figure 8.8 Plasmid DNA and Gene Therapy Manufacturers (Industry Players): Distribution by Location of Plasmid DNA Manufacturing Facility (Country)
- Figure 8.9 Plasmid DNA and Gene Therapy Manufacturers (Industry Players): Distribution by Type of Manufacturer
- Figure 8.10 Plasmid DNA and Gene Therapy Manufacturers (Industry Players): Distribution by Scale of Operation
- Figure 8.11 Plasmid DNA and Gene Therapy Manufacturers (Industry Players): Distribution by Application Area
- Figure 9.1 Vector and Gene Therapy Manufacturers (Non-Industry Players): Distribution by Year of Establishment
- Figure 9.2 Vector and Gene Therapy Manufacturers (Non-Industry Players): Distribution by Location of Headquarters (Region)
- Figure 9.3 Vector and Gene Therapy Manufacturers (Non-Industry Players): Distribution by Location of Headquarters (Country)
- Figure 9.4 Vector and Gene Therapy Manufacturers (Non-Industry Players): Distribution by Type of Manufacturer
- Figure 9.5 Vector and Gene Therapy Manufacturers (Non-Industry Players): Distribution by Scale of Operation
- Figure 9.6 Vector and Gene Therapy Manufacturers (Non-Industry Players): Distribution by Type of Vector Manufactured
- Figure 9.7 Vector and Gene Therapy Manufacturers (Non-Industry Players): Distribution by Scale of Operation and Type of Vector Manufactured
- Figure 9.8 Vector and Gene Therapy Manufacturers (Non-Industry Players): Distribution by Application Area
- Figure 10.1 Vector and Gene Therapy Manufacturing Technologies: Distribution by Type of Technology
- Figure 10.2 Vector and Gene Therapy Manufacturing Technologies: Distribution by Purpose of Technology
- Figure 10.3 Vector and Gene Therapy Manufacturing Technologies: Distribution by Scale of Operation
- Figure 10.4 Vector and Gene Therapy Manufacturing Technologies: Distribution by Type of Vector
- Figure 10.5 Vector and Gene Therapy Manufacturing Technologies: Distribution by Application Area
- Figure 10.6 Most Active Players: Distribution by Number of Technologies
- Figure 11.1 Company Competitiveness Analysis: Viral Vector Manufacturers
based in North America
- Figure 11.2 Company Competitiveness Analysis: Viral Vector Manufacturers based
In Europe
- Figure 11.3 Company Competitiveness Analysis: Viral Vector Manufacturers based
In Asia-Pacific
- Figure 11.4 Company Competitiveness Analysis: Plasmid DNA Manufactures based in North America
- Figure 11.5 Company Competitiveness Analysis: Plasmid DNA Manufactures based in Europe
- Figure 11.6 Company Competitiveness Analysis: Plasmid DNA Manufactures based in Asia-Pacific
- Figure 12.1 Catalent Biologics: Annual Revenues
- Figure 12.2 Charles River Laboratories: Annual Revenues
- Figure 12.3 Thermo Fisher Scientific: Annual Revenues
- Figure 13.1 Lonza: Annual Revenues
- Figure 14.1 Wuxi AppTec: Annual Revenues
- Figure 15.1 Porter's Five Forces
- Figure 15.2 Porter's Five Forces: Harvey Ball Analysis
- Figure 16.1 Partnerships and Collaborations: Cumulative Year-wise Trend, Till 2025
- Figure 16.2 Partnerships and Collaborations: Distribution by Type of Partnership
- Figure 16.3 Partnerships and Collaborations: Distribution by Scale of Operation
- Figure 16.4 Partnerships and Collaborations: Distribution by Type of Vector Manufactured
- Figure 16.5 Partnerships and Collaborations: Distribution by Therapeutic Area
- Figure 16.6 Partnerships and Collaborations: Distribution by Application Area
- Figure 16.7 Most Active Players: Distribution by Number of Partnerships
- Figure 16.8 Partnerships and Collaborations: Local and International Agreements
- Figure 16.9 Partnerships and Collaborations: Intercontinental and Intracontinental Agreements
- Figure 17.1 Recent Expansions: Cumulative Year-wise Trend, Till 2025
- Figure 17.2 Recent Expansions: Distribution by Type of Expansion
- Figure 17.3 Recent Expansions: Distribution by Year and Type of Expansion
- Figure 17.4 Most Active Players: Distribution by Number of Expansions
- Figure 17.5 Most Active Players: Distribution by Amount Invested
- Figure 17.6Recent Expansions: Distribution by Type of Manufacturing Facility
- Figure 17.7 Recent Expansions: Distribution by Scale of Operation
- Figure 17.8 Recent Expansions: Distribution by Type of Vector Manufactured
- Figure 17.9 Recent Expansions: Distribution by Application Area
- Figure 17.10 Recent Expansions: Intercontinental and Intracontinental Expansions
- Figure 17.11 Recent Expansions: Distribution by Location of Expansion
- Figure 20.1 Vector and Gene Therapy Manufacturers: Distribution by Type of Manufacturer, Type of Vector Manufactured and Scale of Operation
- Figure 20.2 Vector and Gene Therapy Manufacturers: Distribution by Type of
Vector Manufactured and Company Size
- Figure 20.3 Vector and Gene Therapy Contract Manufacturing Organizations: Distribution by Geography
- Figure 20.4 Vector and Gene Therapy In-House Manufacturers: Distribution by Geography
- Figure 20.5 Vector and Gene Therapy In-House and Contract Manufacturing Organizations: Distribution by Geography
- Figure 20.6 AAV Vector Manufacturers: Distribution by Location of Manufacturing Facility
- Figure 20.7 Adenoviral Vector Manufacturers: Distribution by Location of Headquarters and Scale of Operation
- Figure 20.8 Lentiviral Vector Manufacturers: Distribution by Location of
Headquarters and Scale of Operation
- Figure 20.9 Retroviral Vector Manufacturers: Distribution by Location of Headquarters and Scale of Operation
- Figure 20.10 Plasmid DNA Manufacturers: Distribution by Location of Headquarters and Scale of Operation
- Figure 21.1 Viral Vector and Plasmid DNA based Therapies Cost Price Analysis: Vector Production Process and Relative Costs Involved
- Figure 22.1 Outsourcing: Go / No-Go Framework
- Figure 22.2 Outsourcing: Go / No-Go Framework Methodology
- Figure 22.3 Outsourcing: Go / No-Go Framework for Cell and Gene Therapy Developers
- Figure 22.4 Outsourcing: Go / No-Go Framework for Small Companies
- Figure 22.5 Outsourcing: Go / No-Go Framework for Mid-sized Companies
- Figure 22.6 Outsourcing: Go / No-Go Framework for Large Companies
- Figure 23.1 Global Installed Viral Vectors Manufacturing Capacity (in Liters): Distribution by Company Size (Sample Data Set)
- Figure 23.2 Global Installed Plasmid DNA Manufacturing Capacity (in Liters): Distribution by Company Size (Sample Data Set)
- Figure 23.3 Global Installed Viral Vector and Plasmid DNA Manufacturing Capacity (in Liters): Distribution by Type of Vector Manufactured
- Figure 23.4 Global Installed Viral Vector Manufacturing Capacity (in Liters): Distribution by Company Size
- Figure 23.5 Global Installed Viral Vector Manufacturing Capacity: Distribution by Range of Installed Capacity (in Liters)
- Figure 23.6 Global Installed Viral Vector Manufacturing Capacity (in Liters): Distribution by Scale of Operation
- Figure 23.7 Global Installed Viral Vector Manufacturing Capacity (in Liters): Distribution by Location of Headquarters (Region)
- Figure 23.8 Global Installed Viral Vector Manufacturing Capacity (in Liters): Distribution by Location of Manufacturing Facility
- Figure 23.9 Global Installed Plasmid DNA Manufacturing Capacity (in Liters): Distribution by Company Size
- Figure 23.10Global Installed Plasmid DNA Manufacturing Capacity: Distribution by Range of Installed Capacity (in Liters)
- Figure 23.11Global Installed Plasmid DNA Manufacturing Capacity (in Liters): Distribution by Scale of Operation
- Figure 23.12Global Installed Plasmid DNA Manufacturing Capacity (in Liters): Distribution by Location of Headquarters (Region)
- Figure 23.13Global Installed Plasmid DNA Manufacturing Capacity (in Liters): Distribution by Location of Manufacturing Facility
- Figure 24.1 Global Demand for Viral Vector and Plasmid DNA (Thousand Patients), Till 2035
- Figure 24.2 Clinical Demand for Viral Vector and Plasmid DNA (Thousand Patients), Till 2035
- Figure 24.3 Global Clinical Demand for Viral Vector and Plasmid DNA (Thousand Patients): Distribution by Type of Vector
- Figure 24.4 Global Clinical Demand for Viral Vector and Plasmid DNA (Thousand Patients): Distribution by Type of Therapy
- Figure 24.5 Global Clinical Demand for Viral Vector and Plasmid DNA (Thousand Patients): Distribution by Therapeutic Area
- Figure 24.6 Global Clinical Demand for Viral Vector and Plasmid DNA (Thousand Patients): Distribution by Geography
- Figure 24.7 Global Commercial Demand for Viral Vector and Plasmid DNA (Thousand Patients), Till 2035
- Figure 24.8 Global Commercial Demand for Viral Vector and Plasmid DNA (Thousand Patients): Distribution by Type of Vector
- Figure 24.9 Global Commercial Demand for Viral Vector and Plasmid DNA (Thousand Patients): Distribution by Type of Therapy
- Figure 24.10Global Commercial Demand for Viral Vector and Plasmid DNA (Thousand Patients): Distribution by Therapeutic Area
- Figure 24.11Global Commercial Demand for Viral Vector and Plasmid DNA (Thousand Patients): Distribution by Geography
- Figure 24.12Global Vector Manufacturing: Demand and Supply Analysis, Till 2035
- Figure 25.1 Market Drivers
- Figure 25.2 Market Restraints
- Figure 25.3 Market Opportunities
- Figure 25.4 Market Challenges
- Figure 26.1 Global Vector Manufacturing Market, Historical Trends (Since 2021) and Forecasted Estimates (Till 2035) (USD Million)
- Figure 26.2 Global Vector Manufacturing Market, Forecasted Estimates (Till 2035), Conservative Scenario (USD Million)
- Figure 26.3 Global Vector Manufacturing Market, Forecasted Estimates (Till 2035), Optimistic Scenario (USD Million)
- Figure 27.1 Vector Manufacturing Market: Distribution by Scale of Operation
- Figure 27.2 Vector Manufacturing Market for Preclinical Scale: Historical Trends (Since 2021) and Forecasted Estimates (Till 2035) (USD Million)
- Figure 27.3 Vector Manufacturing Market for Clinical Scale: Historical Trends (Since 2021) and Forecasted Estimates (Till 2035) (USD Million)
- Figure 27.4 Vector Manufacturing Market for Commercial Scale: Historical Trends (Since 2021) and Forecasted Estimates (Till 2035) (USD Million)
- Figure 28.1 Vector Manufacturing Market: Distribution by Type of Vector
- Figure 28.2 Vector Manufacturing Market for AAV Vectors: Historical Trends (Since 2021) and Forecasted Estimates (Till 2035) (USD Million)
- Figure 28.3 Vector Manufacturing Market for Adenoviral Vectors: Historical Trends (Since 2021) and Forecasted Estimates (Till 2035) (USD Million)
- Figure 28.4 Vector Manufacturing Market for Lentiviral Vectors: Historical Trends (Since 2021) and Forecasted Estimates (Till 2035) (USD Million)
- Figure 28.5 Vector Manufacturing Market for Retroviral Vectors: Historical Trends (Since 2021) and Forecasted Estimates (Till 2035) (USD Million)
- Figure 28.6 Vector Manufacturing Market for Non Viral Vectors: Historical Trends (Since 2021) and Forecasted Estimates (Till 2035) (USD Million)
- Figure 28.6 Vector Manufacturing Market for Other Vectors: Historical Trends (Since 2021) and Forecasted Estimates (Till 2035) (USD Million)
- Figure 29.1 Vector Manufacturing Market: Distribution by Application Area
- Figure 29.2 Vector Manufacturing Market for Cell Therapy Manufacturing: Historical Trends (Since 2021) and Forecasted Estimates (Till 2035) (USD Million)
- Figure 29.3 Vector Manufacturing Market for Gene Therapy Manufacturing: Historical Trends (Since 2021) and Forecasted Estimates (Till 2035) (USD Million)
- Figure 29.4 Vector Manufacturing Market for Vaccines: Historical Trends (Since 2021) and Forecasted Estimates (Till 2035) (USD Million)
- Figure 30.1 Vector Manufacturing Market: Distribution by Type of Therapeutic Area
- Figure 30.2 Vector Manufacturing Market for Oncological Disorders: Historical Trends (Since 2021) and Forecasted Estimates (Till 2035) (USD Million)
- Figure 30.3 Vector Manufacturing Market for Rare Diseases: Historical Trends (Since 2021) and Forecasted Estimates (Till 2035) (USD Million)
- Figure 30.4 Vector Manufacturing Market for Immunological Disorders: Historical Trends (Since 2021) and Forecasted Estimates (Till 2035) (USD Million)
- Figure 30.5 Vector Manufacturing Market for Neurological Disorders: Historical Trends (Since 2021) and Forecasted Estimates (Till 2035) (USD Million)
- Figure 30.6 Vector Manufacturing Market for Sensory Diseases: Historical Trends (Since 2021) and Forecasted Estimates (Till 2035) (USD Million)
- Figure 30.7 Vector Manufacturing Market for Metabolic Disorders: Historical Trends (Since 2021) and Forecasted Estimates (Till 2035) (USD Million)
- Figure 30.8 Vector Manufacturing Market for Blood Disorders: Historical Trends (Since 2021) and Forecasted Estimates (Till 2035) (USD Million)
- Figure 30.9 Vector Manufacturing Market for Musculoskeletal Disorders: Historical Trends (Since 2021) and Forecasted Estimates (Till 2035) (USD Million)
- Figure 30.10 Vector Manufacturing Market for Infectious Diseases: Historical Trends (Since 2021) and Forecasted Estimates (Till 2035) (USD Million)
- Figure 30.11 Vector Manufacturing Market for Ophthalmic Disorders: Historical
Trends (Since 2021) and Forecasted Estimates (Till 2035) (USD Million)
- Figure 30.12 Vector Manufacturing Market for Autoimmune Disorders: Historical Trends (Since 2021) and Forecasted Estimates (Till 2035) (USD Million)
- Figure 30.13 Vector Manufacturing Market for Other Disorders: Historical Trends (Since 2021) and Forecasted Estimates (Till 2035) (USD Million)
- Figure 31.1 Vector Manufacturing Market: Distribution by Type of Manufacturer
- Figure 31.2 Vector Manufacturing Market for In-house Manufacturers: Historical Trends (Since 2021) and Forecasted Estimates (Till 2035) (USD Million)
- Figure 31.3 Vector Manufacturing Market for Contract Manufacturing Organizations: Historical Trends (Since 2021) and Forecasted Estimates (Till 2035) (USD Million)
- Figure 32.1 Vector Manufacturing Market: Distribution by Geography
- Figure 32.2 Vector Manufacturing Market in North America: Historical Trends (Since 2021) and Forecasted Estimates (Till 2035) (USD Million)
- Figure 32.3 Vector Manufacturing Market in Europe: Historical Trends (Since 2021) and Forecasted Estimates (Till 2035) (USD Million)
- Figure 32.4 Vector Manufacturing Market in Asia-Pacific: Historical Trends (Since 2021) and Forecasted Estimates (Till 2035) (USD Million)
- Figure 32.5 Vector Manufacturing Market in Middle East and North Africa: Historical Trends (Since 2021) and Forecasted Estimates (Till 2035) (USD Million)
- Figure 32.5 Vector Manufacturing Market in Latin America and Rest of the World: Historical Trends (Since 2021) and Forecasted Estimates (Till 2035) (USD Million)
- Figure 38.1 Survey Analysis: Distribution by Type of Organization
- Figure 38.2 Survey Analysis: Distribution by Location of Headquarters
- Figure 38.3 Survey Analysis: Distribution by Seniority Level of Respondents
- Figure 38.4 Survey Analysis: Distribution by Type of Manufacturer
- Figure 38.5 Survey Analysis: Distribution by Scale of Operation
- Figure 38.6 Survey Analysis: Distribution by Type of Vector Manufactured
- Figure 39.1 Conclusion: Market Landscape
- Figure 39.2 Conclusion: Market Trends
- Figure 39.3 Conclusion: Market Forecast and Opportunity Analysis

