PUBLISHER: Roots Analysis | PRODUCT CODE: 2125142

PUBLISHER: Roots Analysis | PRODUCT CODE: 2125142
North America Non-Viral Transfection Reagents Market
NORTH AMERICA NON-VIRAL TRANSFECTION REAGENTS MARKET: OVERVIEW
As per Roots Analysis, the North America non-viral transfection reagents market is estimated to grow from USD 0.34 billion in the current year to USD 0.70 billion by 2035, at a CAGR of 8.5% during the forecast period, till 2035.
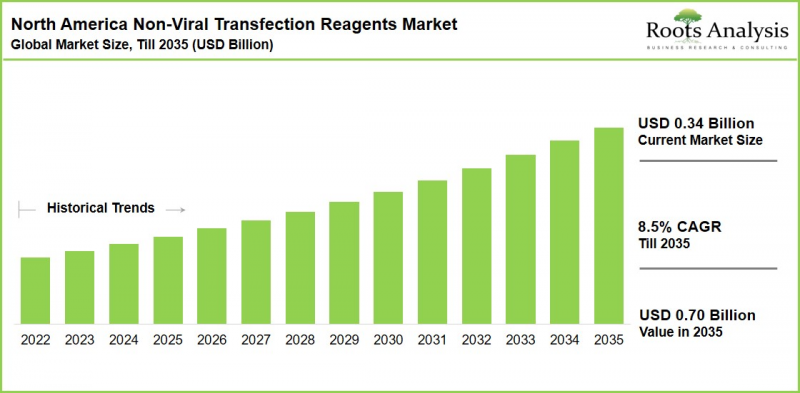
North America Non-Viral Transfection Reagents Market: Growth and Trends
Non-viral transfection reagents have become integral to modern molecular biology and therapeutic development, offering a reliable and scalable alternative to viral vectors for delivering nucleic acids into cells. Chemical and physical transfection approaches enable gene expression studies, CRISPR editing, mRNA delivery, and cell engineering with greater control and fewer biosafety constraints than viral systems. Established platforms in this space include lipid-based reagents such as Thermo Fisher's Lipofectamine MessengerMAX and CRISPRMAX, as well as electroporation systems such as Lonza's 4D-Nucleofector and MaxCyte's ExPERT platform. Rising demand for safer, more reproducible, and cost-effective delivery methods continues to drive innovation across reagent chemistry and formulation.
North America benefits from a well-established ecosystem of academic research centers, biotechnology companies, and contract research organizations, which has accelerated the adoption and commercialization of advanced non-viral transfection solutions. Substantial investment in cell and gene research, expanding cell and RNA-based therapeutic pipelines, and strong translational infrastructure have created a large and sophisticated user base that favors high-efficiency, low-toxicity transfection reagents. Regulatory emphasis on product safety and scalable manufacturing further supports the preference for non-viral approaches in preclinical work and select clinical applications.
Key trends shaping the market include the rise of lipid nanoparticle (LNP) platforms driven by mRNA therapeutics, growing demand for reagents optimized for hard-to-transfect primary and stem cells, and formulation advances that improve serum stability and transfection reproducibility. Cytiva's NanoAssemblr Ignite and Ignite+ systems, for instance, support reproducible LNP formulation for genomic medicine applications. Reagent suppliers are also introducing kits tailored for CRISPR workflows, single-cell applications, and high-throughput automation, while partnerships between reagent and instrument manufacturers are streamlining end-to-end transfection workflows across laboratories and CDMOs.
Growth Drivers: Factors Fueling Market Expansion
The rising burden of chronic and genetic diseases across North America is a primary growth driver. The CDC estimates that close to 129 million people in the United States live with at least one major chronic disease. This rising number of chronic diseases has fuelled demand for nucleic acid-based therapies, CRISPR gene editing, and other targeted treatment approaches, all of which rely on non-viral transfection reagents across research and clinical settings.
North America also hosts the world's largest pipeline of cell and gene therapies, many of which depend on efficient nucleic acid delivery during preclinical research, ex vivo cell engineering, and process development. Non-viral reagents are increasingly favoured over viral vectors for applications requiring transient gene expression, lower immunogenicity, and simplified manufacturing. The expanding number of CRISPR-based therapies, CAR-T and NK cell programs, and mRNA therapeutics continues to drive demand for advanced lipid-based, polymer-based, and nanoparticle-based transfection reagents.
Market Challenges: Critical Barriers Hindering Progress
Despite continuous technological improvement, many primary cells, stem cells, immune cells, and certain suspension cell lines remain difficult to transfect using non-viral reagents. Lower transfection efficiency relative to viral vectors can reduce experimental reproducibility and constrain adoption in advanced cell therapy applications.
Cytotoxicity remains a further constraint. Many cationic lipid and polymer-based reagents can induce cellular toxicity, inflammatory responses, or reduced cell viability, particularly at higher concentrations. Balancing transfection efficiency against minimal cytotoxicity remains an ongoing challenge for researchers developing sensitive cell-based assays and therapeutic products.
North America Non-Viral Transfection Reagents Market: Key Insights
The report delves into the current state of the North America non-viral transfection reagents market and identifies potential growth opportunities within the industry, particularly from a distributor and channel-partner perspective. Some key findings include:
- VectorBuilder partnered with MaxCyte to co-develop a clinical-grade, ex vivo non-viral gene delivery platform, combining VectorBuilder's MiniVec plasmid system with MaxCyte's Flow Electroporation technology for CAR-T, iPSC, and other engineered cell therapy workflows.
- Kytopen completed a Series B financing round led by Telegraph Hill Partners to accelerate commercial expansion of its Flowfect non-viral, continuous-flow transfection platform across the US and Europe.
- MaxCyte launched ExPERT DTx, a 96-well high-throughput electroporation platform designed for research and drug discovery applications, with a defined path for scale-up toward cGMP manufacturing.
- Given the expanding cell and gene therapy pipeline, rising prevalence of chronic and genetic disease, and continued innovation in low-toxicity, scalable delivery chemistries, the North America non-viral transfection reagents market is well-positioned for steady, sustained growth through 2035.
North America Non-Viral Transfection Reagents Market Segments
Roots Analysis segments the North America non-viral transfection reagents opportunity across the following parameters:
By Type of Non-Viral Transfection Method
- Chemical Methods
- Physical Methods
- Other Methods
By Application Area
- Research Applications
- Clinical Applications
By End-User
- Academic and Research Institutions
- Pharmaceutical and Biotechnological Companies
- Contract Manufacturers
- Other End-Users
North America Non-Viral Transfection Reagents Market: Key Segments Insight
Physical Methods Continue to Lead the Market
Currently, physical transfection methods, led by electroporation and nucleofection platforms account for the largest share of the market. This dominance is supported by their established role in cell and gene therapy research, ex vivo cell engineering, and biopharmaceutical manufacturing. MaxCyte's ExPERT platform is a prominent example of a physical-method system used across research and process development workflows.
Conversely, other methods, such as advanced nanoparticle carriers and next-generation chemical delivery vectors are projected to experience the fastest CAGR during the forecast period. Accelerating clinical pipelines for mRNA therapeutics and gene editing demand scalable, low-cytotoxicity delivery mechanisms that drive rapid adoption of these emerging solutions.
Research Applications Hold the Highest Share
Based on our proprietary market report, the research applications hold the highest share of the market. This dominance reflects the extensive use of non-viral transfection reagents in basic research, functional genomics, gene expression studies, and drug discovery. Furthermore, the robust government funding for life sciences research across North America is likely to fuel the demand for non-viral transfection reagents.
Meanwhile, clinical applications are projected to register the highest CAGR during the forecast period, driven by the increasing translation of cell and gene therapy technologies from research and development into clinical applications. The rising requirement for clinical grade vectors, larger batch volumes, and regulatory-compliant delivery systems fuels this rapid acceleration.
Academic and Research Institutions Lead the End-User Landscape
Academic and research institutions account for the largest share of the market. This dominance can be attributed to the fact that non-viral transfection reagents form the core user base for gene expression studies, RNAi, and gene knockdown work, and CRISPR-Cas9 delivery. Further, North America's dense network of university laboratories and strong foundation in life sciences research supports continued demand. Reliable government funding and ongoing gene expression studies ensure continuous procurement across this institutional base.
On the other hand, biotechnology and pharmaceutical companies segment will grow at the highest CAGR during the forecast period. Expanding clinical trial portfolios and commercial manufacturing scale-ups compel biopharma firms to rapidly increase their procurement of specialized, high value transfection reagents.
Example Players in North America Non-Viral Transfection Reagents Market
- Altogen Biosystems
- Bio-Rad Laboratories
- Cytiva
- Harvard Bioscience
- MaxCyte
- MilliporeSigma
- Mirus Bio
- Revvity
- Thermo Fisher Scientific
Expert Interview and Industry Insights
The opinions and insights presented in this study were shaped by discussions with multiple stakeholders across the value chain. The research report features detailed transcripts of interviews held with the following industry participants:
- Former-Vice-President, Business Development and Partnerships, Small Company, US
- Former Global Business Development Manager, Clinical Operations, Mid-sized Company, France
- Researcher, Mid-sized Company, Chile
In addition, the market report includes transcripts of the following other third-party discussions:
- Chairman and Chief Executive Officer, Mid-sized Company, US
- Co-Founder and Chief Executive Officer, Small Company, US
- Chief Scientific Officer and Executive Vice President of R&D, Mid-sized Company, US
- Chief Scientific Officer, Mid-sized Company, US
- Chief Scientific Officer, Small Company, Germany
- Vice President, Cell Therapy Process Development, Large Company, US
- Group Leader, R&D Transfection, and Director and Senior Product Manager, Large Company, Switzerland
- Director, Senior Product Manager, Very Large Company, Switzerland
- Senior Vice President of Technical Applications, Mid-sized Company, US
- Head of Transfection R&D, Very Large Company, Switzerland
NORTH AMERICA NON-VIRAL TRANSFECTION REAGENTS MARKET: RESEARCH COVERAGE
- Market Sizing and Opportunity Analysis: The report features an in-depth analysis of the North America non-viral transfection reagents market, focusing on key market segments, including [A] type of non-viral transfection method, [B] application area, [C] end-user, and [D] sales forecast.
- North America Non-Viral Transfection Reagents - Market Landscape: A detailed assessment of the overall non-viral transfection reagents market landscape in North America, featuring analyses by compatible cell type / line, transfected molecule, type of transfection carrier, type of cell culture, and serum compatibility, along with a review of the provider landscape by year of establishment, company size, and location of headquarters.
- Market Landscape: Electroporation-based Transfection Systems: An in-depth analysis of electroporation-based transfection systems available in North America, based on compatible cell type / line, transfected molecule, type of waveform, and pulse voltage, along with a review of leading system providers.
- Market Landscape: Other Non-Viral Transfection Technologies / Systems: An assessment of emerging non-viral transfection technologies and systems in North America, based on type of offering, compatible cell type / line, and transfected molecule, along with the associated provider landscape.
- Company Competitiveness Analysis: A proprietary competitiveness assessment of non-viral transfection reagent providers based in North America, evaluated across multiple relevant parameters.
- Technology Competitiveness Analysis: A comparative competitiveness assessment of electroporation-based and other non-viral transfection technologies / systems offered by players based in North America.
- Company Profiles: In-depth profiles of prominent players engaged in the North America non-viral transfection reagents industry, featuring information on year of establishment, location of headquarters, company size, financial information, product portfolio, and recent developments.
- Potential Strategic Partners: An analysis identifying most likely, likely, less likely, and least likely strategic partners for non-viral transfection reagent and system providers based in North America.
- Market Trends Analysis: An assessment of prevailing trends in this domain, including ex vivo and in vivo therapy trends and the evolving balance between viral and non-viral vector adoption.
- Patent Analysis: An analysis of patents filed / granted related to non-viral transfection reagents, based on parameters such as type of patent, publication and application year, jurisdiction, CPC symbols, type of applicant, patent benchmarking, and patent valuation.
- Publication Analysis: A review of relevant scientific publications, based on year of publication, active publishers, journal impact factor, and copyright holders.
- Roots Analysis Pricing Strategy Framework: A proprietary pricing framework evaluating product price positioning based on transfection efficiency, compatible cell type / line, type of carrier used, type of molecule delivered, and type of reagent.
- Market Impact Analysis: The report analyzes various factors, such as drivers, restraints, opportunities, and challenges, affecting market growth.
- Executive Insights: Interview transcripts and company snapshots capturing perspectives shared by senior industry stakeholders on the current and future outlook of the non-viral transfection reagents domain.
Key Questions Answered in this Report
- Which are the leading companies in the North America non-viral transfection reagents market?
- Which segment dominates the North America non-viral transfection reagents market?
- What are the key trends observed in the North America non-viral transfection reagents market?
- What factors are likely to influence the evolution of this market?
- What are the primary challenges faced by non-viral transfection reagent developers?
- What is the current and future market size?
- What is the CAGR of this market?
- How is the current and future market opportunity likely to be distributed across key market segments?
Reasons to Buy this Report
This report has been specifically developed to support distributors, channel partners, and business development teams evaluating entry into the North America non-viral transfection reagents market.
- The report provides a comprehensive market analysis, offering detailed revenue projections of the overall market and its specific sub-segments. This information is valuable to both established market leaders and emerging entrants.
- The report offers stakeholders a comprehensive overview of the market, including key drivers, barriers, opportunities, and challenges. This information empowers stakeholders to stay abreast of market trends and make data-driven decisions to capitalize on growth prospects.
- The report can aid businesses in identifying future opportunities in any sector. It also helps in understanding if those opportunities are worth pursuing.
- The report helps in identifying customer demand by understanding the needs, preferences, and behavior of the target audience in order to tailor products or services effectively.
- The report equips new entrants with requisite information regarding a particular market to help them build successful business strategies.
- The report allows for more effective communication with the audience and in building strong business relations.
Additional Benefits
- Complementary PPT Insights Pack
- Complementary Excel Data Packs for all Analytical Modules in the Report
- 15% Free Content Customization
- Detailed Report Walkthrough Session with Research Team
- Free Updated report if the report is 6-12 months old or older
TABLE OF CONTENTS
1. PREFACE
- 1.1. Introduction
- 1.2. Market Share Insights
- 1.3. Key Market Insights
- 1.4. Report Coverage
- 1.5. Key Questions Answered
- 1.6. Chapter Outlines
2. RESEARCH METHODOLOGY
- 2.1. Chapter Overview
- 2.2. Research Assumptions
- 2.2.1. Market Landscape and Market Trends
- 2.2.2. Market Forecast and Opportunity Analysis
- 2.2.3. Comparative Analysis
- 2.3. Database Building
- 2.3.1. Data Collection
- 2.3.2. Data Validation
- 2.3.3. Data Analysis
- 2.4. Project Methodology
- 2.4.1. Secondary Research
- 2.4.1.1. Annual Reports
- 2.4.1.2. Academic Research Papers
- 2.4.1.3. Company Websites
- 2.4.1.4. Investor Presentations
- 2.4.1.5. Regulatory Filings
- 2.4.1.6. White Papers
- 2.4.1.7. Industry Publications
- 2.4.1.8. Conferences and Seminars
- 2.4.1.9. Government Portals
- 2.4.1.10. Media and Press Releases
- 2.4.1.11. Newsletters
- 2.4.1.12. Industry Databases
- 2.4.1.13. Roots Proprietary Databases
- 2.4.1.14. Paid Databases and Sources
- 2.4.1.15. Social Media Portals
- 2.4.1.16. Other Secondary Sources
- 2.4.2. Primary Research
- 2.4.2.1. Types of Primary Research
- 2.4.2.1.1. Qualitative Research
- 2.4.2.1.2. Quantitative Research
- 2.4.2.1.3. Hybrid Approach
- 2.4.2.2. Advantages of Primary Research
- 2.4.2.3. Techniques for Primary Research
- 2.4.2.3.1. Interviews
- 2.4.2.3.2. Surveys
- 2.4.2.3.3. Focus Groups
- 2.4.2.3.4. Observational Research
- 2.4.2.3.5. Social Media Interactions
- 2.4.2.4. Key Opinion Leaders Considered in Primary Research
- 2.4.2.4.1. Company Executives (CXOs)
- 2.4.2.4.2. Board of Directors
- 2.4.2.4.3. Company Presidents and Vice Presidents
- 2.4.2.4.4. Research and Development Heads
- 2.4.2.4.5. Technical Experts
- 2.4.2.4.6. Subject Matter Experts
- 2.4.2.4.7. Scientists
- 2.4.2.4.8. Doctors and Other Healthcare Providers
- 2.4.2.5. Ethics and Integrity
- 2.4.2.5.1. Research Ethics
- 2.4.2.5.2. Data Integrity
- 2.4.2.1. Types of Primary Research
- 2.4.3. Analytical Tools and Databases
- 2.4.1. Secondary Research
- 2.5. Robust Quality Control
3. MARKET DYNAMICS
- 3.1. Chapter Overview
- 3.2. Forecast Methodology
- 3.2.1. Top-down Approach
- 3.2.2. Bottom-up Approach
- 3.2.3. Hybrid Approach
- 3.3. Market Assessment Framework
- 3.3.1. Total Addressable Market (TAM)
- 3.3.2. Serviceable Addressable Market (SAM)
- 3.3.3. Serviceable Obtainable Market (SOM)
- 3.3.4. Currently Acquired Market (CAM)
- 3.4. Forecasting Tools and Techniques
- 3.4.1. Qualitative Forecasting
- 3.4.2. Correlation
- 3.4.3. Regression
- 3.4.4. Extrapolation
- 3.4.5. Convergence
- 3.4.6. Sensitivity Analysis
- 3.4.7. Scenario Planning
- 3.4.8. Data Visualization
- 3.4.9. Time Series Analysis
- 3.4.10. Forecast Error Analysis
- 3.5. Key Considerations
- 3.5.1. Demographics
- 3.5.2. Government Regulations
- 3.5.3. Reimbursement Scenarios
- 3.5.4. Market Access
- 3.5.5. Supply Chain
- 3.5.6. Industry Consolidation
- 3.5.7. Pandemic / Unforeseen Disruptions Impact
- 3.6. Limitations
4. MACRO-ECONOMIC INDICATORS
- 4.1. Chapter Overview
- 4.2. Market Dynamics
- 4.2.1. Time Period
- 4.2.1.1. Historical Trends
- 4.2.1.2. Current and Forecasted Estimates
- 4.2.2. Currency Coverage
- 4.2.2.1. Major Currencies Affecting the Market
- 4.2.2.2. Factors Affecting Currency Fluctuations
- 4.2.2.3. Impact of Currency Fluctuations on the Industry
- 4.2.3. Foreign Currency Exchange Rate
- 4.2.3.1. Impact of Foreign Exchange Rate Volatility on the Market
- 4.2.3.2. Strategies for Mitigating Foreign Exchange Risk
- 4.2.4. Recession
- 4.2.4.1. Assessment of Current Economic Conditions and Potential Impact on the Market
- 4.2.4.2. Historical Analysis of Past Recessions and Lessons Learnt
- 4.2.5. Inflation
- 4.2.5.1. Measurement and Analysis of Inflationary Pressures in the Economy
- 4.2.5.2. Potential Impact of Inflation on the Market Evolution
- 4.2.6. Interest Rates
- 4.2.6.1. Interest Rates and Their Impact on the Market
- 4.2.6.2. Strategies for Managing Interest Rate Risk
- 4.2.7. Commodity Flow Analysis
- 4.2.7.1. Type of Commodity
- 4.2.7.2. Origins and Destinations
- 4.2.7.3. Values and Weights
- 4.2.7.4. Modes of Transportation
- 4.2.8. Global Trade Dynamics
- 4.2.8.1. Import Scenario
- 4.2.8.2. Export Scenario
- 4.2.8.3. Trade Policies
- 4.2.8.4. Strategies for Mitigating the Risks Associated with Trade Barriers
- 4.2.8.5. Impact of Trade Barriers on the Market
- 4.2.9. War Impact Analysis
- 4.2.9.1. Russian-Ukraine War
- 4.2.9.2. Israel-Hamas War
- 4.2.10. COVID Impact / Related Factors
- 4.2.10.1. Global Economic Impact
- 4.2.10.2. Industry-specific Impact
- 4.2.10.3. Government Response and Stimulus Measures
- 4.2.10.4. Future Outlook and Adaptation Strategies
- 4.2.11. Other Indicators
- 4.2.11.1. Fiscal Policy
- 4.2.11.2. Consumer Spending
- 4.2.11.3. Gross Domestic Product
- 4.2.11.4. Employment
- 4.2.11.5. Taxes
- 4.2.11.6. Stock Market Performance
- 4.2.11.7. Cross Border Dynamics
- 4.2.1. Time Period
- 4.3. Conclusion
5. EXECUTIVE SUMMARY
- 5.1. Executive Summary: Market Landscape
- 5.2. Executive Summary: Market Trends
- 5.3. Executive Summary: Market Forecast and Opportunity Analysis
6. INTRODUCTION
- 6.1. Chapter Overview
- 6.2. Introduction to Transfection
- 6.3. Methods of Transfection
- 6.3.1. Virus Based Transfection
- 6.3.1.1. Types of Viral Transfection Vectors
- 6.3.1.1.1. Adeno-associated Virus-based Vectors
- 6.3.1.1.2. Adenovirus-based Vectors
- 6.3.1.1.3. Herpes Virus-based Vectors
- 6.3.1.1.4. Lentivirus-based Vectors
- 6.3.1.1.5. Retrovirus-based Vectors
- 6.3.1.1. Types of Viral Transfection Vectors
- 6.3.2. Non-Virus Based Transfections
- 6.3.2.1. Chemical Methods based Transfection
- 6.3.2.1.1. Lipoplexes-based Transfection
- 6.3.2.1.2. Polyplexes-based Transfection
- 6.3.2.1.3. Lipo-polyplexes-based Transfection
- 6.3.2.1.4. Dendrimer-based Transfection
- 6.3.2.1.5. Cell Penetrating Peptide-based Transfection
- 6.3.2.2. Physical Method based Transfections
- 6.3.2.2.1. Electroporation-based Transfection
- 6.3.2.2.2. Gene Gun-based Transfection
- 6.3.2.2.3. Sonoporation-based Transfection
- 6.3.2.2.4. Microinjection-based Transfection
- 6.3.2.2.5. Magnetofection-based Transfection
- 6.3.2.1. Chemical Methods based Transfection
- 6.3.1. Virus Based Transfection
- 6.4. Applications of Transfection
- 6.4.1. Advanced Therapeutic Medicinal Product Development
- 6.4.2. Gene Silencing
- 6.4.3. Generation of Stable Cell Lines
- 6.4.4. Large-scale Protein Production
- 6.4.5. Stem Cell Engineering
- 6.5. Future Perspective
7. MARKET LANDSCAPE: NORTH AMERICA NON-VIRAL TRANSFECTION REAGENTS
- 7.1. Chapter Overview
- 7.2. North America Non-Viral Transfection Reagents: Overall Market Landscape
- 7.2.1. Analysis by Compatible Cell Type / Line
- 7.2.2. Analysis by Transfected Molecule
- 7.2.3. Analysis by Type of Transfection Carrier Used
- 7.2.4. Analysis by Type of Cell Culture
- 7.2.5. Analysis by Serum Compatibility
- 7.3. North America Non-Viral Transfection Reagent Providers Landscape
- 7.3.1. Analysis by Year of Establishment
- 7.3.2. Analysis by Company Size
- 7.3.3. Analysis by Location of Headquarters (Country)
8. MARKET LANDSCAPE: ELECTROPORATION-BASED TRANSFECTION SYSTEMS IN NORTH AMERICA
- 8.1. Chapter Overview
- 8.2. Electroporation-based Transfection Systems in North America: Overall Market Landscape
- 8.2.1. Analysis by Compatible Cell Type / Line
- 8.2.2. Analysis by Transfected Molecule
- 8.2.3. Analysis by Type of Waveform
- 8.2.4. Analysis by Pulse Voltage
- 8.3. Electroporation-based Transfection System Providers in North America: Landscape
- 8.3.1. Analysis by Year of Establishment
- 8.3.2. Analysis by Company Size
- 8.3.3. Analysis by Location of Headquarters (Country)
- 8.3.4. Analysis by Leading Players
9. MARKET LANDSCAPE: OTHER NON-VIRAL TRANSFECTION TECHNOLOGIES / SYSTEMS IN NORTH AMERICA
- 9.1. Chapter Overview
- 9.2. Other Non-Viral Transfection Technologies / Systems in North America: Market Landscape
- 9.2.1. Analysis by Type of Offering
- 9.2.2. Analysis by Compatible Cell Type / Line
- 9.2.3. Analysis by Transfected Molecule
- 9.3. Other Non-Viral Transfection Technologies / System Providers in North America: Landscape
- 9.3.1. Analysis by Year of Establishment
- 9.3.2. Analysis by Company Size
- 9.3.3. Analysis by Location of Headquarters (Country)
10. COMPANY COMPETITIVENESS ANALYSIS
- 10.1. Chapter Overview
- 10.2. Assumptions and Key Parameters
- 10.3. Methodology
- 10.4. Company Competitiveness Analysis
- 10.4.1. Non-Viral Transfection Reagent Providers based in North America
11. TECHNOLOGY COMPETITIVENESS ANALYSIS
- 11.1. Chapter Overview
- 11.2. Assumptions and Key Parameters
- 11.3. Methodology
- 11.4. Technology Competitiveness Analysis: Electroporation-based Transfection Systems
- 11.4.1. Electroporation-based Transfection Systems Offered by Players based in North America (Peer Group I)
- 11.5. Technology Competitiveness Analysis: Other Non-Viral Transfection Technology / Systems
- 11.5.1. Other Non-Viral Transfection Technologies / Systems Offered by Players based in North America (Peer Group I)
12. COMPANY PROFILES
- 12.1. Chapter Overview
- 12.2. Altogen Biosystems*
- 12.2.1. Company Overview
- 12.2.2. Financial Information
- 12.2.3. Non-Viral Transfection Reagents Portfolio
- 12.2.4. Recent Developments and Future Outlook
- Similar details are presented for other companies mentioned below (based on information in the public domain)
- 12.3. Bio-Rad Laboratories
- 12.4. Cytiva
- 12.5. Harvard Bioscience
- 12.6. MaxCyte
- 12.7. MilliporeSigma
- 12.8. Mirus Bio
- 12.9. Revvity
- 12.10. Thermo Fisher Scientific
13. POTENTIAL STRATEGIC PARTNERS
- 13.1. Chapter Overview
- 13.2. Assumptions and Key Parameters
- 13.3. Scope and Methodology
- 13.4. Potential Strategic Partners for Non-Viral Transfection Reagents and Systems Providers based in North America
- 13.4.1. Most Likely Partners
- 13.4.2. Likely Partners
- 13.4.3. Less Likely Partners
- 13.4.4. Least Likely Partners
14. MARKET TRENDS ANALYSIS
- 14.1. Chapter Overview
- 14.2. Ex-vivo and In-vivo Therapy Trends
- 14.3. Viral and Non-Viral Vector Trends
15. PATENT ANALYSIS
- 15.1. Chapter Overview
- 15.2. Scope and Methodology
- 15.3. North America Non-Viral Transfection Reagents Market: Patent Analysis
- 15.3.1. Analysis by Patent Publication Year
- 15.3.2. Analysis by Type of Patent and Publication Year
- 15.3.3. Analysis by Patent Application Year
- 15.3.4. Analysis by Patent Jurisdiction
- 15.3.5. Analysis by CPC Symbols
- 15.3.6. Analysis by Type of Applicant
- 15.3.7. Leading Players: Analysis by Number of Patents
- 15.3.8. Leading Inventors: Analysis by Number of Patents
- 15.4. Patent Benchmarking Analysis
- 15.4.1. Analysis by Patent Characteristics
- 15.5. Patent Valuation
16. PUBLICATION ANALYSIS
- 16.1. Chapter Overview
- 16.2. Scope and Methodology
- 16.3. North America Non-Viral Transfection Reagents Market: Publication Analysis
- 16.3.1. Analysis by Year of Publication
- 16.3.2. Most Active Publisher: Analysis by Number of Publications
- 16.3.3. Key Journals: Analysis by Journal Impact Factor
- 16.3.4. Most Popular Journals: Analysis by Number of Publications
- 16.4. Prominent Copyright Holders: Analysis by Number of Publications
17. ROOTS ANALYSIS PRICING STRATEGY FRAMEWORK
- 17.1. Chapter Overview
- 17.2. Roots Analysis Framework
- 17.2.1. Methodology
- 17.2.2. Theoretical Framework and Price Evaluation Hypothesis
- 17.2.3. Results and Interpretation
- 17.2.3.1. Product Price Evaluation Matrix: Based on Transfection Efficiency
- 17.2.3.2. Product Price Evaluation Matrix: Based on Compatible Cell Type / Line
- 17.2.3.3. Product Price Evaluation Matrix: Based on Type of Carrier Used
- 17.2.3.4. Product Price Evaluation Matrix: Based on Type of Molecule Delivered
- 17.2.3.5. Product Price Evaluation Matrix: Based on Type of Reagent
- 17.3. Concluding Remarks
18. MARKET IMPACT ANALYSIS
- 18.1. Chapter Overview
- 18.2. Market Drivers
- 18.3. Market Restraints
- 18.4. Market Opportunities
- 18.5. Market Challenges
19. NORTH AMERICA NON-VIRAL TRANSFECTION REAGENTS MARKET
- 19.1. Chapter Overview
- 19.2. Key Assumptions and Methodology
- 19.3. North America Non-Viral Transfection Reagents Market, Historical Trends (Since 2022) and Forecasted Estimates (Till 2035)
- 19.3.1. Scenario Analysis
- 19.3.1.1. Conservative Scenario
- 19.3.1.2. Optimistic Scenario
- 19.3.1. Scenario Analysis
- 19.4. Key Market Segmentations
20. NORTH AMERICA NON-VIRAL TRANSFECTION REAGENTS MARKET, BY TYPE OF NON-VIRAL TRANSFECTION METHOD
- 20.1. Chapter Overview
- 20.2. Key Assumptions and Methodology
- 20.3. North America Non-Viral Transfection Reagents Market: Distribution by Type of Non-Viral Transfection Method
- 20.3.1. North America Non-Viral Transfection Reagents Market for Chemical Methods, Historical Trends (Since 2022) and Forecasted Estimates (Till 2035)
- 20.3.2. North America Non-Viral Transfection Reagents Market for Physical Methods, Historical Trends (Since 2022) and Forecasted Estimates (Till 2035)
- 20.3.3. North America Non-Viral Transfection Reagents Market for Other Methods, Historical Trends (Since 2022) and Forecasted Estimates (Till 2035)
- 20.4. Data Triangulation and Validation
21. NORTH AMERICA NON-VIRAL TRANSFECTION REAGENTS MARKET, BY APPLICATION AREA
- 21.1. Chapter Overview
- 21.2. Key Assumptions and Methodology
- 21.3. North America Non-Viral Transfection Reagents Market: Distribution by Application Area
- 21.3.1. North America Non-Viral Transfection Reagents Market for Research Applications, Historical Trends (Since 2022) and Forecasted Estimates (Till 2035)
- 21.3.2. North America Non-Viral Transfection Reagents Market for Clinical Applications, Historical Trends (Since 2022) and Forecasted Estimates (Till 2035)
- 21.4. Data Triangulation and Validation
22. NORTH AMERICA NON-VIRAL TRANSFECTION REAGENTS MARKET, BY END-USER
- 22.1. Chapter Overview
- 22.2. Key Assumptions and Methodology
- 22.3. North America Non-Viral Transfection Reagents Market: Distribution by End-User
- 22.3.1. North America Non-Viral Transfection Reagents Market for Academic and Research Institutes, Historical Trends (Since 2022) and Forecasted Estimates (Till 2035)
- 22.3.2. North America Non-Viral Transfection Reagents Market for Pharmaceutical and Biopharmaceutical Companies, Historical Trends (Since 2022) and Forecasted Estimates (Till 2035)
- 22.3.3. North America Non-Viral Transfection Reagents Market for Contract Manufacturers, Historical Trends (Since 2022) and Forecasted Estimates (Till 2035)
- 22.3.4. North America Non-Viral Transfection Reagents Market for Other End-Users, Historical Trends (Since 2022) and Forecasted Estimates (Till 2035)
- 22.4. Data Triangulation and Validation
23. CONCLUDING REMARKS
24. EXECUTIVE INSIGHTS
25. APPENDIX I: TABULATED DATA
26. APPENDIX II: LIST OF COMPANIES AND ORGANIZATIONS

