PUBLISHER: Roots Analysis | PRODUCT CODE: 2161890

PUBLISHER: Roots Analysis | PRODUCT CODE: 2161890
Digital Biomanufacturing Market (2nd Edition) - Trends and Global Forecast, Till 2035
DIGITAL BIOMANUFACTURING MARKET: OVERVIEW
As per Roots Analysis, the global digital biomanufacturing market size is expected to grow from USD 2.8 billion in the current year to USD 12.0 billion by 2035, registering a CAGR of 17.6% during the forecast period.
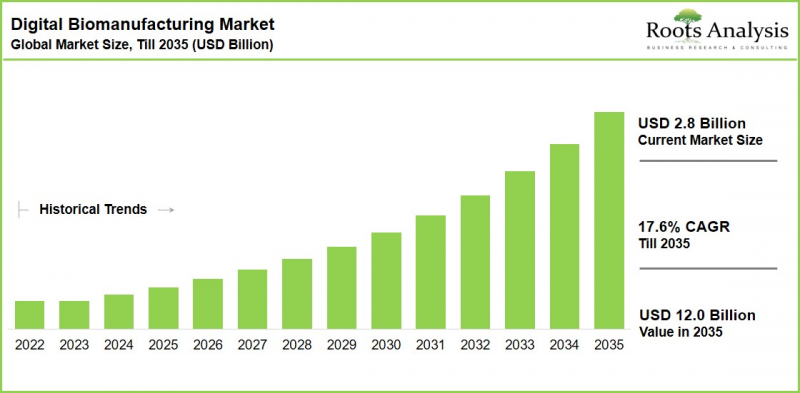
Digital Biomanufacturing Market: Growth and Trends
The inherent complexity of biologic molecules, combined with the need for specialized manufacturing facilities and stringent regulatory requirements, continues to place significant pressure on biopharmaceutical companies to reduce production costs and timelines. In response, the industry is shifting from conventional manufacturing operations toward digitalized, Industry 4.0-enabled biomanufacturing.
Roots Analysis estimates that approximately 20% of biopharmaceutical organizations have already adopted digitalized manufacturing approaches. Early adopters report meaningful gains, including a 40% improvement in product quality, a 15% reduction in costs, an 80% decrease in process variability, and 20% shorter operational timelines.
The competitive landscape comprises more than 135 distinct digital technologies and software solutions offered by over 100 companies. Process analytical technologies represent the largest share at 38% of offerings, followed by manufacturing execution systems (23%) and data analytics software (22%).
Partnership activity has been robust in this market, signaling continuous industrial growth in the future. Since 2018, technology and software providers in this space have entered into more than 125 strategic partnerships, with over 40% of these agreements signed in the past two years. Technology integration has emerged as the predominant partnership model.
Growth Drivers: Factors Fueling Market Expansion
The rising number of approved biologics, expanding biologics-related R&D and clinical trial activity, continues to fuel demand for digital biomanufacturing solutions. These solutions are capable of supporting faster, more consistent, and more cost-effective production. As biopharmaceutical companies scale from clinical to commercial manufacturing, the ability of digital platforms to deliver real-time monitoring, batch-to-batch consistency, and predictive process control has become a decisive competitive advantage. Further, the growing shift towards deployment preference is also shaping the market. While on-premises deployment currently dominates on the strength of data security, privacy, and operational control, cloud-based deployment is gaining ground rapidly as it allows companies to access advanced software capabilities without heavy upfront infrastructure investment, a particularly attractive proposition for small and mid-sized biomanufacturers and emerging market entrants.
Market Challenges: Critical Barriers Hindering Progress
Despite strong growth prospects, the adoption of digital biomanufacturing technologies remains uneven. Many established biopharmaceutical companies still rely on legacy infrastructure, while resistance to organizational change slows digital transformation. Integrating different MES, PAT, DAS, and digital twin systems across multiple vendors further increases technical complexity and implementation costs.
Data security and validation requirements also create concerns, particularly for cloud-based solutions in the highly regulated biopharmaceutical industry. In addition, the market remains fragmented, with more than 100 active vendors and no clear market leader. This makes it difficult for biomanufacturers to select the right technology and commit to a long-term digital platform.
Digital Biomanufacturing Market: Key Insights
The report delves into the current state of the digital biomanufacturing market and identifies potential growth opportunities for distribution partners, systems integrators, and channel intermediaries. Some key insights include:
- Over 100 companies compete in digital biomanufacturing, creating opportunities for solution integrators and value-added resellers to bundle MES, PAT, DAS, and digital twin solutions.
- Strong demand for data security and operational control creates opportunities for partners with implementation, IT integration, and validation capabilities.
- More than 125 strategic partnerships since 2018 highlight strong demand for technology integration and channel partnerships.
- Growing digitalization across China, India, and Japan creates opportunities for distributors with established networks within Asian region.
- Increasing digital adoption among contract manufacturers is expected to drive demand for systems integration and digitalization services.
- A large portion of the vendor base consists of established automation and instrumentation companies expanding into digital solutions, creating opportunities for upgrade and consulting services.
- Growing use of cloud-based platforms is expected to increase demand for cloud integration, cybersecurity, and managed services.
Recent Developments in Digital Biomanufacturing
- Digital Tvilling announced a partnership to build an integrated AI-driven biomanufacturing platform focused on precision fermentation, aiming to reduce production costs for proteins and food ingredients.
- Stamm introduced a high-throughput, automated bioprocessor designed for decentralized biomanufacturing, enabling scalable production of biologics and cell and gene therapies.
- Bota launched SAION AI, a full-stack "Physical AI" platform for biomanufacturing that integrates cognition, orchestration, and execution layers to optimize biological discovery and manufacturing.
- Multiply Labs announced integration of NVIDIA's digital twin, robotics simulation, and AI technologies to scale robotic biomanufacturing for cell and gene therapies.
- WuXi Biologics launched PatroLab(TM), a digital twin platform combining real-time process monitoring, Raman-based analytics, and predictive modeling to enhance bioprocess development and manufacturing.
Digital Biomanufacturing Market Segments
The market sizing and opportunity analysis has been segmented across the following parameters:
By Type of Technology
- Manufacturing Execution Systems (MES)
- Process Analytical Technologies (PAT)
- Data Analytics Software (DAS)
- Digital Twins
By Deployment Option
- Cloud-Based Deployment
- On-Premises Deployment
By Scale of Operation
- Commercial Scale
- Clinical Scale
By Type of Biologic Manufactured
- Antibodies
- Peptides
- Cell and Gene Therapies
- Other Biologics
By End Users
- In-House Developers
- Contract Manufacturers
- Both End Users
By Geographical Regions
- North America
- US
- Canada
- Europe
- Germany
- France
- Italy
- Spain
- UK
- Rest of Europe
- Asia-Pacific
- China
- India
- Japan
- Rest of Asia-Pacific
- Middle East and North Africa
- Saudi Arabia
- United Arab Emirates
- Egypt
- Latin America
- Brazil
- Mexico
- Argentina
Digital Biomanufacturing Market: Key Segments
Manufacturing Execution Systems Lead the Technology Segment
Based on Roots Analysis' market assessment, the MES segment currently leads the digital biomanufacturing market, supported by growing demand for real-time production data and greater operational flexibility among mid-sized and large biomanufacturers. PAT is expected to grow faster during the forecast period, driven by its ability to identify and address manufacturing risks early in the production process.
On-Premises Deployment Dominates the Market
On-premises deployment remains the dominant model, driven by biomanufacturers' focus on data security, privacy, and operational control. Cloud-based deployment is gaining traction as companies seek remote access to digital tools without the need for extensive infrastructure investment.
Commercial Scale Dominates the Market
Commercial-scale digital biomanufacturing currently represents the largest market segment, supported by the growing number of biologics progressing toward late-stage approval. This segment is expected to maintain its leading position as biomanufacturers increasingly adopt digital technologies for large-scale production.
Antibodies Dominate the Biologic Type Segment
Antibodies currently represent the largest segment of digital biomanufacturing by biologic type, supported by the large number of approved antibody therapies in commercial production. Cell and gene therapies represent a smaller but rapidly expanding segment, as manufacturers increasingly adopt digital technologies to improve efficiency, process control, and scalability for these complex therapies.
In-House Developers Lead End-User Demand
In-house developers currently represent the largest end-user segment, supported by their need for greater control over production processes and digital operations. Contract manufacturers account for a smaller share but are expected to increase digital adoption as biopharmaceutical companies increasingly rely on CDMOs for manufacturing capacity and specialized expertise.
Europe Dominates the Regional Landscape
Europe currently leads the digital biomanufacturing market, supported by established biopharmaceutical companies and advanced manufacturing capabilities. Meanwhile, Asia-Pacific, led by China, India, and Japan, is expected to see strong growth as digital biomanufacturing adoption expands.
Example Players in Digital Biomanufacturing Market
- Apprentice
- AspenTech
- CellPort
- Dassault Systemes
- Eppendorf
- FUJIFILM Diosynth Biotechnologies
- GE Vernova
- Korber
- Merck
- Sartorius
- Siemens
- Striim
- Thermo Fisher Scientific
- Tridiagonal Software
- Vimachem
Expert Interview and Industry Insights
The opinions and insights presented in this study were shaped by discussions with multiple stakeholders across the value chain. The research report features detailed transcripts of interviews held with the following industry participants, arranged in decreasing order of seniority level:
- Chief Executive Officer, Founder and President, Small Company, Canada
- Former Chief Executive Officer and Managing Director, Small Company, Germany
- Former Vice President of Operations and Strategic Initiatives, Mid-sized Company, US
- Regional Sales Director, Asia-Pacific, and Quality and Manufacturing Digitization Specialist, Large Company, US
- Former Director of Sales, Mid-sized, Israel
- Business Consultant, Very Large Company, France
DIGITAL BIOMANUFACTURING MARKET: RESEARCH COVERAGE
- Market Sizing and Opportunity Analysis: An in-depth analysis of the market focusing on key segments, including type of technology, deployment option, scale of operation, type of biologic manufactured, end users, and geographical regions.
- Market Landscape Analysis: A detailed assessment of digital biomanufacturing technologies and software, based on type of technology, deployment option, year of establishment, company size, and geographical location.
- Technology Competitiveness and Benchmarking Analysis: A comparative evaluation of digital biomanufacturing technology providers, benchmarked on portfolio strength, deployment flexibility, and technology maturity.
- Company Profiles: In-depth profiles of prominent players engaged in digital biomanufacturing, covering year of establishment, headquarters location, company size, technology portfolio, and key recent initiatives.
- Partnerships and Collaborations: An analysis of the 125+ partnerships inked by digital biomanufacturing technology and software providers since 2018, based on year, type of partnership, type of technology, and most active players.
- Case Study: Digital Twins in Biomanufacturing: A focused assessment of digital twin adoption across biomanufacturing operations, covering key benefits, implementation approaches, and notable industry examples.
- Market Forecast Analysis: A detailed market forecast estimating current market size and future opportunity through 2035, with projections across type of technology, deployment option, scale of operation, type of biologic manufactured, end users, and geography.
KEY QUESTIONS ANSWERED IN THIS REPORT
- What is digital biomanufacturing?
- What is the global digital biomanufacturing market size?
- What is the future outlook for the digital biomanufacturing market?
- What is the anticipated CAGR for the digital biomanufacturing market?
- Which region has the highest market share in the digital biomanufacturing market?
- What are the factors driving the digital biomanufacturing market?
- Which are the leading companies in the digital biomanufacturing market?
- Which segment leads the market by type of technology, and which is growing fastest?
- What opportunities exist for distributors and channel partners entering this space?
Reasons to Buy this Report
This report is designed to give distributors, channel partners, and investors a decisive analytical edge in a fast-growing, still-fragmented software and technology market. Its core differentiators include:
- Top-Down and Bottom-Up Triangulated Forecasting: Market estimates are built using a hybrid methodology that cross-validates top-down macro assessments against bottom-up, company-level technology adoption data, minimizing forecast bias.
- 365 Pages Across Detailed Chapters: Comprehensive coverage spanning market sizing, technology competitiveness benchmarking, partnership and collaboration analysis, and regional mapping across five major geographies.
- Primary Research-Backed Insights: Findings are validated through direct interviews with CEOs, founders, VPs of operations, and regional sales leaders across small, mid-sized, and large technology providers, ensuring insights reflect real operating conditions.
- Actionable Segmentation: Six-parameter segmentation (type of technology, deployment option, scale of operation, type of biologic manufactured, end users, geography) enables precise opportunity sizing for any go-to-market or investment thesis.
ADDITIONAL BENEFITS
- Complimentary PPT Insights Pack
- Complimentary Excel Data Packs covering Market Landscape, Technology Competitiveness Analysis, Benchmarking Analysis, Partnerships and Collaborations, and Market Sizing and Opportunity Analysis
- 15% Free Customization
- Detailed Report Walkthrough Session with Research Team
- Free Updated Report if the Report is 6-12 Months Old or Older
TABLE OF CONTENTS
1. PREFACE
- 1.1. Introduction
- 1.2. Market Share Insights
- 1.3. Key Market Insights
- 1.4. Report Coverage
- 1.5. Key Questions Answered
- 1.6. Chapter Outlines
2. RESEARCH METHODOLOGY
- 2.1. Chapter Overview
- 2.2. Research Assumptions
- 2.2.1. Market Landscape and Market Trends
- 2.2.2. Market Forecast and Opportunity Analysis
- 2.2.3. Comparative Analysis
- 2.3. Database Building
- 2.3.1. Data Collection
- 2.3.2. Data Validation
- 2.3.3. Data Analysis
- 2.4. Project Methodology
- 2.4.1. Secondary Research
- 2.4.1.1. Annual Reports
- 2.4.1.2. Academic Research Papers
- 2.4.1.3. Company Websites
- 2.4.1.4. Investor Presentations
- 2.4.1.5. Regulatory Filings
- 2.4.1.6. White Papers
- 2.4.1.7. Industry Publications
- 2.4.1.8. Conferences and Seminars
- 2.4.1.9. Government Portals
- 2.4.1.10. Media and Press Releases
- 2.4.1.11. Newsletters
- 2.4.1.12. Industry Databases
- 2.4.1.13. Roots Proprietary Databases
- 2.4.1.14. Paid Databases and Sources
- 2.4.1.15. Social Media Portals
- 2.4.1.16. Other Secondary Sources
- 2.4.2. Primary Research
- 2.4.2.1. Types of Primary Research
- 2.4.2.1.1. Qualitative Research
- 2.4.2.1.2. Quantitative Research
- 2.4.2.1.3. Hybrid Approach
- 2.4.2.2. Advantages of Primary Research
- 2.4.2.3. Techniques for Primary Research
- 2.4.2.3.1. Interviews
- 2.4.2.3.2. Surveys
- 2.4.2.3.3. Focus Groups
- 2.4.2.3.4. Observational Research
- 2.4.2.3.5. Social Media Interactions
- 2.4.2.4. Key Opinion Leaders Considered in Primary Research
- 2.4.2.4.1. Company Executives (CXOs)
- 2.4.2.4.2. Board of Directors
- 2.4.2.4.3. Company Presidents and Vice Presidents
- 2.4.2.4.4. Research and Development Heads
- 2.4.2.4.5. Technical Experts
- 2.4.2.4.6. Subject Matter Experts
- 2.4.2.4.7. Scientists
- 2.4.2.4.8. Doctors and Other Healthcare Providers
- 2.4.2.5. Ethics and Integrity
- 2.4.2.5.1. Research Ethics
- 2.4.2.5.2. Data Integrity
- 2.4.2.1. Types of Primary Research
- 2.4.3. Analytical Tools and Databases
- 2.4.1. Secondary Research
- 2.5. Robust Quality Control
3. MARKET DYNAMICS
- 3.1. Chapter Overview
- 3.2. Forecast Methodology
- 3.2.1. Top-down Approach
- 3.2.2. Bottom-up Approach
- 3.2.3. Hybrid Approach
- 3.3. Market Assessment Framework
- 3.3.1. Total Addressable Market (TAM)
- 3.3.2. Serviceable Addressable Market (SAM)
- 3.3.3. Serviceable Obtainable Market (SOM)
- 3.3.4. Currently Acquired Market (CAM)
- 3.4. Forecasting Tools and Techniques
- 3.4.1. Qualitative Forecasting
- 3.4.2. Correlation
- 3.4.3. Regression
- 3.4.4. Extrapolation
- 3.4.5. Convergence
- 3.4.6. Sensitivity Analysis
- 3.4.7. Scenario Planning
- 3.4.8. Data Visualization
- 3.4.9. Time Series Analysis
- 3.4.10. Forecast Error Analysis
- 3.5. Key Considerations
- 3.5.1. Demographics
- 3.5.2. Government Regulations
- 3.5.3. Reimbursement Scenarios
- 3.5.4. Market Access
- 3.5.5. Supply Chain
- 3.5.6. Industry Consolidation
- 3.5.7. Pandemic / Unforeseen Disruptions Impact
- 3.6. Limitations
4. MACRO-ECONOMIC INDICATORS
- 4.1. Chapter Overview
- 4.2. Market Dynamics
- 4.2.1. Time Period
- 4.2.1.1. Historical Trends
- 4.2.1.2. Current and Forecasted Estimates
- 4.2.2. Currency Coverage
- 4.2.2.1. Major Currencies Affecting the Market
- 4.2.2.2. Factors Affecting Currency Fluctuations on the Industry
- 4.2.2.3. Impact of Currency Fluctuations on the Industry
- 4.2.3. Foreign Currency Exchange Rate
- 4.2.3.1. Impact of Foreign Exchange Rate Volatility on the Market
- 4.2.3.2. Strategies for Mitigating Foreign Exchange Risk
- 4.2.4. Recession
- 4.2.4.1. Assessment of Current Economic Conditions and Potential Impact on the Market
- 4.2.4.2. Historical Analysis of Past Recessions and Lessons Learnt
- 4.2.5. Inflation
- 4.2.5.1. Measurement and Analysis of Inflationary Pressures in the Economy
- 4.2.5.2. Potential Impact of Inflation on the Market Evolution
- 4.2.6. Interest Rates
- 4.2.6.1. Interest Rates and Their Impact on the Market
- 4.2.6.2. Strategies for Managing Interest Rate Risk
- 4.2.7. Commodity Flow Analysis
- 4.2.7.1. Type of Commodity
- 4.2.7.2. Origins and Destinations
- 4.2.7.3. Values and Weights
- 4.2.7.4. Modes of Transportation
- 4.2.8. Global Trade Dynamics
- 4.2.8.1. Import Scenario
- 4.2.8.2. Export Scenario
- 4.2.8.3. Trade Policies
- 4.2.8.4. Strategies for Mitigating the Risks Associated with Trade Barriers
- 4.2.8.5. Impact of Trade Barriers on the Market
- 4.2.9. War Impact Analysis
- 4.2.9.1. Russian-Ukraine War
- 4.2.9.2. Israel-Hamas War
- 4.2.10. COVID Impact / Related Factors
- 4.2.10.1. Global Economic Impact
- 4.2.10.2. Industry-specific Impact
- 4.2.10.3. Government Response and Stimulus Measures
- 4.2.10.4. Future Outlook and Adaptation Strategies
- 4.2.11. Other Indicators
- 4.2.11.1. Fiscal Policy
- 4.2.11.2. Consumer Spending
- 4.2.11.3. Gross Domestic Product
- 4.2.11.4. Employment
- 4.2.11.5. Taxes
- 4.2.11.6. Stock Market Performance
- 4.2.11.7. Cross Border Dynamics
- 4.2.1. Time Period
- 4.3. Conclusion
5. EXECUTIVE SUMMARY
6. INTRODUCTION
- 6.1. Chapter Overview
- 6.2. Overview of Digital Biomanufacturing in Healthcare
- 6.3. Emerging Technologies that Support Digital Biomanufacturing
- 6.3.1. Process Analytical Technology (PAT)
- 6.3.2. Data Analytics Software (DAS)
- 6.3.3. Bioprocess Digital Twins
- 6.3.4. Manufacturing Execution Systems (MES)
- 6.4. Challenges Associated with the Adoption of Digital Biomanufacturing
- 6.5. Future Perspectives
7. MARKET LANDSCAPE: PROCESS ANALYTICAL TECHNOLOGY
- 7.1. Chapter Overview
- 7.2. Process Analytical Technologies: Overall Market Landscape
- 7.2.1. Analysis by Deployment Option
- 7.2.2. Analysis by Technology Capability
- 7.3. Process Analytical Technologies: Providers Landscape
- 7.3.1. Analysis by Year of Establishment
- 7.3.2. Analysis by Company Size
- 7.3.3. Analysis by Location of Headquarters
- 7.3.4. Analysis by Number of Technologies Offered
- 7.3.5. Analysis by End Users
- 7.3.6. Analysis by Year of Establishment, Location of Headquarters and Technology Capability
- 7.3.7. Process Analytical Technologies: Competitive Analysis by Years of Experience, Location of Headquarters and Number of Technology Capabilities
8. MARKET LANDSCAPE: DATA ANALYTICS SOFTWARE
9. MARKET LANDSCAPE: MANUFACTURING EXECUTION SYSTEM
10. MARKET LANDSCAPE: DIGITAL TWINS
12. REGIONAL CAPABILITY ANALYSIS
13. COMPANY PROFILES: LEADING PLAYERS OFFERING PROCESS ANALYTICAL TECHNOLOGY
- 13.1. Chapter Overview
- 13.2. AspenTech
- 13.2.1. Company Overview
- 13.2.2. Financial Information
- 13.2.3. Technology Portfolio
- 13.2.4. Recent Developments and Future Outlook
- 13.3. FUJIFILM Diosynth Biotechnologies
- 13.3.1. Company Overview
- 13.3.2. Financial Information
- 13.3.3. Technology Portfolio
- 13.3.4. Recent Developments and Future Outlook
- 13.4. Merck
- 13.4.1. Company Overview
- 13.4.2. Financial Information
- 13.4.3. Technology Portfolio
- 13.4.4. Recent Developments and Future Outlook
- 13.5. Thermo Fisher Scientific
- 13.5.1. Company Overview
- 13.5.2. Financial Information
- 13.5.3. Technology Portfolio
- 13.5.4. Recent Developments and Future Outlook
14. COMPANY PROFILES: LEADING PLAYERS OFFERING DATA ANALYTICS SOFTWARE
- 14.1. Chapter Overview
- 14.2. Sartorius
- 14.2.1. Company Overview
- 14.2.2. Financial Information
- 14.2.3. Technology Portfolio
- 14.2.4. Recent Developments and Future Outlook
- 14.3. Eppendorf
- 14.3.1. Company Overview
- 14.3.2. Financial Information
- 14.3.3. Technology Portfolio
- 14.3.4. Recent Developments and Future Outlook
- 14.4. Striim
- 14.4.1. Company Overview
- 14.4.2. Technology Portfolio
- 14.5. Tridiagonal Software
- 14.5.1. Company Overview
- 14.5.2. Technology Portfolio
15. COMPANY PROFILES: LEADING PLAYERS OFFERING DIGITAL TWINS
- 15.1. Chapter Overview
- 15.2. Dassault Systemes
- 15.2.1. Company Overview
- 15.2.2. Financial Information
- 15.2.3. Technology Portfolio
- 15.2.4. Recent Developments and Future Outlook
- 15.3. Korber
- 15.3.1. Company Overview
- 15.3.2. Technology Portfolio
- 15.4. Siemens
- 15.4.1. Company Overview
- 15.4.2. Technology Portfolio
16. COMPANY PROFILES: LEADING PLAYERS OFFERING MANUFACTURING EXECUTION SYSTEM
- 16.1. Chapter Overview
- 16.2. Apprentice
- 16.2.1. Company Overview
- 16.2.2. Financial Information
- 16.2.3. Technology Portfolio
- 16.2.4. Recent Developments and Future Outlook
- 16.3. CellPort
- 16.3.1. Company Overview
- 16.3.2. Technology Portfolio
- 16.4. GE Vernova
- 16.4.1. Company Overview
- 16.4.2. Technology Portfolio
- 16.5. Vimachem
- 16.5.1. Company Overview
- 16.5.2. Technology Portfolio
17. PARTNERSHIPS AND COLLABORATIONS
- 17.1. Chapter Overview
- 17.2. Partnership Models
- 17.3. Digital Biomanufacturing: Partnerships and Collaborations
- 17.3.1. Analysis by Year of Partnership, Since 2018
- 17.3.2. Analysis by Type of Partnership
- 17.3.3. Analysis by Year and Type of Partnership, Since 2018
- 17.3.4. Analysis by Type of Technology
- 17.3.5. Analysis by Year of Partnership and Type of Technology, Since 2018
- 17.3.6. Analysis by Type of Partner
- 17.3.7. Most Active Players: Analysis by Number of Partnerships
- 17.3.8. Analysis by Geography
- 17.3.8.1. Local and International Agreements
- 17.3.8.2. Intracontinental and Intercontinental Agreements
18. MARKET CONCENTRATION ANALYSIS
- 18.1. Chapter Overview
- 18.2. Assumptions and Key Parameters
- 18.3. Methodology
- 18.4. Market Concentration Analysis: Digital Biomanufacturing Providers
19. INDUSTRY LIFECYCLE ANALYSIS
- 19.1. Chapter Overview
- 19.2. Overview of Industry Lifecycle
- 19.3. Digital Biomanufacturing: Historical Timeline of Key Events
- 19.4. Digital Biomanufacturing: Start-up Activity
- 19.5. Digital Biomanufacturing: Activity of Established Players
- 19.6. Digital Biomanufacturing: Partnership and Collaboration Trends
- 19.7. Digital Biomanufacturing: Funding and Investments Trends
- 19.8. Current Barriers to Wider Adoption of Digitalization in Biomanufacturing
- 19.9. Future Outlook of Digital Biomanufacturing
- 19.10. Industry Lifecycle Analysis: Digital Biomanufacturing
20. GLOBAL DIGITAL BIOMANUFACTURING MARKET
- 20.1. Chapter Overview
- 20.2. Assumptions and Methodology
- 20.3. Global Digital Biomanufacturing Market: Historical Trends (2022-2024) and Forecasted Estimates (2025-2035)
- 20.3.1. Scenario Analysis
- 20.3.1.1. Conservative Scenario
- 20.3.1.2. Optimistic Scenario
- 20.3.1. Scenario Analysis
- 20.4. Key Market Segmentations
21. DIGITAL BIOMANUFACTURING MARKET, BY TYPE OF TECHNOLOGY
- 21.1. Chapter Overview
- 21.2. Key Assumptions and Methodology
- 21.3. Digital Biomanufacturing Market: Distribution by Type of Technology
- 21.3.1. Digital Biomanufacturing Market for MES: Historical Trends (since 2022) and Forecasted Estimates (till 2035)
- 21.3.2. Digital Biomanufacturing Market for PAT Historical Trends (since 2022) and Forecasted Estimates (till 2035)
- 21.3.3. Digital Biomanufacturing Market for DAS: Historical Trends (since 2022) and Forecasted Estimates (till 2035)
- 21.3.4. Digital Biomanufacturing Market for DT: Historical Trends (since 2022) and Forecasted Estimates (till 2035)
- 21.4. Data Triangulation and Validation and Validation
22. DIGITAL BIOMANUFACTURING MARKET, BY DEPLOYMENT OPTION
- 22.1. Chapter Overview
- 22.2. Key Assumptions and Methodology
- 22.3. Digital Biomanufacturing Market: Distribution by Deployment Option
- 22.3.1. Digital Biomanufacturing Market for On-premises Deployment: Historical Trends (since 2022) and Forecasted Estimates (till 2035)
- 22.3.2. Digital Biomanufacturing Market for Cloud-based Deployment: Historical Trends (since 2022) and Forecasted Estimates (till 2035)
- 22.4. Data Triangulation and Validation
23. DIGITAL BIOMANUFACTURING MARKET, BY SCALE OF OPERATION
- 23.1. Chapter Overview
- 23.2. Key Assumptions and Methodology
- 23.3. Digital Biomanufacturing Market: Distribution by Type of Technology
- 23.3.1. Digital Biomanufacturing Market for Commercial Scale: Historical Trends (since 2022) and Forecasted Estimates (till 2035)
- 23.3.2. Digital Biomanufacturing Market for Clinical Scale: Historical Trends (since 2022) and Forecasted Estimates (till 2035)
- 23.4. Data Triangulation and Validation
24. DIGITAL BIOMANUFACTURING MARKET, BY TYPE OF BIOLOGIC MANUFACTURED
- 24.1. Chapter Overview
- 24.2. Key Assumptions and Methodology
- 24.3. Digital Biomanufacturing Market: Distribution by Type of Biologic Manufactured
- 24.3.1. Digital Biomanufacturing Market for Antibodies: Historical Trends (since 2022) and Forecasted Estimates (till 2035)
- 24.3.2. Digital Biomanufacturing Market for Peptides: Historical Trends (since 2022) and Forecasted Estimates (till 2035)
- 24.3.3. Digital Biomanufacturing Market for Cell and Gene Therapies: Historical Trends (since 2022) and Forecasted Estimates (till 2035)
- 24.3.4. Digital Biomanufacturing Market for Other Biologics: Historical Trends (since 2022) and Forecasted Estimates (till 2035)
- 24.4. Data Triangulation and Validation
25. DIGITAL BIOMANUFACTURING MARKET, BY END USERS
- 25.1. Chapter Overview
- 25.2. Key Assumptions and Methodology
- 25.3. Digital Biomanufacturing Market: Distribution by End Users
- 25.3.1. Digital Biomanufacturing Market for In-house Developers: Historical Trends (since 2022) and Forecasted Estimates (till 2035)
- 25.3.2. Digital Biomanufacturing Market for Contract Manufacturers: Historical Trends (since 2022) and Forecasted Estimates (till 2035)
- 25.3.3. Digital Biomanufacturing Market for Both End Users: Historical Trends (since 2022) and Forecasted Estimates (till 2035)
- 25.4. Data Triangulation and Validation
26. DIGITAL BIOMANUFACTURING MARKET, BY GEOGRAPHICAL REGIONS
- 26.1. Chapter Overview
- 26.2. Key Assumptions and Methodology
- 26.3. Digital Biomanufacturing Market: Distribution by Key Geographical Regions
- 26.3.1. Digital Biomanufacturing Market in North America: Historical Trends (since 2022) and Forecasted Estimates (till 2035)
- 26.3.1.1. Digital Biomanufacturing Market in the US: Historical Trends (since 2022) and Forecasted Estimates (till 2035)
- 26.3.1.2. Digital Biomanufacturing Market in Canada: Historical Trends (2022-2024) and Forecasted Estimates (2025-2035)
- 26.3.2. Digital Biomanufacturing Market in Europe: Historical Trends (since 2022) and Forecasted Estimates (till 2035)
- 26.3.2.1. Digital Biomanufacturing Market in Germany: Historical Trends (since 2022) and Forecasted Estimates (till 2035)
- 26.3.2.2. Digital Biomanufacturing Market in France: Historical Trends (since 2022) and Forecasted Estimates (till 2035)
- 26.3.2.3. Digital Biomanufacturing Market in Italy: Historical Trends (since 2022) and Forecasted Estimates (till 2035)
- 26.3.2.4. Digital Biomanufacturing Market in Spain: Historical Trends (since 2022) and Forecasted Estimates (till 2035)
- 26.3.2.5. Digital Biomanufacturing Market in the UK: Historical Trends (since 2022) and Forecasted Estimates (till 2035)
- 26.3.2.6. Digital Biomanufacturing Market in Rest of Europe: Historical Trends (since 2022) and Forecasted Estimates (till 2035)
- 26.3.3. Digital Biomanufacturing Market in Asia-Pacific: Historical Trends (since 2022) and Forecasted Estimates (till 2035)
- 26.3.3.1. Digital Biomanufacturing Market in China: Historical Trends (since 2022) and Forecasted Estimates (till 2035)
- 26.3.3.2. Digital Biomanufacturing Market in India: Historical Trends (since 2022) and Forecasted Estimates (till 2035)
- 26.3.3.3. Digital Biomanufacturing in Rest of Asia-Pacific: Historical Trends (since 2022) and Forecasted Estimates (till 2035)
- 26.3.4. Digital Biomanufacturing Market in Middle East and North Africa: Historical Trends (since 2022) and Forecasted Estimates (till 2035)
- 26.3.4.1. Digital Biomanufacturing Market in Saudi Arabia: Historical Trends (since 2022) and Forecasted Estimates (till 2035)
- 26.3.4.2. Digital Biomanufacturing Market in United Arab Emirates: Historical Trends (since 2022) and Forecasted Estimates (till 2035)
- 26.3.4.3. Digital Biomanufacturing in Egypt: Historical Trends (since 2022) and Forecasted Estimates (till 2035)
- 26.3.5. Digital Biomanufacturing Market in Latin America: Historical Trends (since 2022) and Forecasted Estimates (till 2035)
- 26.3.5.1. Digital Biomanufacturing Market in Brazil: Historical Trends (since 2022) and Forecasted Estimates (till 2035)
- 26.3.5.2. Digital Biomanufacturing Market in Mexico: Historical Trends (since 2022) and Forecasted Estimates (till 2035)
- 26.3.5.3. Digital Biomanufacturing in Argentina: Historical Trends (since 2022) and Forecasted Estimates (till 2035)
- 26.3.1. Digital Biomanufacturing Market in North America: Historical Trends (since 2022) and Forecasted Estimates (till 2035)
- 26.4. Market Dynamics Assessment
- 26.4.1. Penetration Growth (P-G) Matrix
- 26.5. Data Triangulation and Validation
27. CONCLUDING INSIGHTS
28. EXECUTIVE INSIGHTS
29. APPENDIX I: TABULATED DATA
30. APPENDIX 2: LIST OF COMPANIES AND ORGANIZATIONS
List of Tables
- Table 7.1 Process Analytical Technologies: Information on Technology Name, Technology Provider and Deployment Option
- Table 7.2 Process Analytical Technologies: Information on Technology Capability
- Table 7.3 Process Analytical Technologies: Information on Additional Technology Capability, Type of Biologic Manufactured and Regulatory Compliance
- Table 7.4 Process Analytical Technology Providers: Information on Year of Establishment, Company Size, Location of Headquarters, Number of Technologies Offered and End Users
- Table 8.1 Data Analytics Software: Information on Software Name, Software Provider and Deployment Option
- Table 8.2 Data Analytics Software: Information on Software Capability
- Table 8.3 Data Analytics Software: Information on Integrated Technology, Type of Biologic Manufactured and Regulatory Compliance
- Table 8.4 Data Analytical Software Providers: Information on Year of Establishment, Company Size, Location of Headquarters, Number of Software Offered and End Users
- Table 9.1 Manufacturing Execution Systems: Information on Technology Name, Technology Provider and Deployment Option
- Table 9.2 Manufacturing Execution Systems: Information on Technology Capability and Integrated Software
- Table 9.3 Manufacturing Execution Systems: Information on Regulatory Compliance
- Table 9.4 Manufacturing Execution Systems: Information on Type of License and Type of Biologic Manufactured
- Table 9.5 Manufacturing Execution System Providers: Information on Year of Establishment, Company Size, Location of Headquarters and Type of Service Offered
- Table 10.1 Digital Twins: Information on Technology Capability
- Table 10.2 Digital Twins: Information on Type of Twin and Integrated Technology
- Table 10.3 Digital Twins Providers: Information on Year of Establishment, Company Size, Location of Headquarters, Number of Technologies Offered and End Users
- Table 11.1 Competitive Analysis: Process Analytical Technologies for Digital Biomanufacturing
- Table 11.2 Competitive Analysis: Data Analytics Software for Digital Biomanufacturing
- Table 11.3 Competitive Analysis: Manufacturing Execution Systems for Digital Biomanufacturing
- Table 11.4 Competitive Analysis: Digital Twins for Digital Biomanufacturing
- Table 13.1 Process Analytical Technology Providers: List of Companies Profiled
- Table 13.2 AspenTech: Company Snapshot
- Table 13.3 AspenTech: Technology Capabilities
- Table 13.4 AspenTech: Recent Developments and Future Outlook
- Table 13.5 FUJIFILM Diosynth Biotechnologies: Company Snapshot
- Table 13.6 FUJIFILM Diosynth Biotechnologies: Technology Capabilities
- Table 13.7 FUJIFILM Diosynth Biotechnologies: Recent Developments and Future Outlook
- Table 13.8 Merck: Company Snapshot
- Table 13.9 Merck: Technology Capabilities
- Table 13.10 Merck: Recent Developments and Future Outlook
- Table 13.11 Thermo Fisher Scientific: Company Snapshot
- Table 13.12 Thermo Fisher Scientific: Technology Capabilities
- Table 13.13 Thermo Fisher Scientific: Recent Developments and Future Outlook
- Table 14.1 Data Analytics Software Providers: List of Companies Profiled
- Table 14.2 Sartorius: Company Snapshot
- Table 14.3 Sartorius: Technology Portfolio
- Table 14.4 Sartorius: Recent Developments and Future Outlook
- Table 14.5 Eppendorf: Company Snapshot
- Table 14.6 Eppendorf: Technology Portfolio
- Table 14.7 Eppendorf: Recent Developments and Future Outlook
- Table 14.8 Striim: Company Snapshot
- Table 14.9 Striim: Technology Portfolio
- Table 14.10 Tridiagonal Software: Company Snapshot
- Table 14.11 Tridiagonal Software: Technology Portfolio
- Table 15.1 Digital Twin Providers: List of Companies Profiled
- Table 15.2 Dassault Systemes: Company Snapshot
- Table 15.3 Dassault Systemes: Technology Portfolio
- Table 15.4 Korber: Company Snapshot
- Table 15.5 Korber: Technology Portfolio
- Table 15.6 Siemens: Company Snapshot
- Table 15.7 Siemens: Technology Portfolio
- Table 16.1 Manufacturing Execution System Providers: List of Companies Profiled
- Table 16.2 Apprentice: Company Snapshot
- Table 16.3 Apprentice: Technology Portfolio
- Table 16.4 CellPort: Company Snapshot
- Table 16.5 CellPort: Technology Portfolio
- Table 16.6 GE Vernova: Company Snapshot
- Table 16.7 GE Vernova: Technology Portfolio
- Table 16.8 Vimachem: Company Snapshot
- Table 16.9 Vimachem: Technology Portfolio
- Table 17.1 Digital Biomanufacturing Market: List of Partnerships and Collaborations, Since 2018
- Table 17.2 Partnerships and Collaborations: Information on Type of Agreement
- Table 18.1 Digital Biomanufacturing Providers: Information on Year of Entrance, Company Size, Type of Technology, Number of Technologies / Software Offered and Number of Partnerships Inked
- Table 19.1 Overview of Industry Lifecycle Analysis
- Table 19.2 Industry Lifecycle Analysis for Digital Biomanufacturing
- Table 28.1 BioIntelligence Technologies: Company Snapshot
- Table 28.2 Yokogawa Insilico Biotechnology: Company Snapshot
- Table 28.3 Aizon: Company Snapshot
- Table 28.4 MasterControl: Company Snapshot
- Table 28.5 Trunovate: Company Snapshot
- Table 28.6 Dassault Systemes: Company Snapshot
- Table 29.1 Digital Biomanufacturing Technologies: Distribution by Type of Technology
- Table 29.2 Process Analytical Technologies: Distribution by Deployment Option
- Table 29.3 Process Analytical Technologies: Distribution by Technology Capability
- Table 29.4 Process Analytical Technology Providers: Distribution by Year of Establishment
- Table 29.5 Process Analytical Technology Providers: Distribution by Company Size
- Table 29.6 Process Analytical Technology Providers: Distribution by Location of Headquarters (Region)
- Table 29.7 Process Analytical Technology Providers: Distribution by Location of Headquarters (Country)
- Table 29.8 Process Analytical Technology Providers: Distribution by Number of Technologies Offered
- Table 29.9 Process Analytical Technology Providers: Distribution by End Users
- Table 29.10 Process Analytical Technologies: Distribution by Year of Establishment, Location of Headquarters and Technology Capability
- Table 29.11 Data Analytics Software: Distribution by Deployment Option
- Table 29.12 Data Analytics Software: Distribution by Software Capability
- Table 29.13 Data Analytics Software Providers: Distribution by Year of Establishment
- Table 29.14 Data Analytics Software Providers: Distribution by Company Size
- Table 29.15 Data Analytics Software Providers: Distribution by Location of Headquarters (Region)
- Table 29.16 Data Analytics Software Providers: Distribution by Location of Headquarters (Country)
- Table 29.17 Data Analytics Software Providers: Distribution by Number of Software Offered
- Table 29.18 Data Analytics Software Providers: Distribution by End Users
- Table 29.19 Data Analytics Software Providers: Distribution by Year of Establishment, Location of Headquarters and Software Capability
- Table 29.20 Manufacturing Execution Systems: Distribution by Deployment Option
- Table 29.21 Manufacturing Execution Systems: Distribution by Technology Capability
- Table 29.22 Manufacturing Execution Systems: Distribution by Integrated Software
- Table 29.23 Manufacturing Execution Systems: Distribution by Regulatory Compliance
- Table 29.24 Manufacturing Execution Systems Providers: Distribution by Year of Establishment
- Table 29.25 Manufacturing Execution Systems Providers: Distribution by Company Size
- Table 29.26 Manufacturing Execution Systems Providers: Distribution by Location of Headquarters (Region)
- Table 29.27 Manufacturing Execution Systems Providers: Distribution by Location of Headquarters (Country)
- Table 29.28 Manufacturing Execution Systems: Distribution by Type of Service Offered
- Table 29.29 Digital Twins: Distribution by Technology Capability
- Table 29.30 Digital Twins: Distribution by Type of Twin
- Table 29.31 Digital Twins: Distribution by Integrated Technology
- Table 29.32 Digital Twins Providers: Distribution by Year of Establishment
- Table 29.33 Digital Twins Providers: Distribution by Company Size
- Table 29.34 Digital Twins Providers: Distribution by Location of Headquarters (Region)
- Table 29.35 Digital Twins Providers: Distribution by Location of Headquarters (Country)
- Table 29.36 Digital Twins Providers: Distribution by Number of Technologies Offered
- Table 29.37 Digital Twins Providers: Distribution by End Users
- Table 29.38 AspenTech: Annual Revenues, FY 2021 onwards (USD Million)
- Table 29.39 FUJIFILM Diosynth Biotechnologies: Business Segment-wise Revenues, FY 2021 onwards (Billion Yen)
- Table 29.40 Merck: Business Segment-wise Revenues, FY 2021 onwards (EUR Billion)
- Table 29.41 Thermo Fisher Scientific: Business Segment-wise Revenues, FY 2021 onwards (USD Billion)
- Table 29.42 Sartorius: Business Segment-wise Revenues, FY 2022 onwards (EUR Billion)
- Table 29.43 Eppendorf: Business Segment-wise Revenues, FY 2021 onwards (EUR Million)
- Table 29.44 Dassault Systemes: Annual Revenues, FY 2021 onwards (EUR Million)
- Table 29.45 Regional Capability Analysis: Distribution by Location of Headquarters and Company Size
- Table 29.46 Partnerships and Collaborations: Cumulative Year-wise Trend, Since 2018
- Table 29.47 Partnerships and Collaborations: Distribution by Type of Partnership
- Table 29.48 Partnerships and Collaborations: Distribution by Year and Type of Partnership, Since 2018
- Table 29.49 Partnerships and Collaborations: Distribution by Type of Technology
- Table 29.50 Partnerships and Collaborations: Distribution by Year of Partnership and Type of Technology, Since 2018
- Table 29.51 Partnerships and Collaborations: Distribution by Type of Partner
- Table 29.52 Most Active Players: Distribution by Number of Partnerships
- Table 29.53 Partnerships and Collaborations: Local and International Agreements
- Table 29.54 Partnerships and Collaborations: Intracontinental and Intercontinental Agreements
- Table 29.55 Global Digital Biomanufacturing Market, Historical Trends (since 2022) and Forecasted Estimates (till 2035) (USD Billion)
- Table 29.56 Global Digital Biomanufacturing Market, Forecasted Estimates (till 2035): Conservative Scenario (USD Billion)
- Table 29.57 Global Digital Biomanufacturing Market, Forecasted Estimates (till 2035): Optimistic Scenario (USD Billion)
- Table 29.58 Digital Biomanufacturing Market: Distribution by Type of Technology
- Table 29.59 Digital Biomanufacturing Market for MES: Historical Trends (since 2022) and Forecasted Estimates, Conservative, Base and Optimistic Scenarios (till 2035) (USD Million)
- Table 29.60 Digital Biomanufacturing Market for PAT: Historical Trends (since 2022) and Forecasted Estimates, Conservative, Base and Optimistic Scenarios (till 2035) (USD Million)
- Table 29.61 Digital Biomanufacturing Market for DAS: Historical Trends (since 2022) and Forecasted Estimates, Conservative, Base and Optimistic Scenarios (till 2035) (USD Million)
- Table 29.62 Digital Biomanufacturing Market for DT: Historical Trends (since 2022) and Forecasted Estimates, Conservative, Base and Optimistic Scenarios (till 2035) (USD Million)
- Table 29.63 Digital Biomanufacturing Market: Distribution by Deployment Option
- Table 29.64 Digital Biomanufacturing Market for On-premises Deployment: Historical Trends (since 2022) and Forecasted Estimates, Conservative, Base and Optimistic Scenarios (till 2035) (USD Million)
- Table 29.65 Digital Biomanufacturing Market for Cloud-based Deployment: Historical Trends (since 2022) and Forecasted Estimates, Conservative, Base and Optimistic Scenarios (till 2035) (USD Million)
- Table 29.66 Digital Biomanufacturing Market: Distribution by Type of Biologic Manufactured
- Table 29.67 Digital Biomanufacturing Market for Antibodies: Historical Trends (since 2022) and Forecasted Estimates, Conservative, Base and Optimistic Scenarios (till 2035) (USD Million)
- Table 29.68 Digital Biomanufacturing Market for Peptides: Historical Trends (since 2022) and Forecasted Estimates, Conservative, Base and Optimistic Scenarios (till 2035) (USD Million)
- Table 29.69 Digital Biomanufacturing Market for Cell and Gene Therapies: Historical Trends (since 2022) and Forecasted Estimates, Conservative, Base and Optimistic Scenarios (till 2035) (USD Million)
- Table 29.70 Digital Biomanufacturing Market for Other Biologics: Historical Trends (since 2022) and Forecasted Estimates, Conservative, Base and Optimistic Scenarios (till 2035) (USD Million)
- Table 29.71 Digital Biomanufacturing Market: Distribution by End Users
- Table 29.72 Digital Biomanufacturing Market for In-house Developers: Historical Trends (since 2022) and Forecasted Estimates, Conservative, Base and Optimistic Scenarios (till 2035) (USD Million)
- Table 29.73 Digital Biomanufacturing Market for Contract Manufacturers: Historical Trends (since 2022) and Forecasted Estimates, Conservative, Base and Optimistic Scenarios (till 2035) (USD Million)
- Table 29.74 Digital Biomanufacturing Market for Both End Users: Historical Trends (since 2022) and Forecasted Estimates, Conservative, Base and Optimistic Scenarios (till 2035) (USD Million)
- Table 29.75 Digital Biomanufacturing Market: Distribution by Geographical Regions
- Table 29.76 Digital Biomanufacturing Market in North America, Historical Trends (since 2022) and Forecasted Estimates, Conservative, Base and Optimistic Scenarios (till 2035) (USD Million)
- Table 29.77 Digital Biomanufacturing Market in the US, Historical Trends (since 2022) and Forecasted Estimates, Conservative, Base and Optimistic Scenarios (till 2035) (USD Million)
- Table 29.78 Digital Biomanufacturing Market in Canada, Historical Trends (since 2022) and Forecasted Estimates, Conservative, Base and Optimistic Scenarios (till 2035) (USD Million)
- Table 29.79 Digital Biomanufacturing Market in Europe, Historical Trends (since 2022) and Forecasted Estimates, Conservative, Base and Optimistic Scenarios (till 2035) (USD Million)
- Table 29.80 Digital Biomanufacturing Market in Germany Historical Trends (since 2022) and Forecasted Estimates, Conservative, Base and Optimistic Scenarios (till 2035) (USD Million)
- Table 29.81 Digital Biomanufacturing Market in France, Historical Trends (since 2022) and Forecasted Estimates, Conservative, Base and Optimistic Scenarios (till 2035) (USD Million)
- Table 29.82 Digital Biomanufacturing Market in Italy, Historical Trends (since 2022) and Forecasted Estimates, Conservative, Base and Optimistic Scenarios (till 2035) (USD Million)
- Table 29.83 Digital Biomanufacturing Market in Spain, Historical Trends (since 2022) and Forecasted Estimates, Conservative, Base and Optimistic Scenarios (till 2035) (USD Million)
- Table 29.84 Digital Biomanufacturing Market in the UK, Historical Trends (since 2022) and Forecasted Estimates, Conservative, Base and Optimistic Scenarios (till 2035) (USD Million)
- Table 29.85 Digital Biomanufacturing Market in Rest of Europe, Historical Trends (since 2022) and Forecasted Estimates, Conservative, Base and Optimistic Scenarios (till 2035) (USD Million)
- Table 29.86 Digital Biomanufacturing Market in Asia-Pacific, Historical Trends (since 2022) and Forecasted Estimates, Conservative, Base and Optimistic Scenarios (till 2035) (USD Million)
- Table 29.87 Digital Biomanufacturing Market in China, Historical Trends (since 2022) and Forecasted Estimates, Conservative, Base and Optimistic Scenarios (till 2035) (USD Million)
- Table 29.88 Digital Biomanufacturing Market in India, Historical Trends (since 2022) and Forecasted Estimates, Conservative, Base and Optimistic Scenarios (till 2035) (USD Million)
- Table 29.89 Digital Biomanufacturing Market in Rest of Asia-Pacific, Historical Trends (since 2022) and Forecasted Estimates, Conservative, Base and Optimistic Scenarios (till 2035) (USD Million)
- Table 29.90 Digital Biomanufacturing Market in Middle East and North Africa, Historical Trends (since 2022) and Forecasted Estimates, Conservative, Base and Optimistic Scenarios (till 2035) (USD Million)
- Table 29.91 Digital Biomanufacturing Market in Saudi Arabia, Historical Trends (since 2022) and Forecasted Estimates, Conservative, Base and Optimistic Scenarios (till 2035) (USD Million)
- Table 29.92 Digital Biomanufacturing Market in United Arab Emirates, Historical Trends (since 2022) and Forecasted Estimates, Conservative, Base and Optimistic Scenarios (till 2035) (USD Million)
- Table 29.93 Digital Biomanufacturing Market in Egypt, Historical Trends (since 2022) and Forecasted Estimates, Conservative, Base and Optimistic Scenarios (till 2035) (USD Million)
- Table 29.94 Digital Biomanufacturing Market in Latin America, Historical Trends (since 2022) and Forecasted Estimates, Conservative, Base and Optimistic Scenarios (till 2035) (USD Million)
- Table 29.95 Digital Biomanufacturing Market in Brazil, Historical Trends (since 2022) and Forecasted Estimates, Conservative, Base and Optimistic Scenarios (till 2035) (USD Million)
- Table 29.96 Digital Biomanufacturing Market in Mexico, Historical Trends (since 2022) and Forecasted Estimates, Conservative, Base and Optimistic Scenarios (till 2035) (USD Million)
- Table 29.97 Digital Biomanufacturing Market in Argentina, Historical Trends (since 2022) and Forecasted Estimates, Conservative, Base and Optimistic Scenarios (till 2035) (USD Million)
List of Figures
- Figure 2.1 Research Methodology: Project Methodology
- Figure 2.2 Research Methodology: Data Sources for Secondary Research
- Figure 2.3 Research Methodology: Robust Quality Control
- Figure 3.1 Market Dynamics: Forecast Methodology
- Figure 3.2 Market Dynamics: Key Market Segmentation
- Figure 4.1 Lessons Learnt from Past Recessions
- Figure 5.1 Executive Summary: Digital Biomanufacturing Landscape
- Figure 5.2 Executive Summary: Market Trends
- Figure 5.3 Executive Summary: Market Forecast and Opportunity Analysis
- Figure 6.1 Overview of Digital Biomanufacturing in Healthcare
- Figure 6.2 Software Capabilities of Digital Biomanufacturing Technologies
- Figure 6.3 Challenges Associated with the Adoption of Digital Biomanufacturing
- Figure 7.1 Digital Biomanufacturing Technologies: Distribution by Type of Technology
- Figure 7.2 Process Analytical Technologies: Distribution by Deployment Option
- Figure 7.3 Process Analytical Technologies: Distribution by Technology Capability
- Figure 7.4 Process Analytical Technology Providers: Distribution by Year of Establishment
- Figure 7.5 Process Analytical Technology Providers: Distribution by Company Size
- Figure 7.6 Process Analytical Technology Providers: Distribution by Location of Headquarters (Region)
- Figure 7.7 Process Analytical Technology Providers: Distribution by Location of Headquarters (Country)
- Figure 7.8 Process Analytical Technology Providers: Distribution by Number of Technologies Offered
- Figure 7.9 Process Analytical Technology Providers: Distribution by End Users
- Figure 7.10 Process Analytical Technology Providers: Distribution by Year of Establishment, Location of Headquarters and Technology Capability
- Figure 7.11 Process Analytical Technologies offered by Small Companies: Distribution by Years of Experience, Location of Headquarters and Number of Technology Capabilities
- Figure 7.12 Process Analytical Technologies offered by Mid-sized Companies: Distribution by Years of Experience, Location of Headquarters and Number of Technology Capabilities
- Figure 7.13 Process Analytical Technologies offered by Large Companies: Distribution by Years of Experience, Location of Headquarters and Number of Technology Capabilities
- Figure 7.14 Process Analytical Technologies offered by Very Large Companies: Distribution by Years of Experience, Location of Headquarters and Number of Technology Capabilities
- Figure 8.1 Data Analytics Software Providers: Distribution by Deployment Option
- Figure 8.2 Data Analytics Software: Distribution by Software Capability
- Figure 8.3 Data Analytics Software Providers: Distribution by Year of Establishment
- Figure 8.4 Data Analytics Software Providers: Distribution by Company Size
- Figure 8.5 Data Analytics Software Providers: Distribution by Location of Headquarters (Region)
- Figure 8.6 Data Analytics Software Providers: Distribution by Location of Headquarters (Country)
- Figure 8.7 Data Analytics Software Providers: Distribution by Number of Software Offered
- Figure 8.8 Data Analytics Software Providers: Distribution by End Users
- Figure 8.9 Data Analytics Software Providers: Distribution by Year of Establishment, Location of Headquarters and Software Capability
- Figure 8.10 Data Analytics Software Providers: Distribution by Years of Experience, Location of Headquarters and Number of Software Capabilities
- Figure 9.1 Manufacturing Execution Systems: Distribution by Deployment Option
- Figure 9.2 Manufacturing Execution Systems: Distribution by Technology Capability
- Figure 9.3 Manufacturing Execution Systems: Distribution by Integrated Software
- Figure 9.4 Manufacturing Execution Systems: Distribution by Regulatory Compliance
- Figure 9.5 Manufacturing Execution System Providers: Distribution by Year of Establishment
- Figure 9.6 Manufacturing Execution System Providers: Distribution by Company Size
- Figure 9.7 Manufacturing Execution System Providers: Distribution by Location of Headquarters (Region)
- Figure 9.8 Manufacturing Execution System Providers: Distribution by Location of Headquarters (Country)
- Figure 9.9 Manufacturing Execution System Providers: Distribution by Type of Service Offered
- Figure 9.10 Manufacturing Execution Systems Offered by Small and Mid-sized Companies: Distribution by Years of Experience, Location of Headquarters and Number of Technology Capabilities
- Figure 9.11 Manufacturing Execution Systems Offered by Large and Very Large Companies: Distribution by Years of Experience, Location of Headquarters and Number of Technology Capabilities
- Figure 10.1 Digital Twins: Distribution by Technology Capability
- Figure 10.2 Digital Twins: Distribution by Type of Twin
- Figure 10.3 Digital Twins: Distribution by Integrated Technology
- Figure 10.4 Digital Twins Providers: Distribution by Year of Establishment
- Figure 10.5 Digital Twins Providers: Distribution by Company Size
- Figure 10.6 Digital Twins Providers: Distribution by Location of Headquarters (Region)
- Figure 10.7 Digital Twins Providers: Distribution by Location of Headquarters (Country)
- Figure 10.8 Digital Twins Providers: Distribution by Number of Technologies Offered
- Figure 10.9 Digital Twins Providers: Distribution by End Users
- Figure 10.10 Digital Twins Providers: Distribution by Years of Experience, Location of Headquarters and Technology Capabilities
- Figure 11.1 Competitive Analysis: Process Analytical Technologies for Digital Biomanufacturing
- Figure 11.2 Competitive Analysis: Data Analytical Software for Digital Biomanufacturing
- Figure 11.3 Competitive Analysis: Manufacturing Execution Systems for Digital Biomanufacturing
- Figure 11.4 Competitive Analysis: Digital Twins for Digital Biomanufacturing
- Figure 12.1 Regional Capability Analysis: Distribution by Location of Headquarters and Company Size
- Figure 12.2 Regional Capability of Small Players based in North America (Peer Group I)
- Figure 12.3 Regional Capability of Mid-sized Players based in North America (Peer Group II)
- Figure 12.4 Regional Capability of Large and Very Large Players based in North America (Peer Group III)
- Figure 12.5 Regional Capability of Small Players based in Europe (Peer Group IV)
- Figure 12.6 Regional Capability of Mid-sized Players based in Europe (Peer Group V)
- Figure 12.7 Regional Capability of Large and Very Large Players based in Europe (Peer Group VI)
- Figure 12.8 Regional Capability of Small Players based in Asia-Pacific (Peer Group VII)
- Figure 12.9 Regional Capability of Mid-sized Players based in Asia-Pacific (Peer Group VIII)
- Figure 12.10 White Space Analysis: Distribution by Peer Groups and Type of Technology
- Figure 13.1 AspenTech: Annual Revenues, FY 2021 onwards (USD Million)
- Figure 13.2 FUJIFILM Diosynth Biotechnologies: Business Segment-wise Revenues, FY 2021 onwards (Billion Yen)
- Figure 13.3 Merck: Business Segment-wise Revenues, FY 2021 onwards (EUR Billion)
- Figure 13.4 Thermo Fisher Scientific: Business Segment-wise Revenues, FY 2021 onwards (USD Billion)
- Figure 14.1 Sartorius: Business Segment-wise Revenues, FY 2022 onwards (EUR Billion)
- Figure 14.2 Eppendorf: Business Segment-wise Revenues, FY 2021 onwards (EUR Million)
- Figure 15.1 Dassault Systemes: Annual Revenues, FY 2021 onwards (EUR Million)
- Figure 17.1 Partnerships and Collaborations: Distribution by Year of Partnership, Since 2018
- Figure 17.2 Partnerships and Collaborations: Distribution by Type of Partnership
- Figure 17.3 Partnerships and Collaborations: Distribution by Year and Type of Partnership, Since 2018
- Figure 17.4 Partnerships and Collaborations: Distribution by Type of Technology
- Figure 17.5 Partnerships and Collaborations: Distribution by Year of Partnership and Type of Technology, Since 2018
- Figure 17.6 Partnerships and Collaborations: Distribution by Type of Partner
- Figure 17.7 Most Active Players: Distribution by Number of Partnerships
- Figure 17.8 Partnerships and Collaborations: Intracontinental and Intercontinental Agreements
- Figure 17.9 Partnerships and Collaborations: International and Local Agreements
- Figure 18.1 Market Concentration Analysis: Comparison of Key Offerings of Digital Biomanufacturing Providers
- Figure 19.1 Digital Biomanufacturing: Historical Timeline of Key Events
- Figure 19.2 Digital Biomanufacturing: Start-up Activity
- Figure 19.3 Digital Biomanufacturing: Established Players Activity
- Figure 19.4 Digital Biomanufacturing: Partnership and Collaborations-related Trends
- Figure 19.5 Digital Biomanufacturing: Funding and Investment-related Trends
- Figure 19.6 Digital Biomanufacturing: Future Outlook
- Figure 19.7 Industry Lifecycle Analysis for Digital Biomanufacturing
- Figure 20.1 Global Digital Biomanufacturing Market, Historical Trends (since 2022) and Forecasted Estimates (till 2035) (USD Billion)
- Figure 20.2 Global Digital Biomanufacturing Market, Forecasted Estimates (till 2035): Conservative Scenario (USD Billion)
- Figure 20.3 Global Digital Biomanufacturing Market, Forecasted Estimates (till 2035): Optimistic Scenario (USD Billion)
- Figure 21.1 Digital Biomanufacturing Market: Distribution by Type of Technology
- Figure 21.2 Digital Biomanufacturing Market for MES: Historical Trends (since 2022) and Forecasted Estimates (till 2035) (USD Million)
- Figure 21.3 Digital Biomanufacturing Market for PAT: Historical Trends (since 2022) and Forecasted Estimates (till 2035) (USD Million)
- Figure 21.4 Digital Biomanufacturing Market for DAS: Historical Trends (since 2022) and Forecasted Estimates (till 2035) (USD Million)
- Figure 21.5 Digital Biomanufacturing Market for Digital Twins: Historical Trends (since 2022) and Forecasted Estimates (till 2035) (USD Million)
- Figure 22.1 Digital Biomanufacturing Market: Distribution by Deployment Option
- Figure 22.2 Digital Biomanufacturing Market for On-premises Deployment: Historical Trends (since 2022) and Forecasted Estimates (till 2035) (USD Million)
- Figure 22.3 Digital Biomanufacturing Market for Cloud-based Deployment: Historical Trends (since 2022) and Forecasted Estimates (till 2035) (USD Million)
- Figure 23.1 Digital biomanufacturing market: Distribution by Scale of Operation
- Figure 23.2 Digital Biomanufacturing Market for Commercial Scale: Historical Trends (since 2022) and Forecasted Estimates (till 2035) (USD Million)
- Figure 23.3 Digital Biomanufacturing Market for Clinical Scale: Historical Trends (since 2022) and Forecasted Estimates (till 2035) (USD Million)
- Figure 24.1 Digital Biomanufacturing Market: Distribution by Type of Biologic Manufactured
- Figure 24.2 Digital Biomanufacturing Market for Antibodies: Historical Trends (since 2022) and Forecasted Estimates (till 2035) (USD Million)
- Figure 24.3 Digital Biomanufacturing Market for Peptides: Historical Trends (since 2022) and Forecasted Estimates (till 2035) (USD Million)
- Figure 24.4 Digital Biomanufacturing Market for Cell and Gene Therapies: Historical Trends (since 2022) and Forecasted Estimates (till 2035) (USD Million)
- Figure 24.5 Digital Biomanufacturing Market for Other Biologics: Historical Trends (since 2022) and Forecasted Estimates (till 2035) (USD Million)
- Figure 25.1 Digital Biomanufacturing Market: Distribution by End Users
- Figure 25.2 Digital Biomanufacturing Market for In-house Developers: Historical Trends (since 2022) and Forecasted Estimates (till 2035) (USD Million)
- Figure 25.3 Digital Biomanufacturing Market for Contract Manufacturers: Historical Trends (since 2022) and Forecasted Estimates (till 2035) (USD Million)
- Figure 25.4 Digital Biomanufacturing Market for Both End Users: Historical Trends (since 2022) and Forecasted Estimates (till 2035) (USD Million)
- Figure 26.1 Digital Biomanufacturing Market: Distribution by Geographical Regions
- Figure 26.2 Digital Biomanufacturing Market in North America, Historical Trends (since 2022) and Forecasted Estimates (till 2035) (USD Million)
- Figure 26.3 Digital Biomanufacturing Market in the US, Historical Trends (since 2022) and Forecasted Estimates (till 2035) (USD Million)
- Figure 26.4 Digital Biomanufacturing Market in Canada, Historical Trends (since 2022) and Forecasted Estimates (till 2035) (USD Million)
- Figure 26.5 Digital Biomanufacturing Market in Europe, Historical Trends (since 2022) and Forecasted Estimates (till 2035) (USD Million)
- Figure 26.6 Digital Biomanufacturing Market in Germany Historical Trends (since 2022) and Forecasted Estimates (till 2035) (USD Million)
- Figure 26.7 Digital Biomanufacturing Market in France, Historical Trends (since 2022) and Forecasted Estimates (till 2035) (USD Million)
- Figure 26.8 Digital Biomanufacturing Market in Italy, Historical Trends (since 2022) and Forecasted Estimates (till 2035) (USD Million)
- Figure 26.9 Digital Biomanufacturing Market in Spain, Historical Trends (since 2022) and Forecasted Estimates (till 2035) (USD Million)
- Figure 26.10 Digital Biomanufacturing Market in the UK, Historical Trends (since 2022) and Forecasted Estimates (till 2035) (USD Million)
- Figure 26.11 Digital Biomanufacturing Market in Rest of Europe, Historical Trends (since 2022) and Forecasted Estimates (till 2035) (USD Million)
- Figure 26.12 Digital Biomanufacturing Market in Asia-Pacific, Historical Trends (since 2022) and Forecasted Estimates (till 2035) (USD Million)
- Figure 26.13 Digital Biomanufacturing Market in China, Historical Trends (since 2022) and Forecasted Estimates (till 2035) (USD Million)
- Figure 26.14 Digital Biomanufacturing Market in India, Historical Trends (since 2022) and Forecasted Estimates (till 2035) (USD Million)
- Figure 26.15 Digital Biomanufacturing Market in Rest of Asia-Pacific, Historical Trends (since 2022) and Forecasted Estimates (till 2035) (USD Million)
- Figure 26.16 Digital Biomanufacturing Market in Middle East and North Africa, Historical Trends (since 2022) and Forecasted Estimates (till 2035) (USD Million)
- Figure 26.17 Digital Biomanufacturing Market in Saudi Arabia, Historical Trends (since 2022) and Forecasted Estimates (till 2035) (USD Million)
- Figure 26.18 Digital Biomanufacturing Market in United Arab Emirates, Historical Trends (since 2022) and Forecasted Estimates (till 2035) (USD Million)
- Figure 26.19 Digital Biomanufacturing Market in Egypt, Historical Trends (since 2022) and Forecasted Estimates (till 2035) (USD Million)
- Figure 26.20 Digital Biomanufacturing Market in Latin America, Historical Trends (since 2022) and Forecasted Estimates (till 2035) (USD Million)
- Figure 26.21 Digital Biomanufacturing Market in Brazil, Historical Trends (since 2022) and Forecasted Estimates (till 2035) (USD Million)
- Figure 26.22 Digital Biomanufacturing Market in Mexico, Historical Trends (since 2022) and Forecasted Estimates (till 2035) (USD Million)
- Figure 26.23 Digital Biomanufacturing Market in Argentina, Historical Trends (since 2022) and Forecasted Estimates (till 2035) (USD Million)
- Figure 26.24 Penetration Growth (P-G) Matrix: Geographical Regions
- Figure 26.25 Market Movement Analysis: Geographical Regions
- Figure 27.1 Concluding Remarks: Digital Biomanufacturing Landscape
- Figure 27.2 Concluding Remarks: Partnerships and Collaborations
- Figure 27.3 Concluding Remarks: Market Forecast and Opportunity Analysis

