
PUBLISHER: Global Market Insights Inc. | PRODUCT CODE: 2045757

PUBLISHER: Global Market Insights Inc. | PRODUCT CODE: 2045757
Recreational Vehicle Market Opportunity, Growth Drivers, Industry Trend Analysis, and Forecast 2026 - 2035
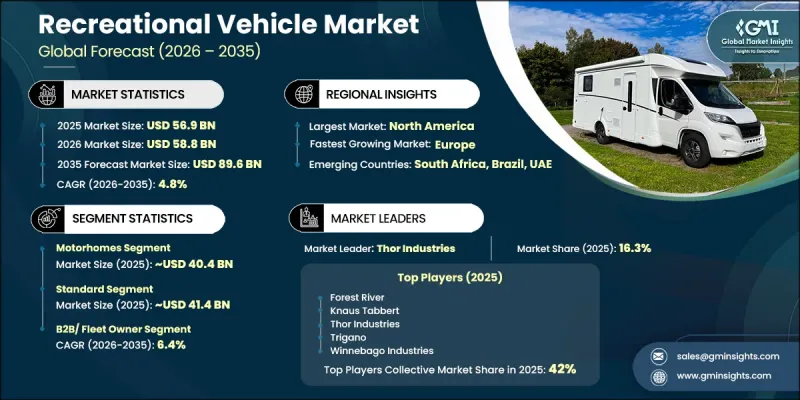
The Global Recreational Vehicle Market was valued at USD 56.9 billion in 2025 and is estimated to grow at a CAGR of 4.8% to reach USD 89.6 billion by 2035.
The market is witnessing stable growth supported by changing travel preferences, rising participation in outdoor recreation, and ongoing product innovation across the industry. Increasing consumer interest in flexible travel experiences and mobile living solutions continues to drive demand for recreational vehicles worldwide. Manufacturers are introducing compact yet feature-rich models equipped with advanced power management systems, solar integration, lithium battery technologies, and enhanced connectivity features, which are contributing to higher average selling prices. Demographic shifts are also playing a major role in market expansion as younger consumers increasingly prefer shorter and more frequent travel experiences, while older consumers continue to support demand for luxury recreational vehicles and premium models. Rental and peer-to-peer vehicle sharing platforms are further broadening customer accessibility by encouraging first-time users to transition toward ownership. In addition, advancements in electrification technologies are gradually influencing the industry as manufacturers explore electric recreational vehicle options supported by evolving charging infrastructure and battery technology improvements.
| Market Scope | |
|---|---|
| Start Year | 2025 |
| Forecast Year | 2026-2035 |
| Start Value | $56.9 Billion |
| Forecast Value | $89.6 Billion |
| CAGR | 4.8% |
The recreational vehicle industry is continuing to evolve through stronger integration of digital technologies, improved vehicle efficiency, and enhanced travel comfort features. Consumer demand for personalized travel experiences and automotive-grade convenience is encouraging manufacturers to focus on innovation across vehicle design, drivability, and onboard connectivity systems. Features such as intelligent energy management, integrated navigation systems, enhanced safety technologies, and improved interior functionality are becoming increasingly important purchasing factors across multiple customer groups. At the same time, financing accessibility and expanding dealership networks are making recreational vehicles more attainable for a wider customer base. Growing interest in outdoor tourism, remote travel flexibility, and mobile lifestyles is further supporting long-term market growth across developed and emerging regions.
The motorhomes segment held a 70.9% share, generating USD 40.4 billion in 2025. Demand for motorhomes continues to rise due to the availability of multiple vehicle formats designed to meet the preferences of different consumer groups. Luxury-oriented buyers continue to support demand for high-end motorhomes, while compact and mid-sized models are gaining popularity among younger travelers and families seeking convenience and flexibility. Advanced safety systems, driver-assistance technologies, and enhanced connectivity solutions are increasingly being integrated into mid-range and premium motorhomes, improving overall driving experience and consumer appeal.
The standard applications segment generated USD 41.5 billion in 2025 and is anticipated to grow at a CAGR of 4.3% from 2026 to 2035. Standard recreational vehicles remain popular due to their practical functionality, accessible pricing structure, and dependable performance for seasonal travel use. These models offer essential amenities and durable construction while maintaining affordability for a broad consumer base. Strong dealership networks, flexible financing options, and diverse product availability continue to support demand for standard recreational vehicles across global markets.
U.S. Recreational Vehicle Market reached USD 25.7 billion in 2025 and is projected to grow at a CAGR of 4.7% through 2035. The country remains one of the largest and most mature recreational vehicle markets globally due to its strong outdoor recreation culture, extensive road transportation network, and broad availability of camping facilities. Increasing consumer interest in road travel, outdoor tourism, and flexible accommodation options continues to support demand across the United States. Younger consumers are also entering the market in greater numbers, encouraged by rental accessibility, remote work flexibility, and growing interest in mobile travel lifestyles.
Major companies operating in the Global Recreational Vehicle Market include Adria Mobil, Forest River, Hobby Caravan, Hymer, Knaus Tabbert, REV Group, Swift Leisure, Thor Industries, Trigano, and Winnebago Industries. Companies operating in the recreational vehicle market are focusing on product innovation, strategic partnerships, and digital transformation initiatives to strengthen their market position and expand customer reach. Leading manufacturers are investing in lightweight materials, advanced power management systems, lithium battery integration, and smart connectivity features to improve vehicle performance and enhance customer experience. Many companies are also expanding compact and luxury model portfolios to address changing consumer preferences across multiple demographic groups. Strategic collaborations with rental platforms and dealership networks are helping businesses increase brand visibility and convert first-time renters into long-term owners. In addition, manufacturers are prioritizing sustainability initiatives by exploring electric recreational vehicle technologies, energy-efficient systems, and eco-friendly manufacturing processes. Enhanced financing solutions, aftermarket services, and customization options are also supporting stronger customer retention and long-term market growth.
Table of Contents
Chapter 1 Methodology
- 1.1 Research approach
- 1.2 Quality Commitments
- 1.2.1 GMI AI policy & data integrity commitment
- 1.3 Research Trail & Confidence Scoring
- 1.3.1 Research Trail Components
- 1.3.2 Scoring Components
- 1.4 Data Collection
- 1.5 Data mining sources
- 1.5.1 Paid sources
- 1.6 Base estimates and calculations
- 1.6.1 Base year calculation
- 1.7 Forecast model
- 1.7.1 Quantified market impact analysis
- 1.8 Research transparency addendum
- 1.8.1 Source attribution framework
- 1.8.2 Quality assurance metrics
- 1.8.3 Our commitment to trust
Chapter 2 Executive Summary
- 2.1 Industry 360° synopsis
- 2.2 Key market trends
- 2.2.1 Regional
- 2.2.2 Vehicle
- 2.2.3 Price Point
- 2.2.4 Application
- 2.3 TAM analysis, 2026-2035
- 2.4 CXO perspectives: Strategic imperatives
Chapter 3 Industry Insights
- 3.1 Industry ecosystem analysis
- 3.1.1 Supplier landscape
- 3.1.2 Profit margin
- 3.1.3 Cost structure
- 3.1.4 Value addition at each stage
- 3.1.5 Factor affecting the value chain
- 3.1.6 Disruptions
- 3.2 Industry impact forces
- 3.2.1 Growth drivers
- 3.2.1.1 Rising Preference for Experiential Travel & Adventure Tourism
- 3.2.1.2 Growing Millennial & Gen Z Interest in Outdoor Recreation
- 3.2.1.3 Remote Work Normalization Enabling Extended RV Travel
- 3.2.1.4 Increasing Disposable Income in Emerging Markets
- 3.2.2 Industry pitfalls and challenges
- 3.2.2.1 Seasonal Demand Fluctuation & Low Utilization Rates
- 3.2.2.2 Limited Campground Infrastructure & Parking Facilities
- 3.2.3 Market opportunities
- 3.2.3.1 Electric & Hybrid RV Development for Sustainable Travel
- 3.2.3.2 Rental & Sharing Economy Platform Expansion
- 3.2.3.3 Expansion into Underpenetrated Asia-Pacific Markets
- 3.2.1 Growth drivers
- 3.3 Technology and innovation landscape
- 3.3.1 Current technological trends
- 3.3.1.1 GPS Navigation and Telematics Systems
- 3.3.1.2 Solar Power Integration Systems
- 3.3.2 Emerging technologies
- 3.3.2.1 Vehicle-to-Grid (V2G) Charging Systems
- 3.3.2.2 Hydrogen Fuel Cell Propulsion Systems
- 3.3.1 Current technological trends
- 3.4 Growth potential analysis
- 3.5 Pricing Analysis (Driven by Primary Research)
- 3.5.1 Historical Price Trend Analysis
- 3.5.2 Pricing Strategy by Player Type (Premium / Value / Cost-plus)
- 3.6 Regulatory landscape
- 3.6.1 North America
- 3.6.1.1 US - U.S. Clean Air Act (CAA)
- 3.6.1.2 US - Federal Motor Vehicle Safety Standards (FMVSS)
- 3.6.1.3 Canada - Motor Vehicle Safety Act (MVSA)
- 3.6.2 Europe
- 3.6.2.1 EU - Euro VI Vehicle Emission Standards
- 3.6.2.2 EU - General Safety Regulation (GSR) 2019/2144
- 3.6.3 Asia Pacific
- 3.6.3.1 China - China VI Emission Standards
- 3.6.3.2 India - Bharat Stage VI (BS-VI) Emission Norms
- 3.6.4 LATAM
- 3.6.4.1 Brazil - PROCONVE Vehicle Emission Control Program
- 3.6.4.2 Chile - Vehicle Emission Standard DS No. 211
- 3.6.5 MEA
- 3.6.5.1 UAE - UAE Vehicle Safety Regulations
- 3.6.5.2 Saudi Arabia - SASO Fuel Economy Standards
- 3.6.1 North America
- 3.7 Porter's analysis
- 3.8 PESTEL analysis
- 3.9 Trade Data Analysis (Driven by Paid Database)
- 3.9.1 Import/Export Volume & Value Trends
- 3.9.2 Key Trade Corridors & Tariff Impact
- 3.10 Capacity & Production Landscape (Driven by Primary Research)
- 3.10.1 Installed Capacity by Region & Key Producer
- 3.10.2 Capacity Utilization Rates & Expansion Pipelines
- 3.11 Cost breakdown analysis
- 3.11.1 Raw materials & components costs
- 3.11.2 Manufacturing and assembly costs
- 3.11.3 Powertrain and energy system costs
- 3.11.4 Interior and comfort feature costs
- 3.11.5 Distribution and logistics costs
- 3.12 Patent analysis (Driven by Primary Research)
- 3.13 Sustainability and environmental aspects
- 3.13.1 Sustainable Practices
- 3.13.2 Waste Reduction Strategies
- 3.13.3 Energy Efficiency in Production
- 3.13.4 Eco-friendly Initiatives
- 3.13.5 Carbon Footprint Considerations
- 3.14 Impact of AI & generative AI on the market
- 3.14.1 AI-driven disruption of existing business models
- 3.14.2 GenAI use cases & adoption roadmap by segment
- 3.14.3 Risks, limitations & regulatory considerations
- 3.15 Ownership vs rental economy shift
- 3.15.1 Rental market penetration by vehicle type & geography
- 3.15.2 Peer-to-peer rental platform disruption
- 3.15.3 Traditional ownership model erosion dynamics
- 3.16 Forecast assumptions & scenario analysis (Driven by Primary Research)
- 3.16.1 Base Case- Key Macro & Industry Variables Driving CAGR
- 3.16.2 Optimistic Scenarios- Favorable macro and industry tailwinds
- 3.16.3 Pessimistic Scenario - Macroeconomic slowdown or industry headwinds
Chapter 4 Competitive Landscape, 2025
- 4.1 Introduction
- 4.2 Company market share analysis
- 4.2.1 North America
- 4.2.2 Europe
- 4.2.3 Asia Pacific
- 4.2.4 LATAM
- 4.2.5 MEA
- 4.3 Competitive analysis of major market players
- 4.4 Competitive positioning matrix
- 4.5 Key developments
- 4.5.1 Mergers & acquisitions
- 4.5.2 Partnerships & collaborations
- 4.5.3 New product launches
- 4.5.4 Expansion plans and funding
- 4.6 Company tier benchmarking
- 4.6.1 Tier classification criteria & qualifying thresholds
- 4.6.2 Tier positioning matrix by revenue, geography & innovation
Chapter 5 Market Estimates and Forecast, By Vehicle, 2022 - 2035 ($ Mn, Units)
- 5.1 Key trends
- 5.2 Motorhomes
- 5.2.1 Class
- 5.2.1.1 Class A
- 5.2.1.2 Class B
- 5.2.1.3 Class C
- 5.2.2 Fuel
- 5.2.2.1 Gasoline
- 5.2.2.2 Diesel
- 5.2.2.3 Battery-Electric
- 5.2.2.4 Hybrid
- 5.2.1 Class
- 5.3 Towable RVs
- 5.3.1 Folding/Camping Trailers
- 5.3.2 Truck Campers
- 5.3.3 Fifth Wheeler
- 5.3.4 Travel Trailers
Chapter 6 Market Estimates and Forecast, By Price Point, 2022 - 2035 ($ Mn, Units)
- 6.1 Key trends
- 6.2 Standard
- 6.3 Luxury
Chapter 7 Market Estimates and Forecast, By Application, 2022 - 2035 ($ Mn, Units)
- 7.1 Key trends
- 7.2 B2C/individual
- 7.3 B2B/ Fleet owner
Chapter 8 Market Estimates & Forecast, By Region, 2022 - 2035 ($Mn, Units)
- 8.1 Key trends
- 8.2 North America
- 8.2.1 US
- 8.2.2 Canada
- 8.3 Europe
- 8.3.1 Germany
- 8.3.2 UK
- 8.3.3 France
- 8.3.4 Italy
- 8.3.5 Spain
- 8.3.6 Netherlands
- 8.3.7 Sweden
- 8.3.8 Norway
- 8.3.9 Switzerland
- 8.4 Asia Pacific
- 8.4.1 China
- 8.4.2 Japan
- 8.4.3 South Korea
- 8.4.4 India
- 8.4.5 Thailand
- 8.4.6 Indonesia
- 8.4.7 Malaysia
- 8.5 Latin America
- 8.5.1 Brazil
- 8.5.2 Mexico
- 8.5.3 Argentina
- 8.5.4 Chile
- 8.6 MEA
- 8.6.1 South Africa
- 8.6.2 Saudi Arabia
- 8.6.3 UAE
Chapter 9 Company Profiles
- 9.1 Global players
- 9.1.1 Thor Industries
- 9.1.2 Forest River
- 9.1.3 Winnebago Industries
- 9.1.4 REV Group
- 9.1.5 Trigano
- 9.1.6 Knaus Tabbert
- 9.1.7 Hymer
- 9.1.8 Wildax Motorhomes
- 9.1.9 Dethleffs
- 9.1.10 Burstner
- 9.1.11 Hobby Caravan
- 9.1.12 Groupe Pilote
- 9.2 Regional players
- 9.2.1 Triple E RV
- 9.2.2 Adria Mobil
- 9.2.3 Swift Leisure
- 9.2.4 Fendt Caravan
- 9.2.5 Bailey of Bristol
- 9.2.6 Zone RV
- 9.2.7 Giottiline
- 9.3 Emerging players
- 9.3.1 Sportsmobile
- 9.3.2 Kimberley Kampers
- 9.3.3 Tonke Campers

