
PUBLISHER: Global Market Insights Inc. | PRODUCT CODE: 1959563

PUBLISHER: Global Market Insights Inc. | PRODUCT CODE: 1959563
Pet Wearables Market Opportunity, Growth Drivers, Industry Trend Analysis, and Forecast 2026 - 2035
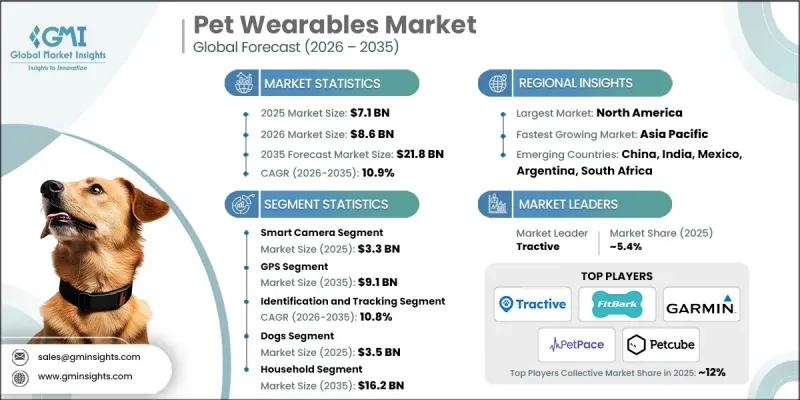
The Global Pet Wearables Market was valued at USD 7.1 billion in 2025 and is estimated to grow at a CAGR of 10.9% to reach USD 21.8 billion by 2035.
The market growth is driven by the rapid rise in the global pet population, increasing household incomes, higher spending on pet health and wellness, and the availability of advanced technology-enabled products for pets. With more than one billion pets worldwide, households across regions, including the U.S., Europe, Brazil, and China account for nearly half a billion dogs and cats, reflecting strong potential for wearables adoption. The ongoing trend of pet humanization is also driving growth, as owners increasingly treat pets as integral family members, boosting per-household expenditure on connected pet devices. Pet wearables encompass GPS collars, health monitoring sensors, RF-based locating tags, and activity trackers, which leverage technologies such as GPS, Bluetooth, RFID, and smart sensors to provide real-time insights into location, activity, and biometric health parameters. These devices support geofencing, remote monitoring, behavior tracking, and early detection of health issues, demonstrating a clear shift toward more connected, intelligent pet care solutions.
| Market Scope | |
|---|---|
| Start Year | 2025 |
| Forecast Year | 2026-2035 |
| Start Value | $7.1 Billion |
| Forecast Value | $21.8 Billion |
| CAGR | 10.9% |
The smart camera segment reached USD 3.3 billion in 2025. Adoption is rising due to the demand for remote monitoring and real-time interaction, enabling owners to engage with pets even while away. Advanced sensors, IoT connectivity, video streaming, and Wi-Fi compatibility allow detailed monitoring of pet activity, safety, and behavior. The segment benefits from expanding use cases in home security and pet supervision, as owners increasingly seek technology that ensures their pets' well-being in unsupervised environments.
The dogs segment generated USD 3.5 billion in 2025. Dogs represent the largest share due to their higher mobility, frequent outdoor activity, and need for tracking, safety, and health monitoring. GPS-enabled collars, activity trackers, and health monitoring wearables are increasingly essential for ensuring the safety and fitness of dogs, particularly for active or working breeds. The rising global dog population directly correlates with the demand for dog-specific wearable devices, driving segmental growth across regions.
North America Pet Wearables Market was valued at USD 3.9 billion in 2025 and is projected to reach USD 11.7 billion by 2035, growing at a CAGR of 10.6%. The region benefits from high pet ownership, high disposable income, and access to advanced wearable products. Pet owners in North America are highly aware of smart pet solutions, which drives adoption, alongside the availability of multiple device options and a robust retail ecosystem. The presence of leading market players also strengthens regional growth, ensuring continuous innovation and product availability.
Key players in the Global Pet Wearables Market include Buddy (Ninja Management), Dogtra, Fi Smart Dog Collar, Fitbark, Garmin, Halo Collar, KYON, Loc8tor, Link My Pet, Petcube, Petpace, PitPat, SportDOG, Tractive, and Wagz. Companies operating in the pet wearables market are deploying several strategies to strengthen their market position and increase their global presence. These include investing heavily in research and development to enhance device accuracy, battery life, and sensor capabilities. Firms are also expanding their product portfolios with multifunctional devices that combine health tracking, GPS, and activity monitoring. Strategic collaborations with veterinary networks, pet care service providers, and technology integrators help secure brand trust and improve market penetration. Geographic expansion into emerging regions and targeted marketing campaigns enhance adoption rates, while subscription-based models for health monitoring and activity data generate recurring revenue streams.
Table of Contents
Chapter 1 Methodology and Scope
- 1.1 Market scope and definition
- 1.2 Research approach
- 1.3 Quality commitments
- 1.3.1 GMI AI policy and data integrity commitment
- 1.3.1.1 Source consistency protocol
- 1.3.1 GMI AI policy and data integrity commitment
- 1.4 Research trail and confidence scoring
- 1.4.1 Research trail components
- 1.4.2 Scoring components
- 1.5 Data collection
- 1.5.1 Partial list of primary sources
- 1.6 Data mining sources
- 1.6.1 Paid sources
- 1.6.1.1 Sources, by region
- 1.6.1 Paid sources
- 1.7 Base estimates and calculations
- 1.7.1 Revenue share analysis
- 1.7.2 Base year calculation
- 1.8 Forecast model
- 1.9 Research transparency addendum
- 1.9.1 Source attribution framework
- 1.9.2 Quality assurance metrics
- 1.9.3 Our commitment to trust
Chapter 2 Executive Summary
- 2.1 Industry 360° synopsis
- 2.2 Key market trends
- 2.2.1 Regional trends
- 2.2.2 Product trends
- 2.2.3 Technology trends
- 2.2.4 Application trends
- 2.2.5 Animal type trends
- 2.2.6 End use trends
- 2.3 CXO perspectives: Strategic imperatives
- 2.3.1 Key decision points for industry executives
- 2.3.2 Critical success factors for market players
- 2.4 Future outlook and strategic recommendations
Chapter 3 Industry Insights
- 3.1 Industry ecosystem analysis
- 3.2 Industry impact forces
- 3.2.1 Growth drivers
- 3.2.1.1 Increased pet ownership and humanization of pets
- 3.2.1.2 Growing awareness of pet health and wellness
- 3.2.1.3 Technological advancements in IoT- and AI-powered devices
- 3.2.1.4 Supportive digital and regulatory environment
- 3.2.2 Industry pitfalls and challenges
- 3.2.2.1 Technical limitations and performance gaps
- 3.2.2.2 Premium pricing of advanced wearables
- 3.2.3 Market opportunities
- 3.2.3.1 AI-driven pet behavior and training solutions
- 3.2.3.2 Growth of connected veterinary ecosystems
- 3.2.1 Growth drivers
- 3.3 Growth potential analysis
- 3.4 Regulatory landscape
- 3.4.1 North America
- 3.4.2 Europe
- 3.4.3 Asia Pacific
- 3.5 Technology and innovation landscape
- 3.5.1 Current technologies
- 3.5.2 Emerging technologies
- 3.6 Porter's analysis
- 3.7 PESTEL analysis
Chapter 4 Competitive Landscape, 2025
- 4.1 Introduction
- 4.2 Company market share analysis
- 4.3 Company matrix analysis
- 4.4 Competitive analysis of major market players
- 4.5 Competitive positioning matrix
- 4.6 Key developments
- 4.6.1 Merger and acquisition
- 4.6.2 Partnership and collaboration
- 4.6.3 New product launches
- 4.6.4 Expansion plans
Chapter 5 Market Estimates and Forecast, By Product, 2022 - 2035 ($ Mn and Units)
- 5.1 Key trends
- 5.2 Smart collar
- 5.3 Smart vest
- 5.4 Smart harness
- 5.5 Smart camera
- 5.6 Other products
Chapter 6 Market Estimates and Forecast, By Technology, 2022 - 2035 ($ Mn)
- 6.1 Key trends
- 6.2 RFID devices
- 6.3 GPS
- 6.4 Sensors
- 6.5 Bluetooth
Chapter 7 Market Estimates and Forecast, By Application, 2022 - 2035 ($ Mn)
- 7.1 Key trends
- 7.2 Medical diagnosis and treatment
- 7.3 Identification and tracking
- 7.4 Fitness monitoring
- 7.5 Behavior monitoring and control
Chapter 8 Market Estimates and Forecast, By Animal Type, 2022 - 2035 ($ Mn)
- 8.1 Key trends
- 8.2 Dogs
- 8.3 Cats
- 8.4 Other animals
Chapter 9 Market Estimates and Forecast, By End Use, 2022 - 2035 ($ Mn)
- 9.1 Key trends
- 9.2 Household
- 9.3 Commercial
Chapter 10 Market Estimates and Forecast, By Region, 2022 - 2035 ($ Mn and Units)
- 10.1 Key trends
- 10.2 North America
- 10.2.1 U.S.
- 10.2.2 Canada
- 10.3 Europe
- 10.3.1 Germany
- 10.3.2 UK
- 10.3.3 France
- 10.3.4 Spain
- 10.3.5 Italy
- 10.3.6 Netherlands
- 10.4 Asia Pacific
- 10.4.1 China
- 10.4.2 Japan
- 10.4.3 India
- 10.4.4 Australia
- 10.4.5 South Korea
- 10.5 Latin America
- 10.5.1 Brazil
- 10.5.2 Mexico
- 10.5.3 Argentina
- 10.6 Middle East and Africa
- 10.6.1 South Africa
- 10.6.2 Saudi Arabia
- 10.6.3 UAE
Chapter 11 Company Profiles
- 11.1 Buddy (Ninja Management)
- 11.2 Dogtra
- 11.3 Fi Smart Dog Collar
- 11.4 Fitbark
- 11.5 Garmin
- 11.6 Halo Collar
- 11.7 KYON
- 11.8 Loc8tor
- 11.9 Link My Pet
- 11.10 Petcube
- 11.11 Petpace
- 11.12 PitPat
- 11.13 SportDOG
- 11.14 Tractive
- 11.15 Wagz

